Analysis of Rent Patterns for International Students in Australia

Verified

Added on  2019/11/29

|8
|2045
|148
Report
AI Summary
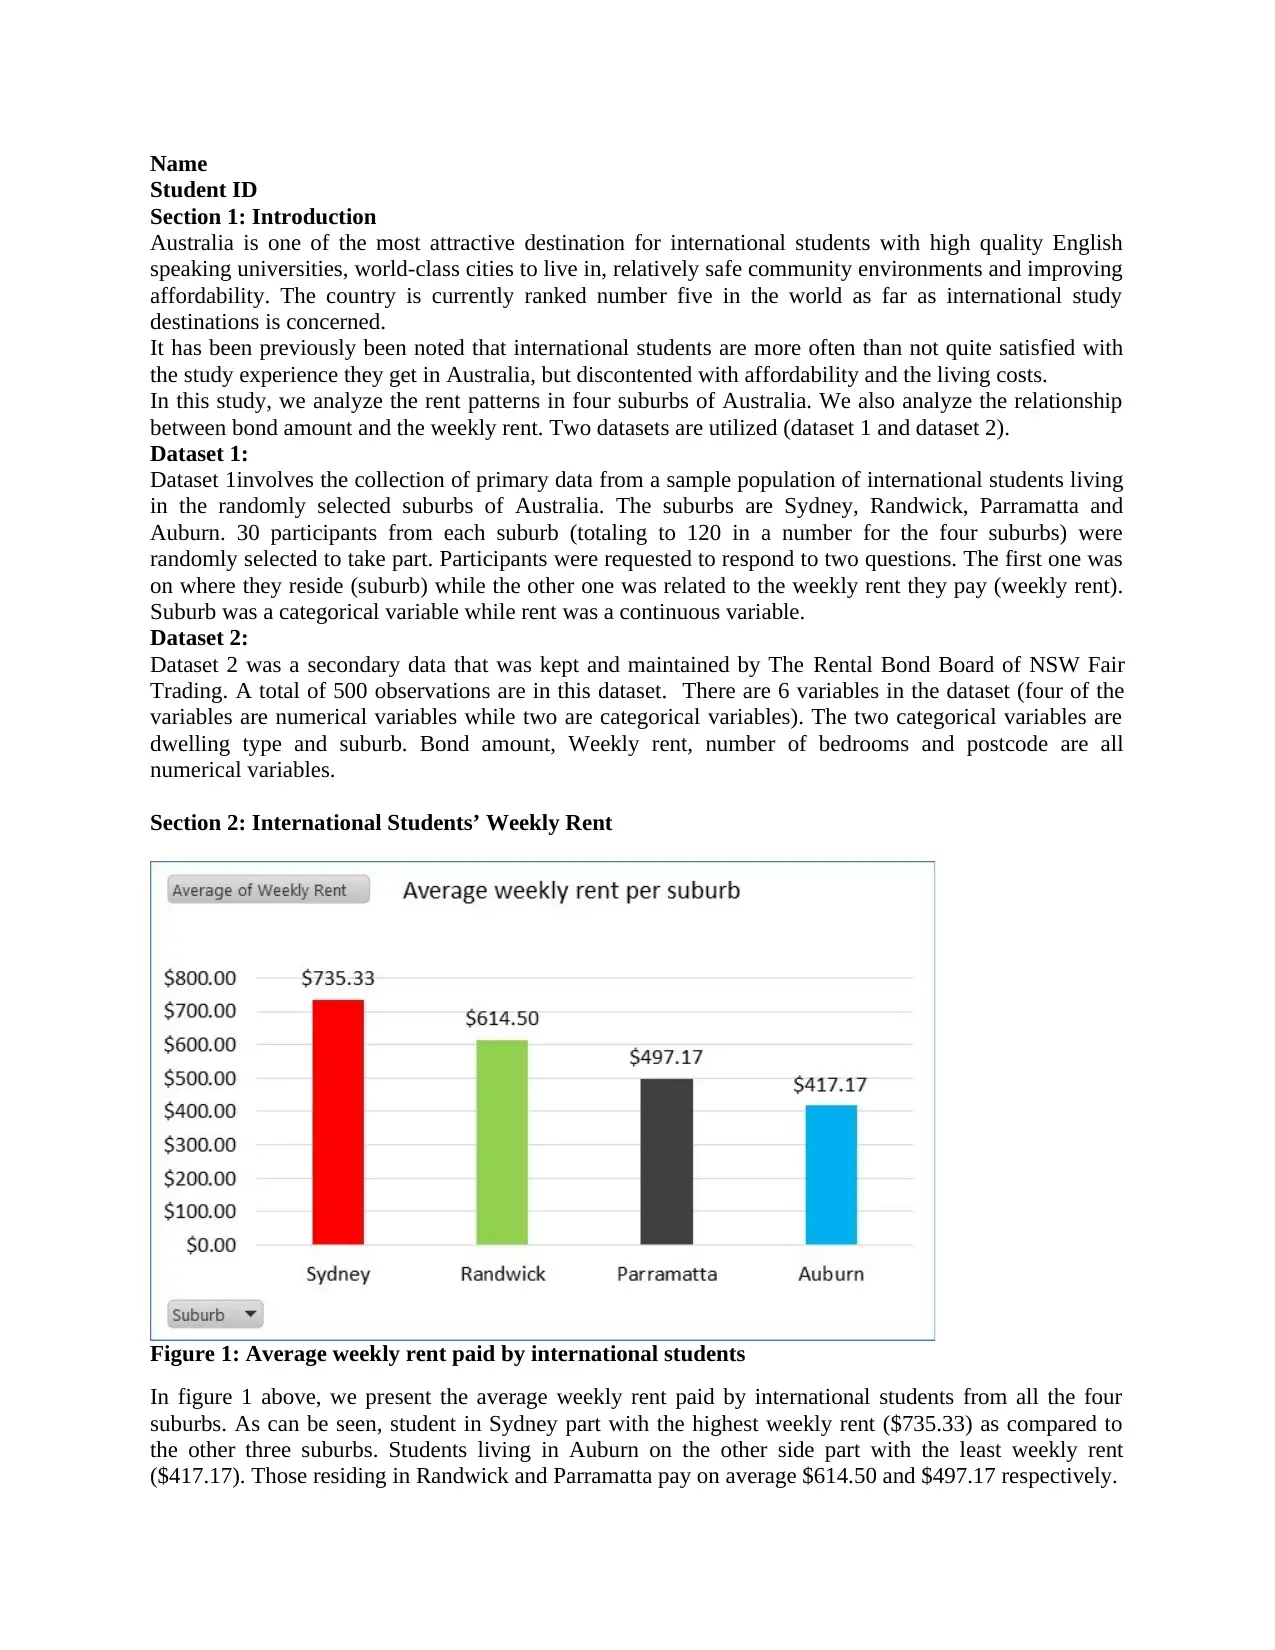
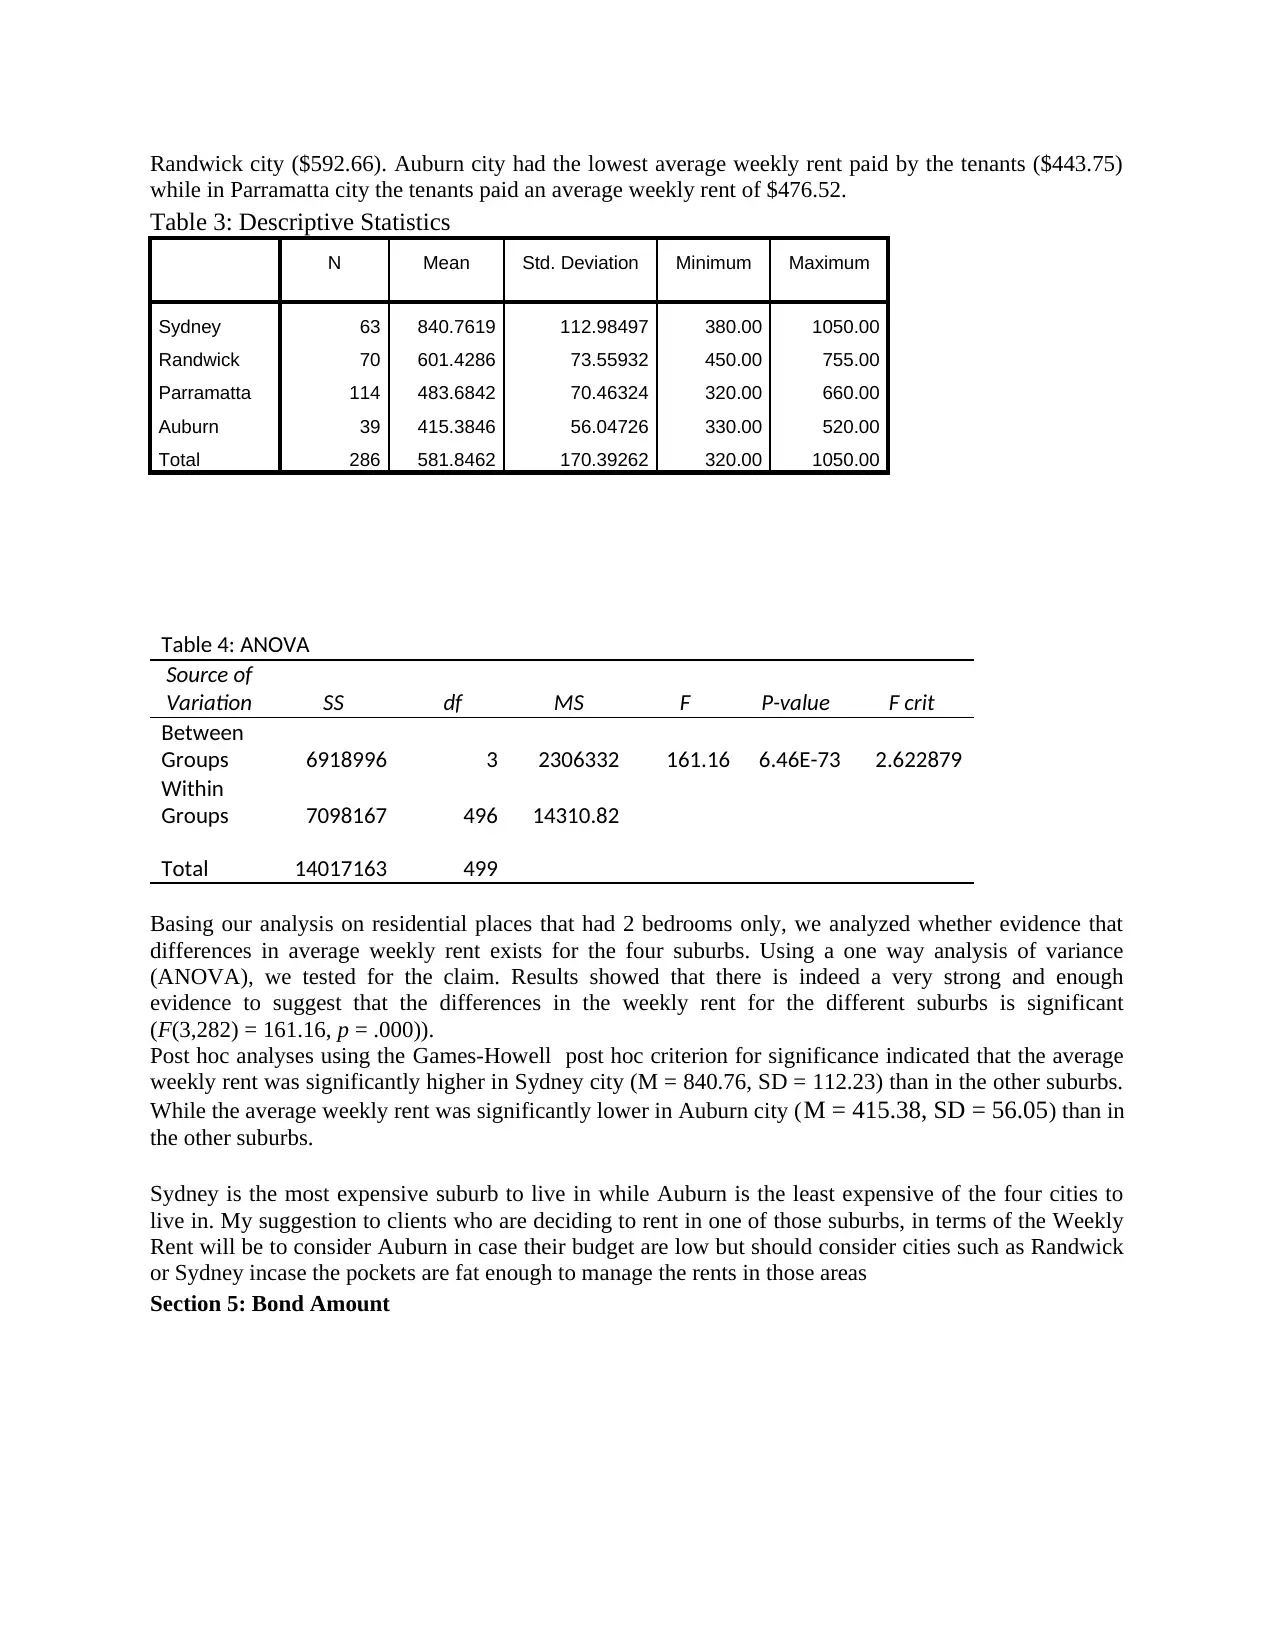
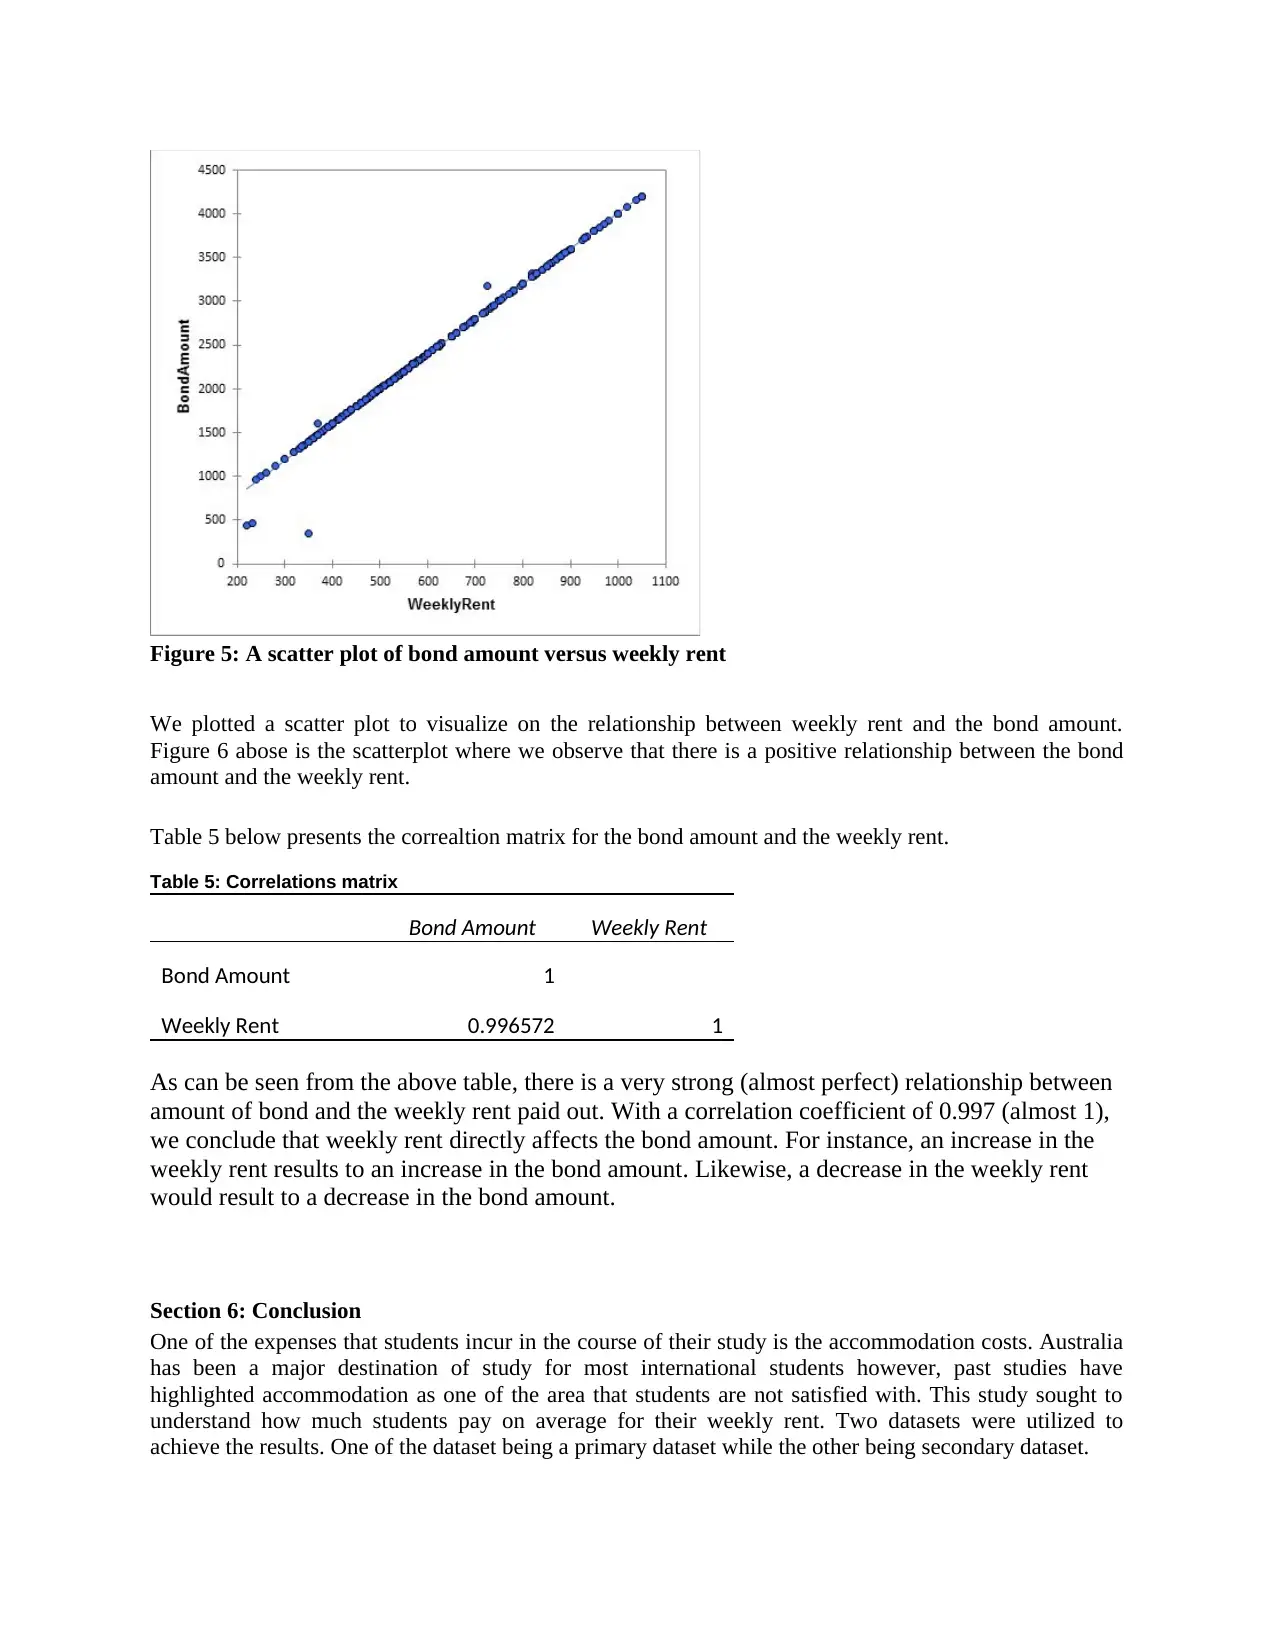
This report provides a detailed analysis of rent patterns and bond amounts for international students in Australia, utilizing both primary and secondary datasets. The study focuses on four suburbs: Sydney, Randwick, Parramatta, and Auburn. The analysis includes the average weekly rent paid by students in each suburb, revealing Sydney as the most expensive and Auburn as the least expensive. The report also examines dwelling types, finding that flats are the most common type of accommodation. Furthermore, the study explores the relationship between weekly rent and bond amounts, establishing a strong positive correlation. The findings highlight significant variations in rent costs across different suburbs and offer insights into the factors influencing accommodation expenses for international students in Australia, with recommendations for future research to include a larger sample size and a wider range of suburbs.
tabler-icon-diamond-filled.svg

Contribute Materials

Your contribution can guide someone’s learning journey. Share your documents today.
Document Page
Name
Student ID
Section 1: Introduction
Australia is one of the most attractive destination for international students with high quality English
speaking universities, world-class cities to live in, relatively safe community environments and improving
affordability. The country is currently ranked number five in the world as far as international study
destinations is concerned.
It has been previously been noted that international students are more often than not quite satisfied with
the study experience they get in Australia, but discontented with affordability and the living costs.
In this study, we analyze the rent patterns in four suburbs of Australia. We also analyze the relationship
between bond amount and the weekly rent. Two datasets are utilized (dataset 1 and dataset 2).
Dataset 1:
Dataset 1involves the collection of primary data from a sample population of international students living
in the randomly selected suburbs of Australia. The suburbs are Sydney, Randwick, Parramatta and
Auburn. 30 participants from each suburb (totaling to 120 in a number for the four suburbs) were
randomly selected to take part. Participants were requested to respond to two questions. The first one was
on where they reside (suburb) while the other one was related to the weekly rent they pay (weekly rent).
Suburb was a categorical variable while rent was a continuous variable.
Dataset 2:
Dataset 2 was a secondary data that was kept and maintained by The Rental Bond Board of NSW Fair
Trading. A total of 500 observations are in this dataset. There are 6 variables in the dataset (four of the
variables are numerical variables while two are categorical variables). The two categorical variables are
dwelling type and suburb. Bond amount, Weekly rent, number of bedrooms and postcode are all
numerical variables.
Section 2: International Students’ Weekly Rent
Figure 1: Average weekly rent paid by international students
In figure 1 above, we present the average weekly rent paid by international students from all the four
suburbs. As can be seen, student in Sydney part with the highest weekly rent ($735.33) as compared to
the other three suburbs. Students living in Auburn on the other side part with the least weekly rent
($417.17). Those residing in Randwick and Parramatta pay on average $614.50 and $497.17 respectively.
tabler-icon-diamond-filled.svg

Secure Best Marks with AI Grader

Need help grading? Try our AI Grader for instant feedback on your assignments.
Document Page
Table 1: Descriptive Statistics
Auburn Parramatta Randwick Sydney
Mean 417.17 497.17 614.50 735.33
Standard Error 4.00 4.98 7.05 7.24
Median 420.00 495.00 612.50 740.00
Mode 430.00 460.00 605.00 730.00
Standard
Deviation
21.92 27.28 38.63 39.67
Sample
Variance
480.49 744.28 1491.98 1574.02
Kurtosis -1.20 -0.82 -0.69 -0.51
Skewness -0.29 0.18 0.06 -0.36
Range 70.00 100.00 135.00 150.00
Minimum 380.00 450.00 550.00 650.00
Maximum 450.00 550.00 685.00 800.00
Sum 12515.00 14915.00 18435.00 22060.00
Count 30 30 30 30
We present the descriptive statistics for the weekly rent in table 1 above. As can be seen, the dataset looks
like it close to the normal distribution (the skewness values are close to zero). The average as well as the
standard deviations of the weekly rent for the various cities (suburbs) is also given.
Section 3: Rental Bond Board Property Data – Dwelling Type
Figure 2: Dwelling Types
Document Page
Using rental bond board property data, we sought to understand the distribution of the dwelling types. As
can be seen, most people live in flats (93%, n = 465) while those who said to live in houses represented
7% (n = 35).
Table 2: t-Test: Two-Sample Assuming
Equal Variances
Dwellin
g Type
Sam
ple
Mean 0.07 0.1
Variance
0.06523
046
0.09
018
Observations 500 500
Pooled Variance
0.07770
541
Hypothesized Mean
Difference 0
df 998
t Stat
-
1.70163
19
P(T<=t) one-tail
0.04456
792
t Critical one-tail
1.64638
188
P(T<=t) two-tail
0.08913
585
t Critical two-tail
1.96234
385
In this section, we sought to test where there is enough evidence to prove that the proportion
of House dwelling type is less than 10%. We performed a one-sample t-test at a 5% level of
significance. As can be seen, the proportion of respondents within the sample that lived in
houses was 7%. The p-value of the one-sample t-test was 0.009 (this value is less than α = 0.05),
with this we therefore reject the null hypothesis and make a conclusion that there is indeed
strong evidence to prove that the proportion of House dwelling type is less than 10%. A mean
difference of -0.030 was found to be statistically significant (95% CI, -0.05 to -0.01), t(499) = -2.627, p
= .009.
Document Page
The bar chart given above (figure 3) is a graphical representation of dwelling type based on the region
where the respondent live (suburb). The graph clearly shows that Sydney city had the lowest proportion
of people living in houses (only 0.6% live in houses). Auburn on the other hand had the highest
proportion (29.7%, n = 19) of people living in houses. 8.4% (n = 14) of the respondents living in
Parramatta liven houses while Randwick city had only 0.9% (n = 1) people living in houses.
For a client who would wish to rent a house instead of a flat, my advice to such a client would be to
consider suburbs such as Auburn and Parramatta but more specifically, I would urge him/her to look for
houses in Auburn. This is based on the fact that few people live in rented houses in Sydney and
Randwick. So the most probable reason could be that there are no houses in those two cities for people to
rent out hence the low proportion of people living in houses compared to the flats (more than 99% of
residents of Sydney and Randwick live in flats).
Section 4: Rental Bond Board Property Data – Weekly Rent
Figure 4: Average weekly rent for the four different suburbs
Weekly rent paid by the international students was one of the variables that was analyzed in this report.
The suburb with the highest average weekly rent was Sydney ($738.83) it was closely followed by
Figure 3: Dwelling type versus suburb
tabler-icon-diamond-filled.svg

Secure Best Marks with AI Grader

Need help grading? Try our AI Grader for instant feedback on your assignments.
Document Page
Randwick city ($592.66). Auburn city had the lowest average weekly rent paid by the tenants ($443.75)
while in Parramatta city the tenants paid an average weekly rent of $476.52.
Table 3: Descriptive Statistics
N Mean Std. Deviation Minimum Maximum
Sydney 63 840.7619 112.98497 380.00 1050.00
Randwick 70 601.4286 73.55932 450.00 755.00
Parramatta 114 483.6842 70.46324 320.00 660.00
Auburn 39 415.3846 56.04726 330.00 520.00
Total 286 581.8462 170.39262 320.00 1050.00
Table 4: ANOVA
Source of
Variation SS df MS F P-value F crit
Between
Groups 6918996 3 2306332 161.16 6.46E-73 2.622879
Within
Groups 7098167 496 14310.82
Total 14017163 499
Basing our analysis on residential places that had 2 bedrooms only, we analyzed whether evidence that
differences in average weekly rent exists for the four suburbs. Using a one way analysis of variance
(ANOVA), we tested for the claim. Results showed that there is indeed a very strong and enough
evidence to suggest that the differences in the weekly rent for the different suburbs is significant
(F(3,282) = 161.16, p = .000)).
Post hoc analyses using the Games-Howell post hoc criterion for significance indicated that the average
weekly rent was significantly higher in Sydney city (M = 840.76, SD = 112.23) than in the other suburbs.
While the average weekly rent was significantly lower in Auburn city (M = 415.38, SD = 56.05) than in
the other suburbs.
Sydney is the most expensive suburb to live in while Auburn is the least expensive of the four cities to
live in. My suggestion to clients who are deciding to rent in one of those suburbs, in terms of the Weekly
Rent will be to consider Auburn in case their budget are low but should consider cities such as Randwick
or Sydney incase the pockets are fat enough to manage the rents in those areas
Section 5: Bond Amount
Document Page
Figure 5: A scatter plot of bond amount versus weekly rent
We plotted a scatter plot to visualize on the relationship between weekly rent and the bond amount.
Figure 6 abose is the scatterplot where we observe that there is a positive relationship between the bond
amount and the weekly rent.
Table 5 below presents the correaltion matrix for the bond amount and the weekly rent.
Table 5: Correlations matrix
Bond Amount Weekly Rent
Bond Amount 1
Weekly Rent 0.996572 1
As can be seen from the above table, there is a very strong (almost perfect) relationship between
amount of bond and the weekly rent paid out. With a correlation coefficient of 0.997 (almost 1),
we conclude that weekly rent directly affects the bond amount. For instance, an increase in the
weekly rent results to an increase in the bond amount. Likewise, a decrease in the weekly rent
would result to a decrease in the bond amount.
Section 6: Conclusion
One of the expenses that students incur in the course of their study is the accommodation costs. Australia
has been a major destination of study for most international students however, past studies have
highlighted accommodation as one of the area that students are not satisfied with. This study sought to
understand how much students pay on average for their weekly rent. Two datasets were utilized to
achieve the results. One of the dataset being a primary dataset while the other being secondary dataset.
Document Page
Results from this study showed that weekly rent paid by international students greatly vary across the four
suburbs under study. In particular, Sydney was identified as the most expensive study destination for
international students as far as rent is concerned. Auburn on the other hand was the least expensive city to
live in when compared to the other three cities. In fact all the four cities had average weekly rent that was
significantly different from any of the other cities.
Auburn city however, was the city with the highest number of people living in rented houses. Other cities
such as Sydney and Randwick had very small proportion of people living in rented houses.
We also established that a strong positive linear relationship exists between bond amount and weekly
rent.
In summary, results of this study gave interesting findings that would be very beneficial to the
international students who like to consider moving t o a cheaper suburb.
Future research should focus on a larger sample especially for the suburbs to be considered. This study
only focused on four suburbs despite the fact that there a very many suburbs in Australia.
References
Lopez-Paz , D., Hennig , P. & Schölkopf , B., 2013. The Randomized Dependence Coefficient.
Conference on Neural Information Processing Systems.
Nikolić, D., Muresan, R. C., Feng, W. & Singer, W., 2012. Scaled correlation analysis: a better way to
compute a cross-correlogram. European Journal of Neuroscience, p. 1–21.
Székely, G., Rizzo, J. & Bakirov, N. K., 2010. Measuring and testing independence by correlation of
distances. Annals of Statistics, 35(6), p. 2769–2794.
tabler-icon-diamond-filled.svg

Paraphrase This Document

Need a fresh take? Get an instant paraphrase of this document with our AI Paraphraser
Document Page
chevron_up_icon
1 out of 8
circle_padding
hide_on_mobile
zoom_out_icon
logo.png

Your All-in-One AI-Powered Toolkit for Academic Success.

Available 24*7 on WhatsApp / Email

[object Object]