International Students' Expenditure Patterns in Australia Research
VerifiedAdded on 2023/03/30
|16
|2813
|370
Report
AI Summary
This report investigates the expenditure patterns of international students in Australia, aiming to identify factors influencing their monthly income and spending habits. The study involved surveying 20 international students using a questionnaire to gather data on various expenses including rent, internet, entertainment, groceries, and phone plans, along with their monthly income. The analysis revealed both positive and negative correlations between income and different expenditure categories. Key findings indicate that rent, groceries, and internet expenses significantly impact the income of international students. The research recommends that students manage their internet spending to maintain a comfortable lifestyle. The report includes descriptive statistics, simple linear regression analysis, and a discussion of the data set, providing a comprehensive overview of the financial behaviors of international students in Australia.
Expenditure patterns of international
students in Australia
i
students in Australia
i
Paraphrase This Document
Need a fresh take? Get an instant paraphrase of this document with our AI Paraphraser
Executive summary
The general purpose of this study was to determine the expenditure patterns of international
students in Australia and other specific objectives were 1) to construct linear regression model
that determines expenditures that greatly affected monthly income of international students in
Australia and 2) to determine factors affecting income of international students in Australia. The
targeted population in this research were the international student in Australia. Random sampling
method was applied in the selection of the 20 international students and data collected using
questionnaire. There was both negative and positive correlation between income and other
expenditures. The determined factors affecting income of international students were rent,
groceries and internet that had great impact on income as concluded in the research. It was
therefore recommended that for the international students to maintain low comfortable life, they
had to reduce the expense on internet.
ii
Table of Contents
Executive summary.....................................................................................................................................ii
Introduction.................................................................................................................................................1
Specific objectives...................................................................................................................................1
Research Questions.................................................................................................................................1
Methods of data collection..........................................................................................................................2
Summary of data set....................................................................................................................................3
Descriptive analysis.....................................................................................................................................7
Simple linear regression analysis.................................................................................................................8
Conclusion and recommendations.............................................................................................................12
List of references.......................................................................................................................................13
iii
⊘ This is a preview!⊘
Do you want full access?
Subscribe today to unlock all pages.
Trusted by 1+ million students worldwide
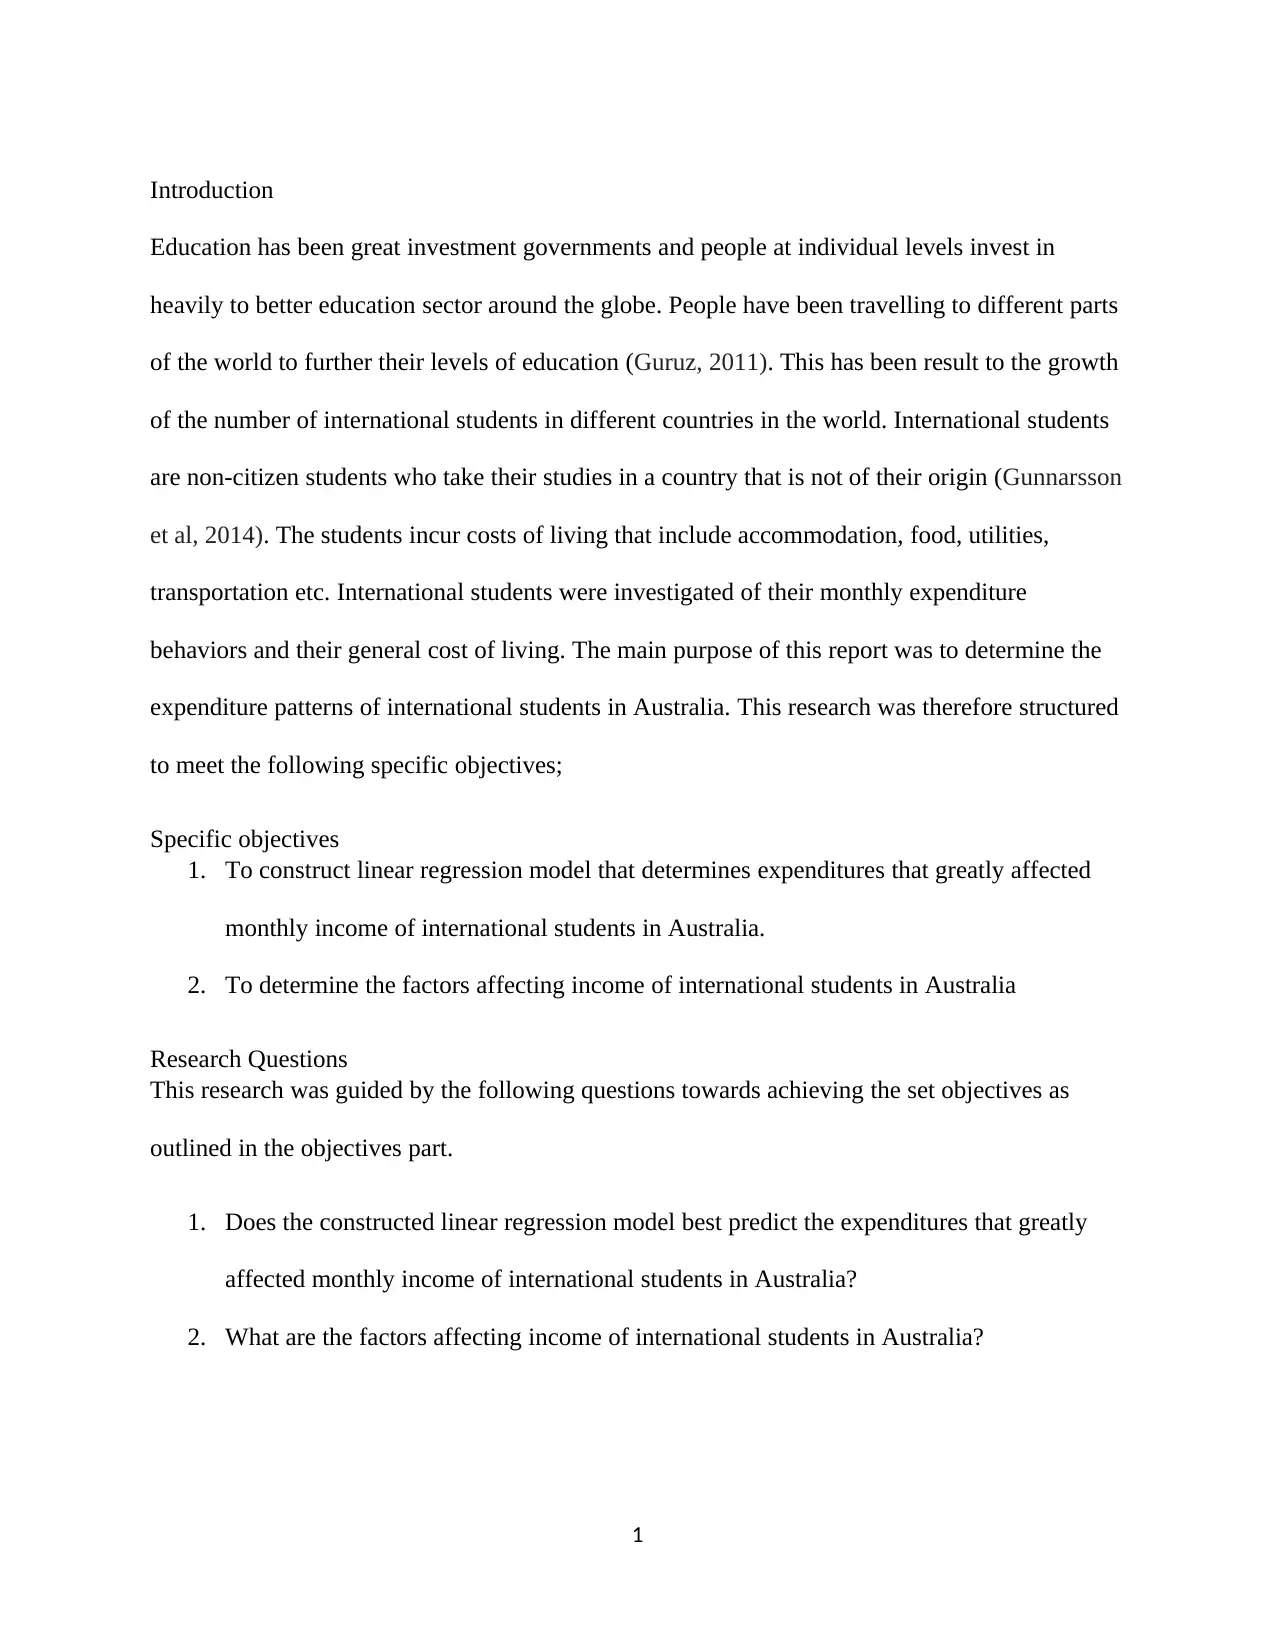
Introduction
Education has been great investment governments and people at individual levels invest in
heavily to better education sector around the globe. People have been travelling to different parts
of the world to further their levels of education (Guruz, 2011). This has been result to the growth
of the number of international students in different countries in the world. International students
are non-citizen students who take their studies in a country that is not of their origin (Gunnarsson
et al, 2014). The students incur costs of living that include accommodation, food, utilities,
transportation etc. International students were investigated of their monthly expenditure
behaviors and their general cost of living. The main purpose of this report was to determine the
expenditure patterns of international students in Australia. This research was therefore structured
to meet the following specific objectives;
Specific objectives
1. To construct linear regression model that determines expenditures that greatly affected
monthly income of international students in Australia.
2. To determine the factors affecting income of international students in Australia
Research Questions
This research was guided by the following questions towards achieving the set objectives as
outlined in the objectives part.
1. Does the constructed linear regression model best predict the expenditures that greatly
affected monthly income of international students in Australia?
2. What are the factors affecting income of international students in Australia?
1
Paraphrase This Document
Need a fresh take? Get an instant paraphrase of this document with our AI Paraphraser
Methods of data collection
Researchers do apply various methods to collect data of their interest that best answer their
research questions and thus meeting the research objectives. The targeted population is chosen in
line with the subject under investigation (Muhib et al, 2016). The researcher in this research
randomly selected the participants (international students) from the university. This probabilistic
method of respondents’ selection was opted for to minimize the chances of biasness in the data
collection process. Questionnaire is one of the data collection instrument that is widely used in
the survey process. It was preferred for use in this research due to its effectiveness for use in the
data collection process. A total of ten survey questions were supplied to the participants in the
questionnaires by the researcher under his administration. The used questionnaire was designed
with both open ended and closed ended questions as below;
1. State your gender
2. Kindly state your country of origin
3. Which course are you studying at the university?
4. Kindly state your age
5. What is your monthly rent expenditure?
6. What is your monthly internet expenditure?
7. What is your monthly entertainment expenditure?
8. What is your monthly grocery expenditure?
9. What is your planned expenditure on phone?
10. Averagely, what is your monthly income?
2
The data set was supplied to twenty randomly selected participants and it was constituted with
the following variables gender and course which were categorical variables, age, rent,
entertainment, internet, groceries, phone and income which were all continuous variables
Table 1: Data set
Gender Nationality Course Age Rent ($) Internet
($)
Entertainment
($)
Groceries
($)
Phone
($)
Income
($)
Female Turkey Accounting 25 652 54 200 90 100 3000
Female China Business
management
28 350 58 100 80 150 1500
Female China Information Science 24 1000 50 80 52 130 5000
Male Germany Statistics 21 280 52 65 50 144 2400
Male Greece Statistics 23 650 54 98 45 100 4800
Male Argentina Money and Banking 20 540 62 100 33 100 3245
Male Sweden Sport Science 35 500 60 145 50 50 260
Male Germany Law 36 440 62 150 33 54 2547
Female Nigeria Law 30 485 66 100 40 180 3000
Male USA Medicine 41 294 50 120 55 196 4560
Female USA Public Relation 25 852 70 37 60 200 5500
Male Sweden Civil Engineering 27 679 54 65 78 214 4500
Female UAE Software
Development
33 1200 72 60 70 97 10350
Male South
Africa
Information
Technology
29 780 65 66 60 140 3870
Male France Project Management 20 410 52 87 66 150 1890
Male France Nursing 24 238 50 70 69 180 2500
Male Estonia Law 26 560 60 150 35 190 2600
Female Japan Public Relation 21 390 66 130 30 240 4500
Female Japan Mechanical
Engineering
28 450 64 120 38 210 2360
Female Argentina Accounting 35 387 62 145 42 154 2400
Summary of data set
From the sampled data, dataset was summarized in graphs and tables as shown below;
Figure 1: Graph of gender
3
⊘ This is a preview!⊘
Do you want full access?
Subscribe today to unlock all pages.
Trusted by 1+ million students worldwide
Female Male
0
2
4
6
8
10
12
Graph of gender
Total
Gender
Frequency
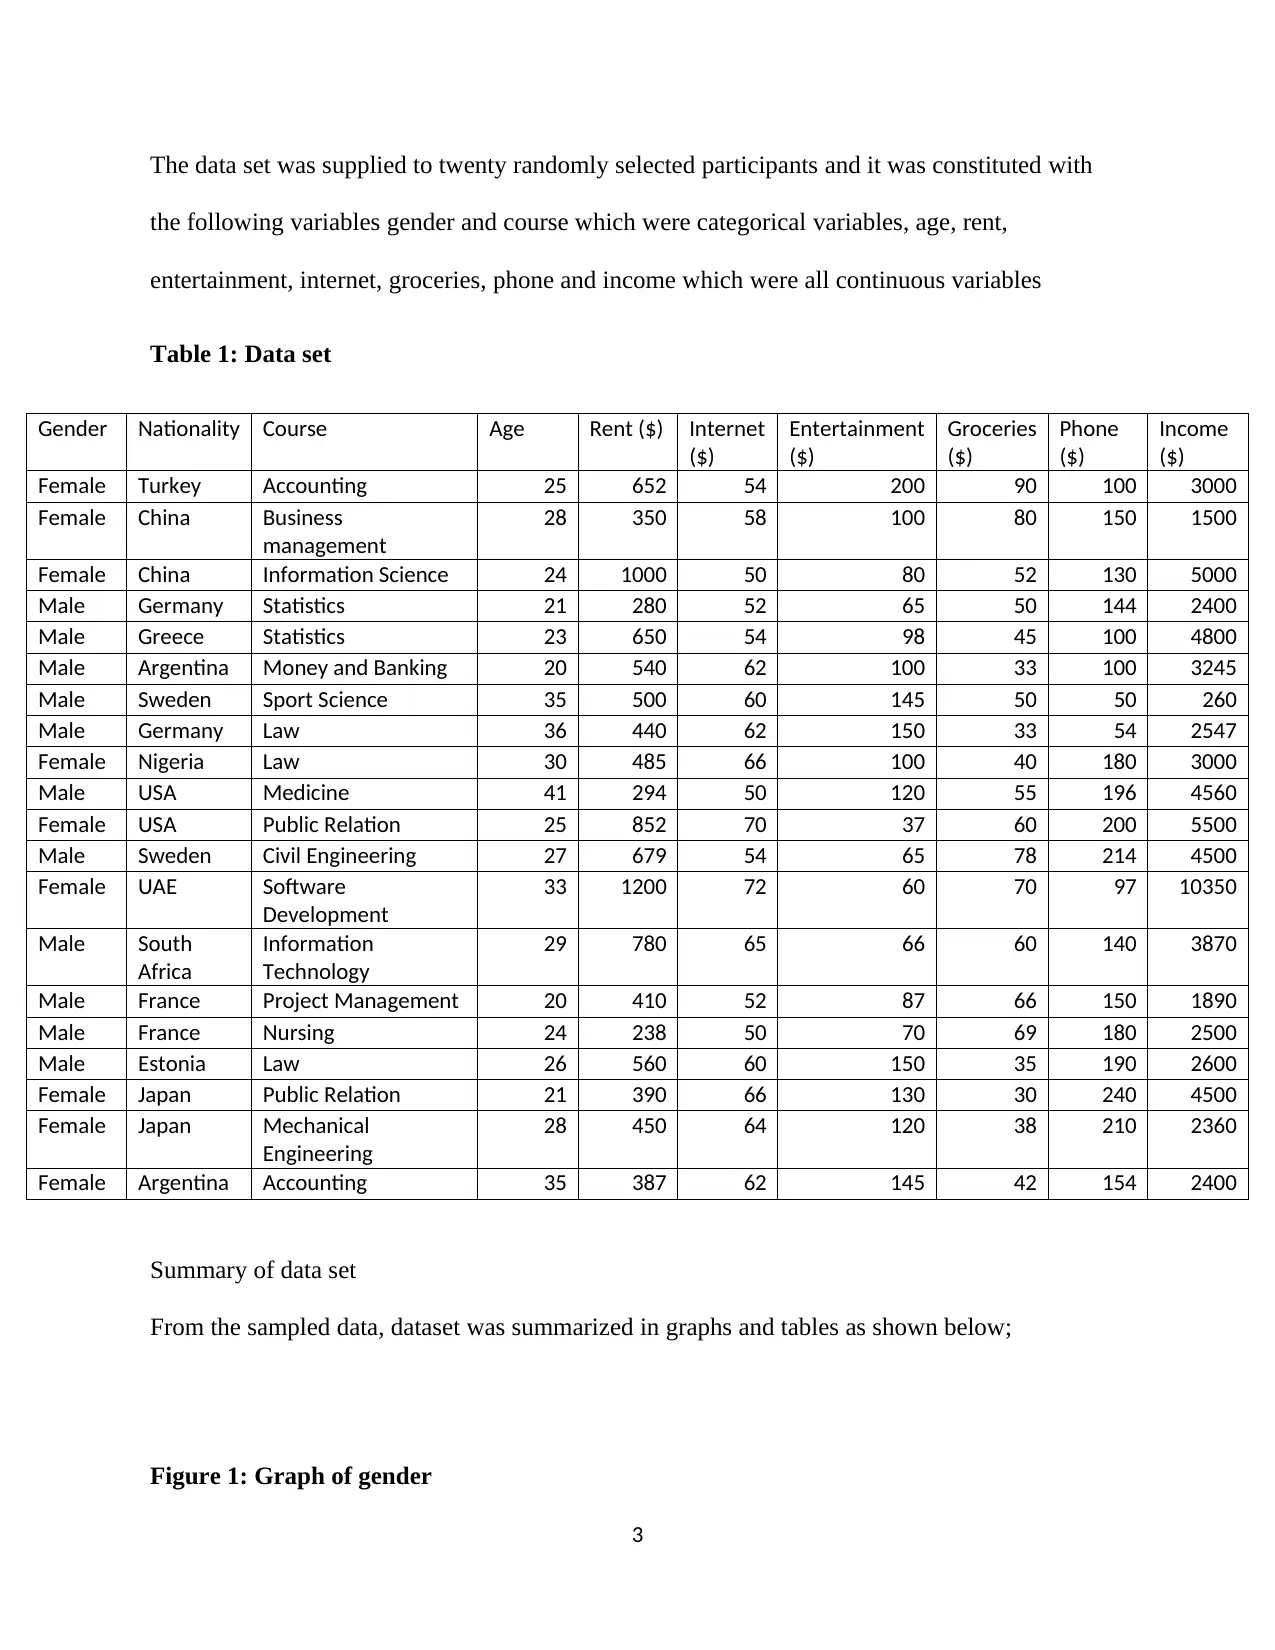
From the figure, nine female gender international students participated in the data collection
process against 11 male international students who also participated in the data collection survey
process. Out of 20 participants included in the survey process, male international students
dominated the sample in random selection.
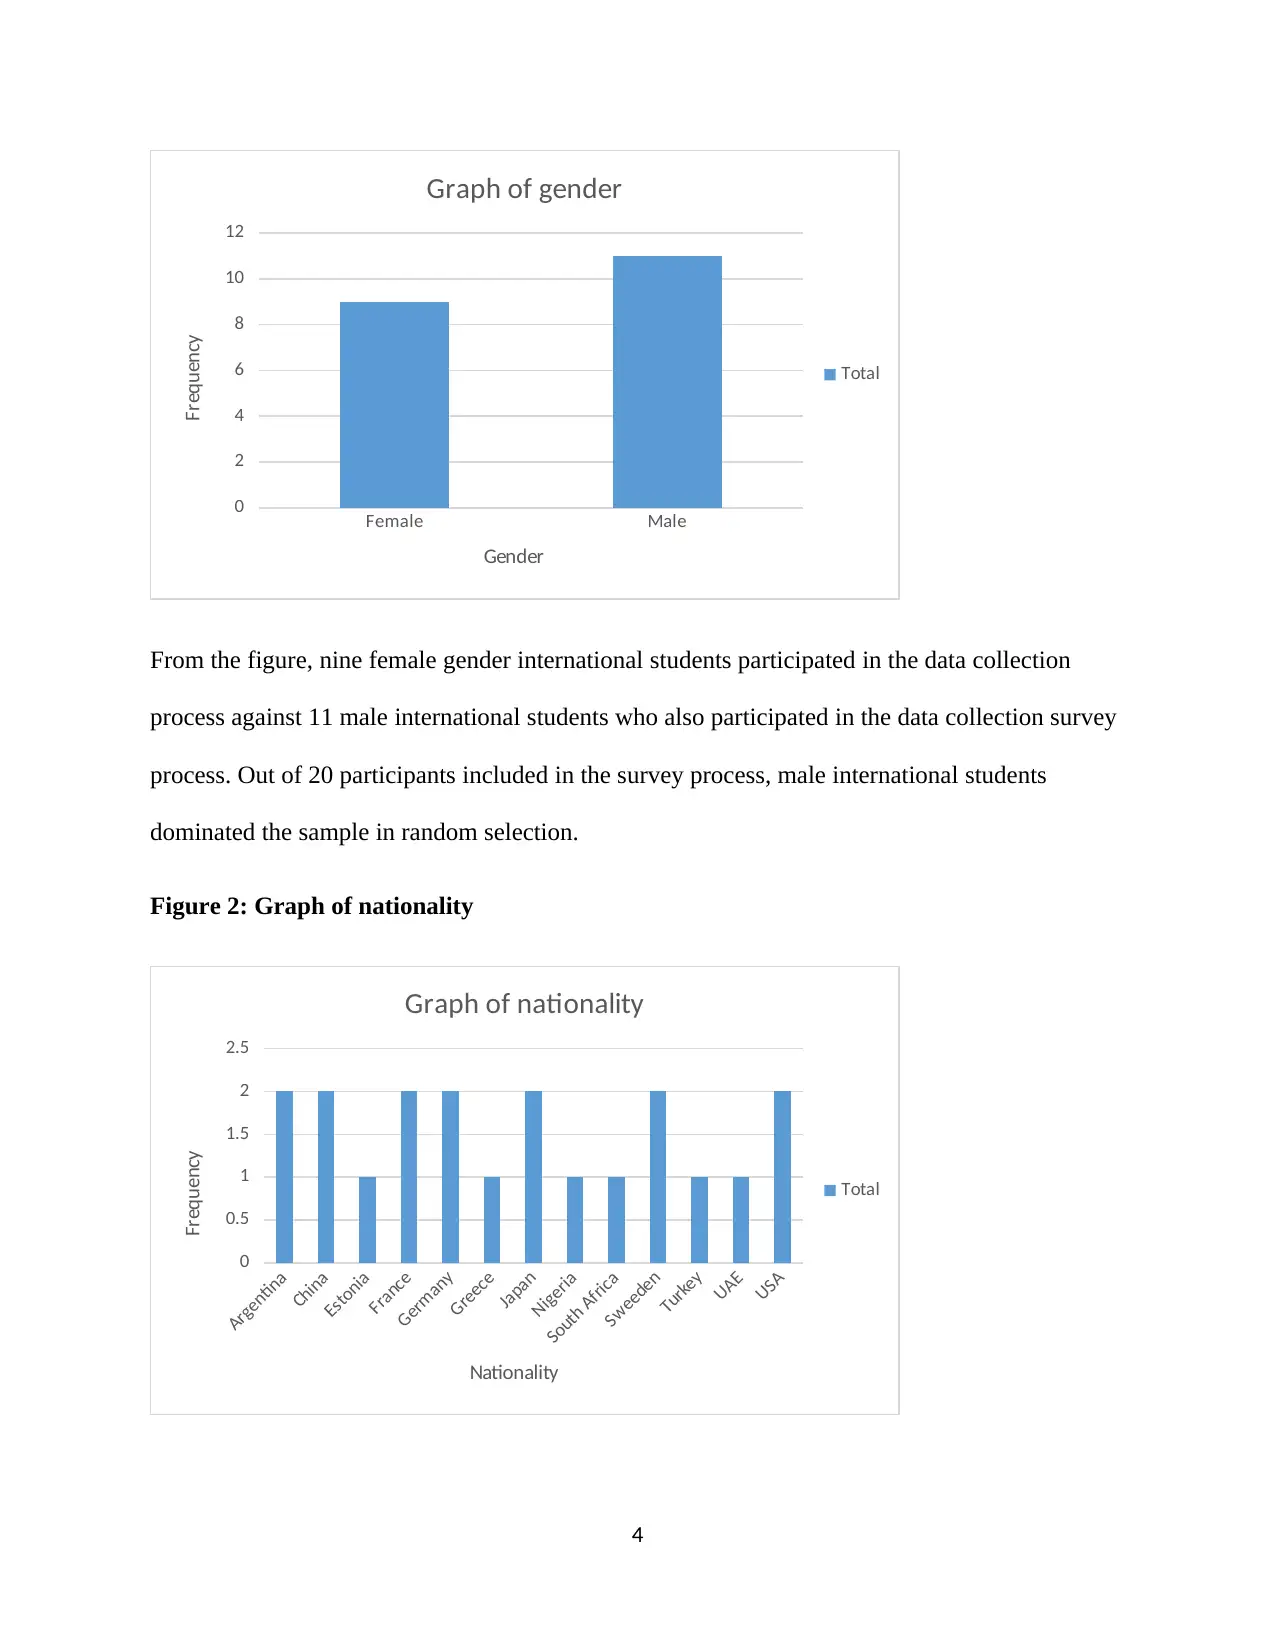
Figure 2: Graph of nationality
Argentina
China
Estonia
France
Germany
Greece
Japan
Nigeria
South Africa
Sweeden
Turkey
UAE
USA
0
0.5
1
1.5
2
2.5
Graph of nationality
Total
Nationality
Frequency
4
0
2
4
6
8
10
12
Graph of gender
Total
Gender
Frequency
From the figure, nine female gender international students participated in the data collection
process against 11 male international students who also participated in the data collection survey
process. Out of 20 participants included in the survey process, male international students
dominated the sample in random selection.
Figure 2: Graph of nationality
Argentina
China
Estonia
France
Germany
Greece
Japan
Nigeria
South Africa
Sweeden
Turkey
UAE
USA
0
0.5
1
1.5
2
2.5
Graph of nationality
Total
Nationality
Frequency
4
Paraphrase This Document
Need a fresh take? Get an instant paraphrase of this document with our AI Paraphraser
Being that the research targeted international students studying in Australia, the sampled students
were required to state their country of origin which were responded to as follows; 2 of 20
students were from Argentina, 2 from china, 1 from Estonia, 2 from Germany, 2 from France, 1
from Greece, 2 from Japan, one from Nigeria, 1 from South Africa, 2 from Sweden, 1 from
Turkey, 1 from UAE and lastly 2 from the USA.
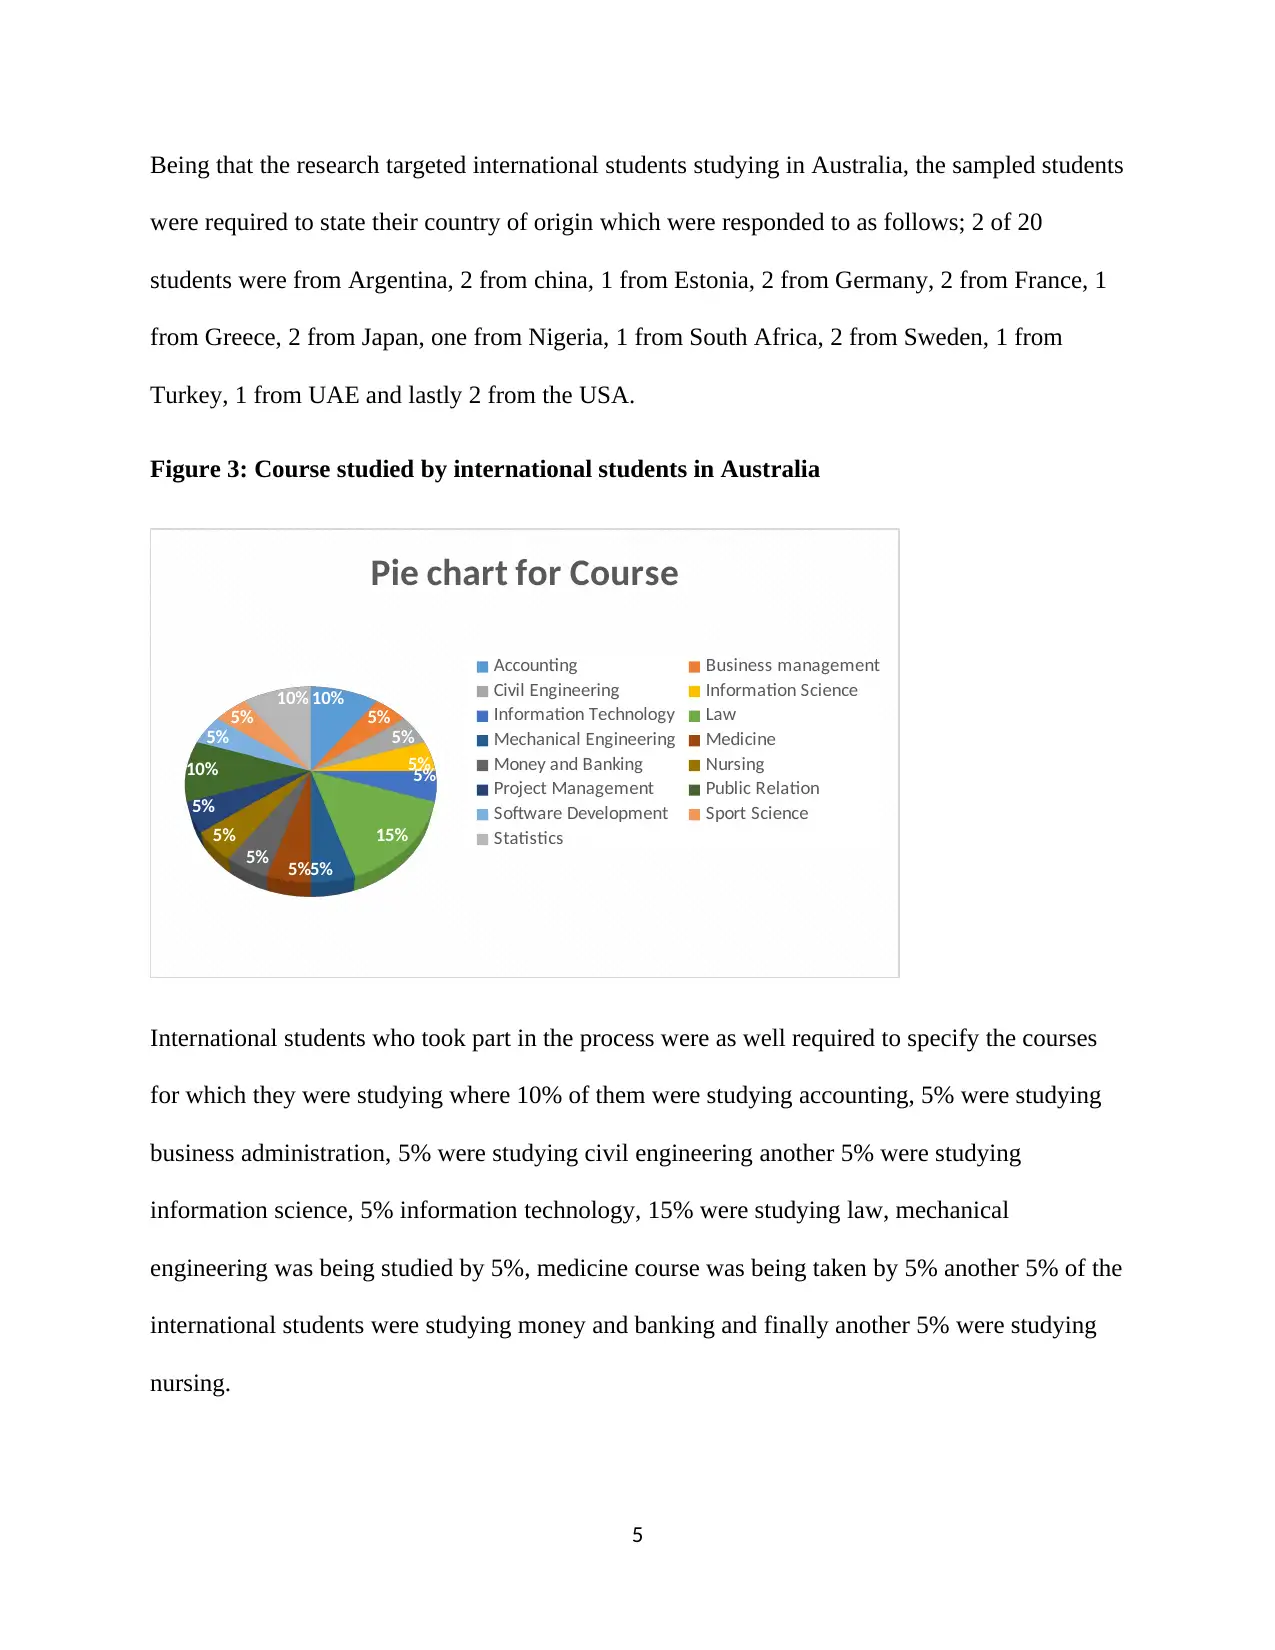
Figure 3: Course studied by international students in Australia
10% 5%
5%
5%
5%
15%
5%5%
5%
5%
5%
10%
5%
5% 10%
Pie chart for Course
Accounting Business management
Civil Engineering Information Science
Information Technology Law
Mechanical Engineering Medicine
Money and Banking Nursing
Project Management Public Relation
Software Development Sport Science
Statistics
International students who took part in the process were as well required to specify the courses
for which they were studying where 10% of them were studying accounting, 5% were studying
business administration, 5% were studying civil engineering another 5% were studying
information science, 5% information technology, 15% were studying law, mechanical
engineering was being studied by 5%, medicine course was being taken by 5% another 5% of the
international students were studying money and banking and finally another 5% were studying
nursing.
5
were required to state their country of origin which were responded to as follows; 2 of 20
students were from Argentina, 2 from china, 1 from Estonia, 2 from Germany, 2 from France, 1
from Greece, 2 from Japan, one from Nigeria, 1 from South Africa, 2 from Sweden, 1 from
Turkey, 1 from UAE and lastly 2 from the USA.
Figure 3: Course studied by international students in Australia
10% 5%
5%
5%
5%
15%
5%5%
5%
5%
5%
10%
5%
5% 10%
Pie chart for Course
Accounting Business management
Civil Engineering Information Science
Information Technology Law
Mechanical Engineering Medicine
Money and Banking Nursing
Project Management Public Relation
Software Development Sport Science
Statistics
International students who took part in the process were as well required to specify the courses
for which they were studying where 10% of them were studying accounting, 5% were studying
business administration, 5% were studying civil engineering another 5% were studying
information science, 5% information technology, 15% were studying law, mechanical
engineering was being studied by 5%, medicine course was being taken by 5% another 5% of the
international students were studying money and banking and finally another 5% were studying
nursing.
5
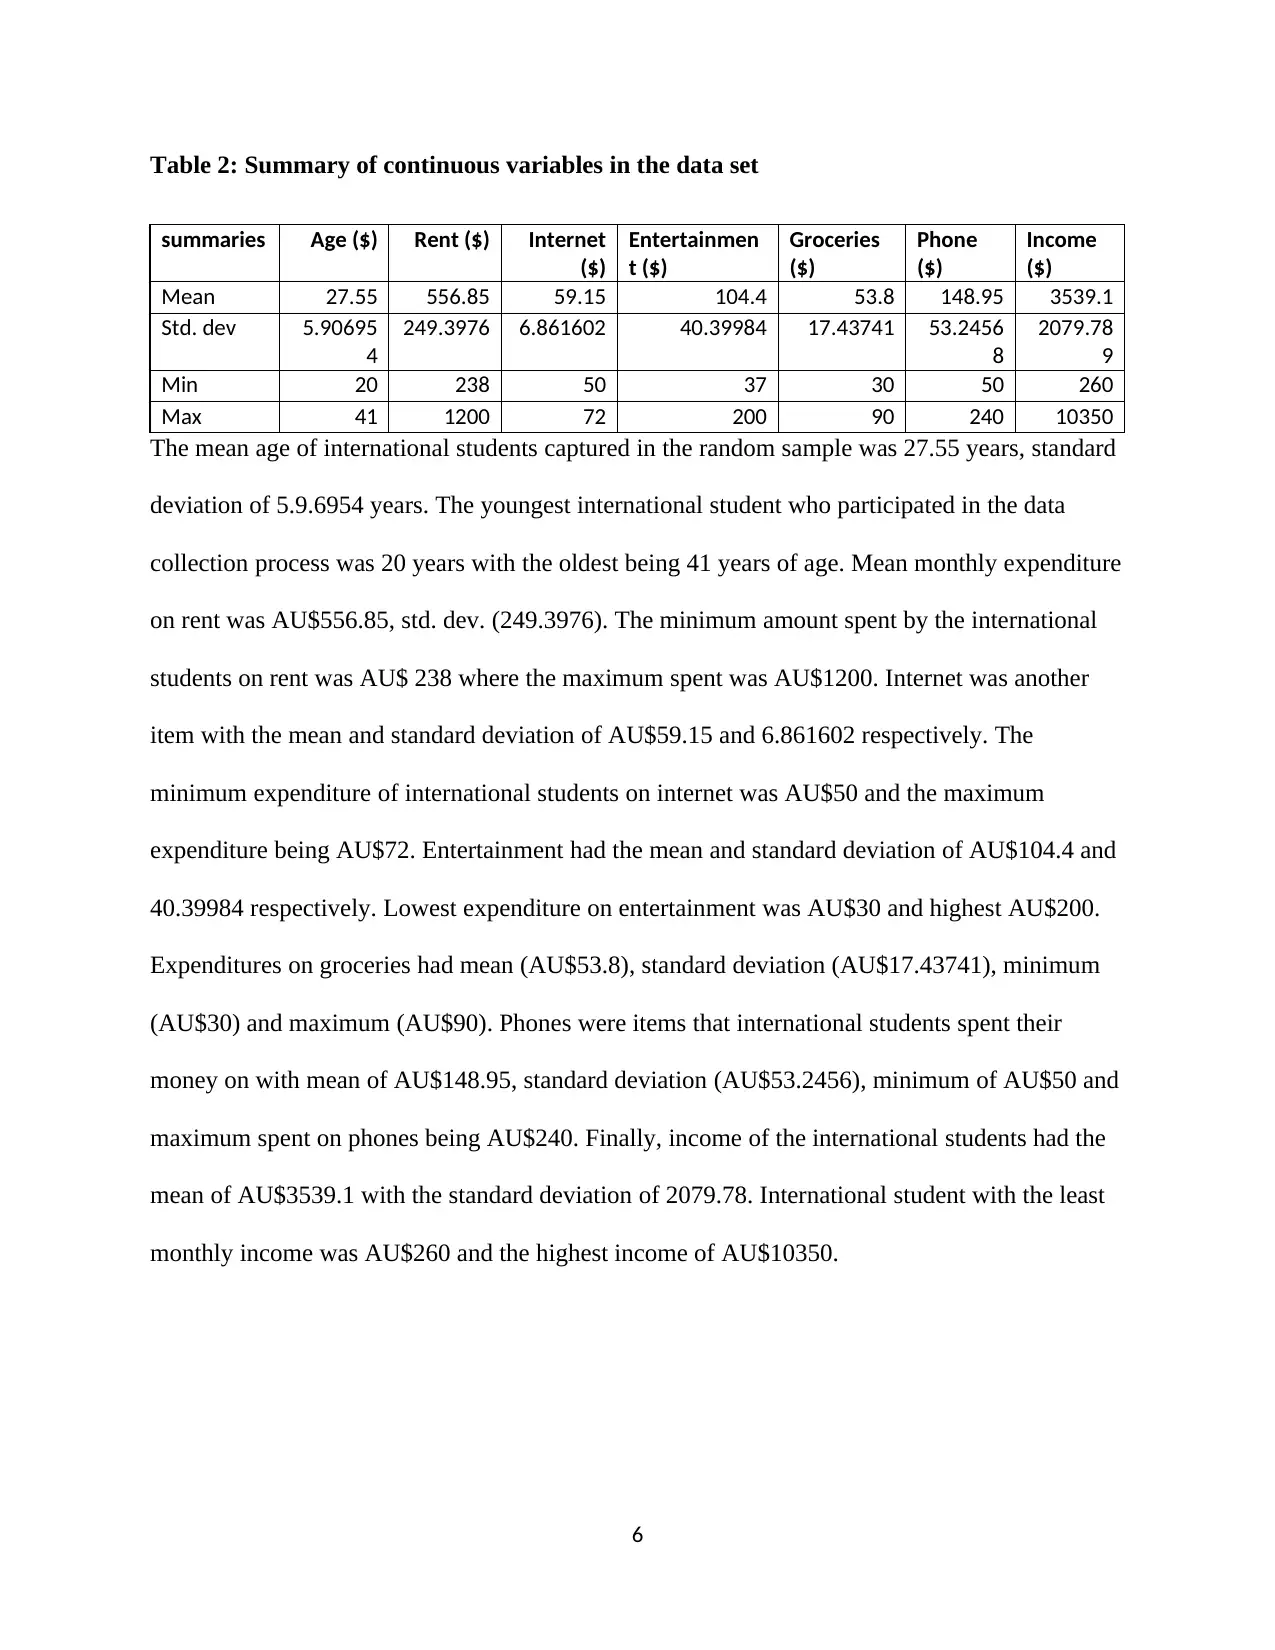
Table 2: Summary of continuous variables in the data set
summaries Age ($) Rent ($) Internet
($)
Entertainmen
t ($)
Groceries
($)
Phone
($)
Income
($)
Mean 27.55 556.85 59.15 104.4 53.8 148.95 3539.1
Std. dev 5.90695
4
249.3976 6.861602 40.39984 17.43741 53.2456
8
2079.78
9
Min 20 238 50 37 30 50 260
Max 41 1200 72 200 90 240 10350
The mean age of international students captured in the random sample was 27.55 years, standard
deviation of 5.9.6954 years. The youngest international student who participated in the data
collection process was 20 years with the oldest being 41 years of age. Mean monthly expenditure
on rent was AU$556.85, std. dev. (249.3976). The minimum amount spent by the international
students on rent was AU$ 238 where the maximum spent was AU$1200. Internet was another
item with the mean and standard deviation of AU$59.15 and 6.861602 respectively. The
minimum expenditure of international students on internet was AU$50 and the maximum
expenditure being AU$72. Entertainment had the mean and standard deviation of AU$104.4 and
40.39984 respectively. Lowest expenditure on entertainment was AU$30 and highest AU$200.
Expenditures on groceries had mean (AU$53.8), standard deviation (AU$17.43741), minimum
(AU$30) and maximum (AU$90). Phones were items that international students spent their
money on with mean of AU$148.95, standard deviation (AU$53.2456), minimum of AU$50 and
maximum spent on phones being AU$240. Finally, income of the international students had the
mean of AU$3539.1 with the standard deviation of 2079.78. International student with the least
monthly income was AU$260 and the highest income of AU$10350.
6
⊘ This is a preview!⊘
Do you want full access?
Subscribe today to unlock all pages.
Trusted by 1+ million students worldwide
Descriptive analysis
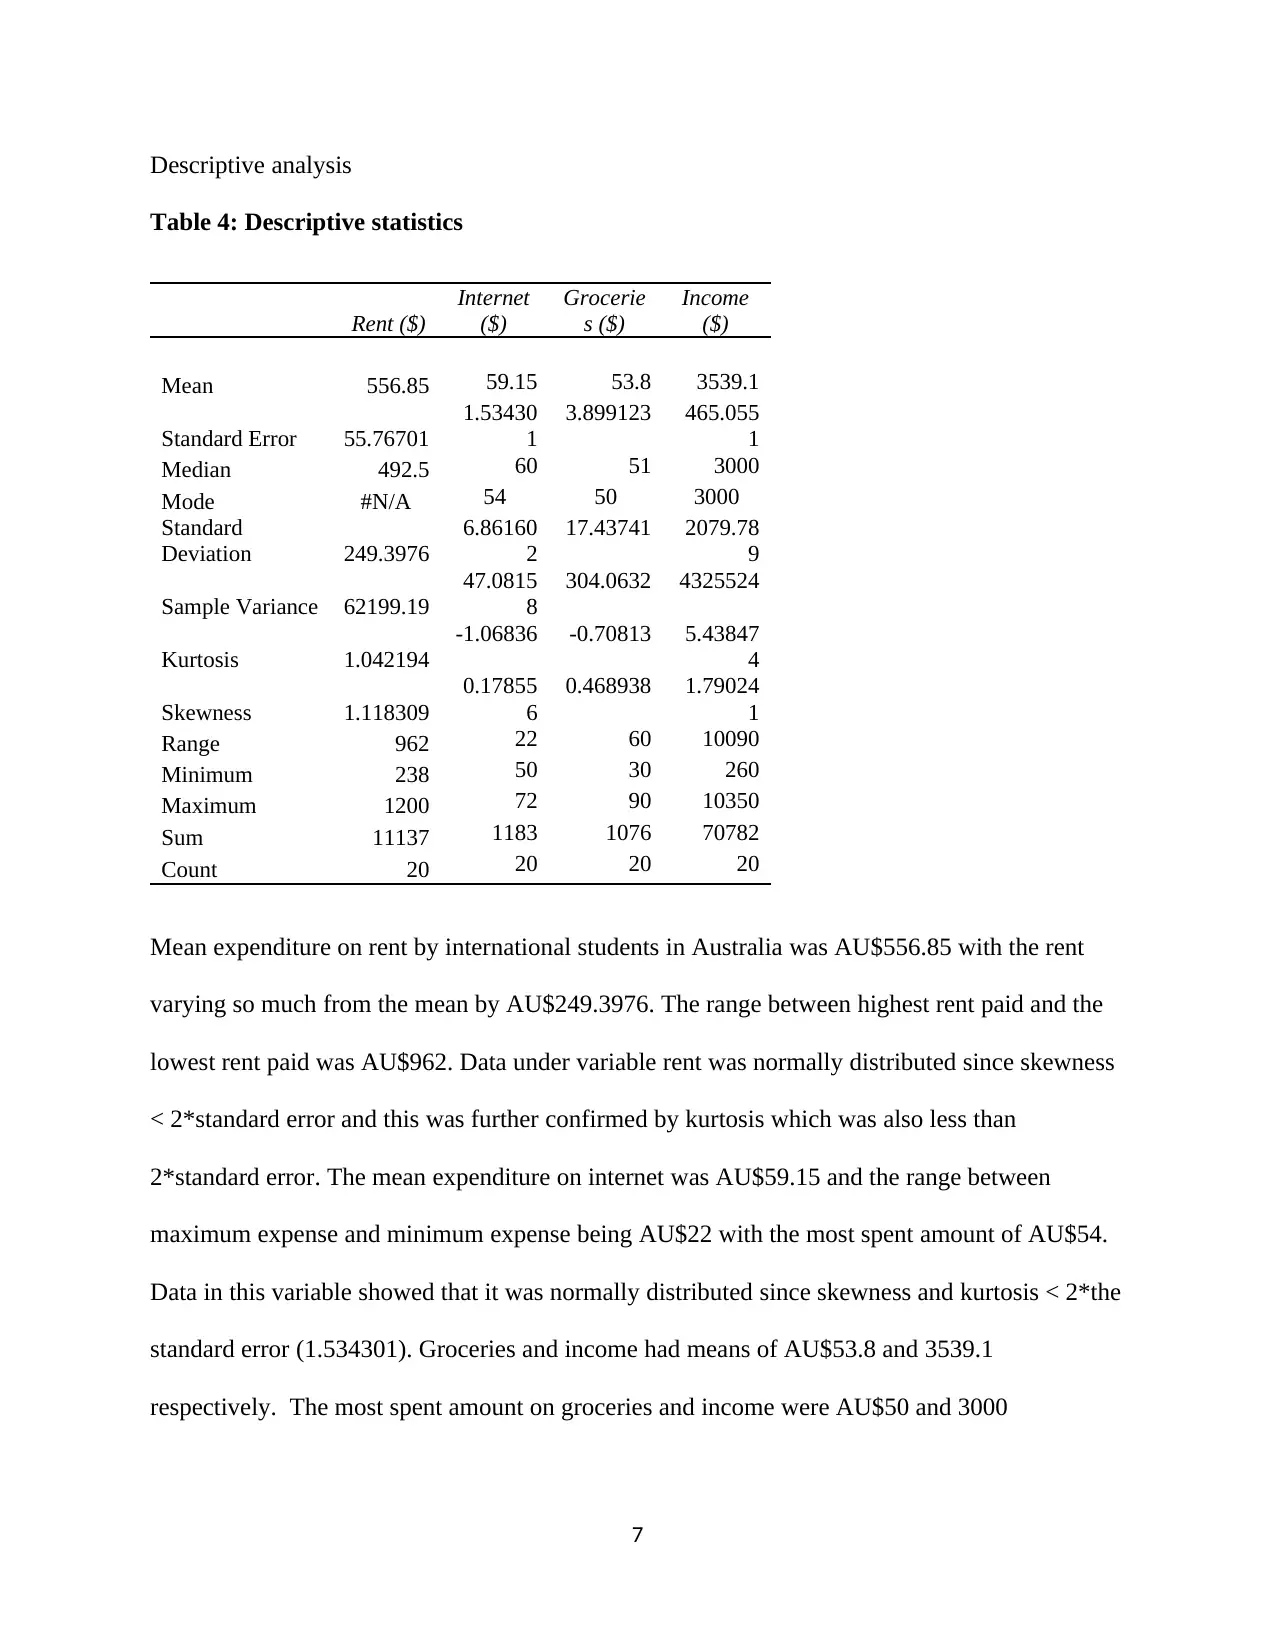
Table 4: Descriptive statistics
Rent ($)
Internet
($)
Grocerie
s ($)
Income
($)
Mean 556.85 59.15 53.8 3539.1
Standard Error 55.76701
1.53430
1
3.899123 465.055
1
Median 492.5 60 51 3000
Mode #N/A 54 50 3000
Standard
Deviation 249.3976
6.86160
2
17.43741 2079.78
9
Sample Variance 62199.19
47.0815
8
304.0632 4325524
Kurtosis 1.042194
-1.06836 -0.70813 5.43847
4
Skewness 1.118309
0.17855
6
0.468938 1.79024
1
Range 962 22 60 10090
Minimum 238 50 30 260
Maximum 1200 72 90 10350
Sum 11137 1183 1076 70782
Count 20 20 20 20
Mean expenditure on rent by international students in Australia was AU$556.85 with the rent
varying so much from the mean by AU$249.3976. The range between highest rent paid and the
lowest rent paid was AU$962. Data under variable rent was normally distributed since skewness
< 2*standard error and this was further confirmed by kurtosis which was also less than
2*standard error. The mean expenditure on internet was AU$59.15 and the range between
maximum expense and minimum expense being AU$22 with the most spent amount of AU$54.
Data in this variable showed that it was normally distributed since skewness and kurtosis < 2*the
standard error (1.534301). Groceries and income had means of AU$53.8 and 3539.1
respectively. The most spent amount on groceries and income were AU$50 and 3000
7
Paraphrase This Document
Need a fresh take? Get an instant paraphrase of this document with our AI Paraphraser
respectively. Considering the values of kurtosis and skewness, they were both less than two
times their standard errors and thus normally distributed.
From the previous research by (Norton and Cherastidtham, 2016), the research reported that
international students spent a total of $4784.90 which translated to $396.17 per month or weekly
pay of $99.77. In this report, the average monthly expenditure on rent was AU$556.85 which
translated to an equivalent of $386.17. The values are nearly equal with the current rent
expenditure relatively lower. Reports further indicated that expenditure on food and groceries
was $3491.16 which was monthly expense of $290.93 (Loomes and Croft, 2013) while in this
report groceries monthly expenditure was $37.31. Internet and other electronics spent was
averagely $64.16 per student per month among expenses of other items
Simple linear regression analysis
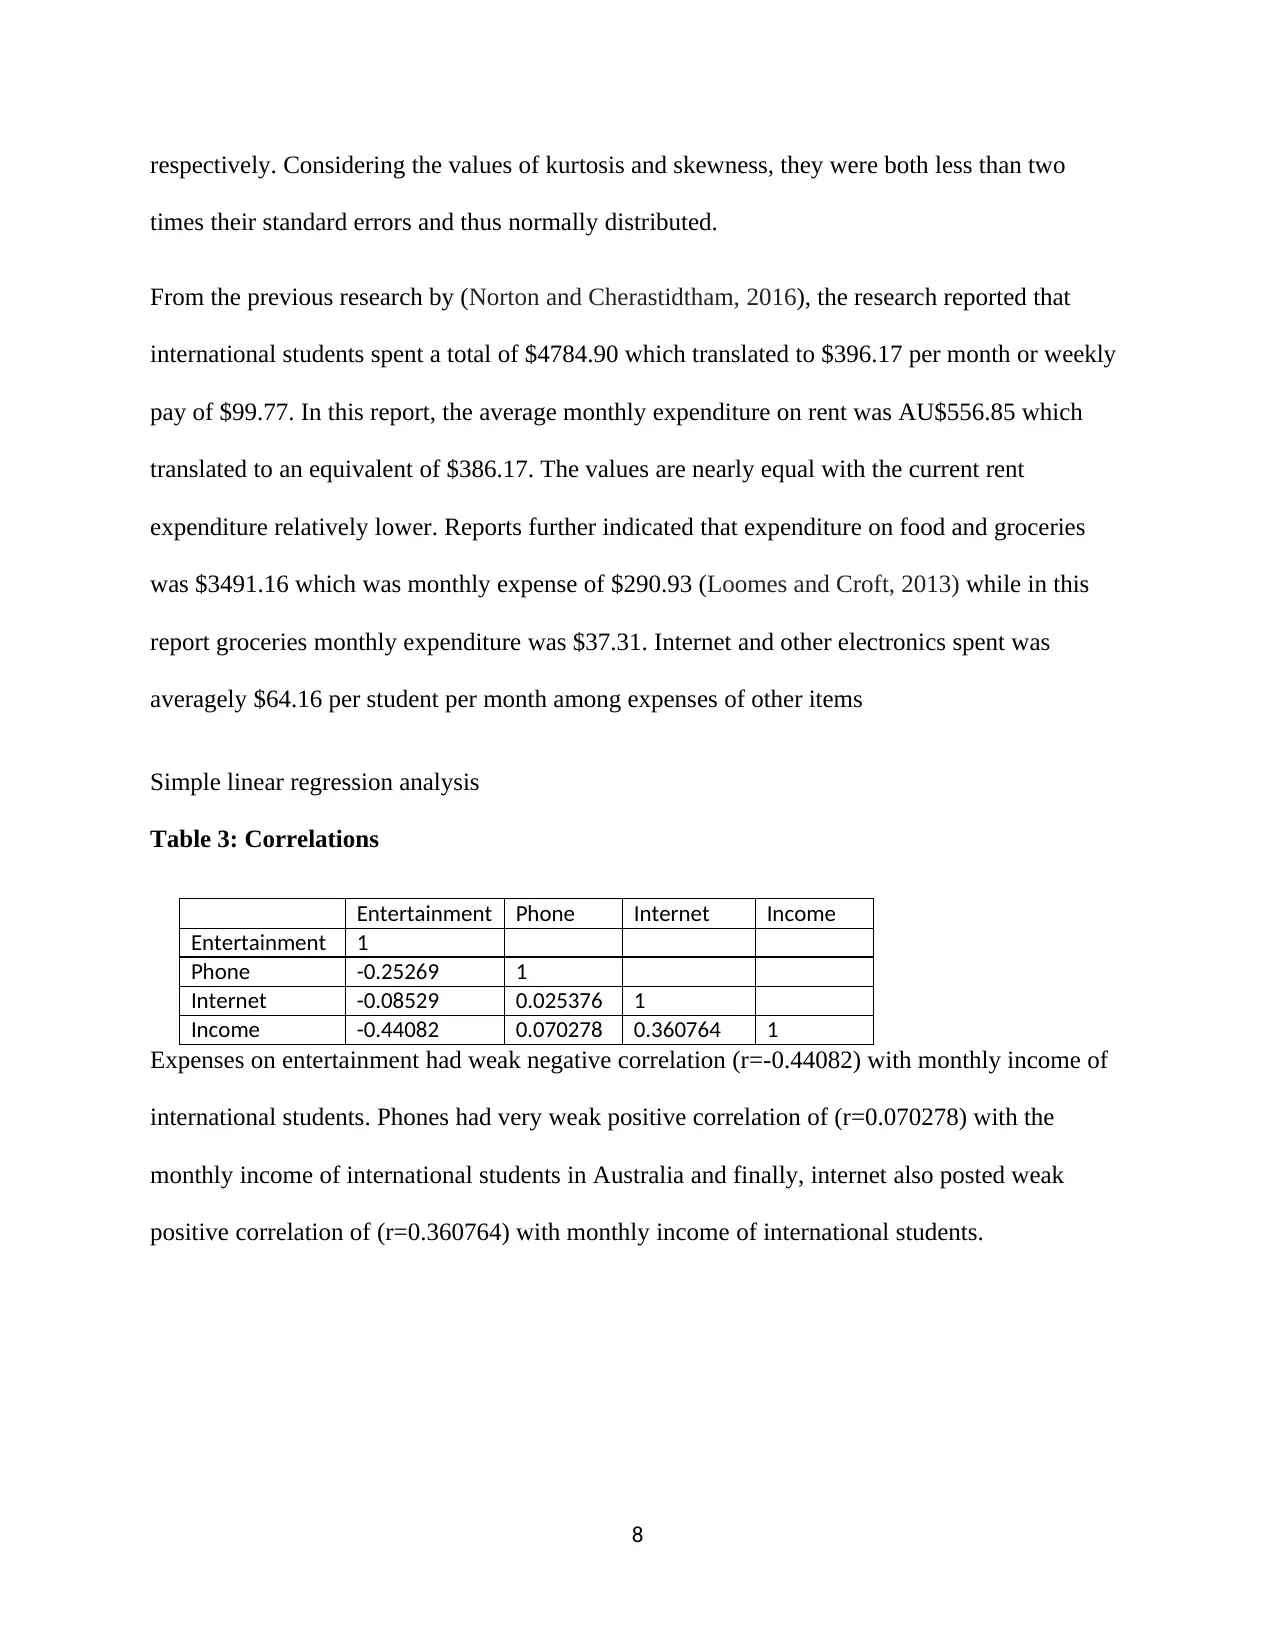
Table 3: Correlations
Entertainment Phone Internet Income
Entertainment 1
Phone -0.25269 1
Internet -0.08529 0.025376 1
Income -0.44082 0.070278 0.360764 1
Expenses on entertainment had weak negative correlation (r=-0.44082) with monthly income of
international students. Phones had very weak positive correlation of (r=0.070278) with the
monthly income of international students in Australia and finally, internet also posted weak
positive correlation of (r=0.360764) with monthly income of international students.
8
times their standard errors and thus normally distributed.
From the previous research by (Norton and Cherastidtham, 2016), the research reported that
international students spent a total of $4784.90 which translated to $396.17 per month or weekly
pay of $99.77. In this report, the average monthly expenditure on rent was AU$556.85 which
translated to an equivalent of $386.17. The values are nearly equal with the current rent
expenditure relatively lower. Reports further indicated that expenditure on food and groceries
was $3491.16 which was monthly expense of $290.93 (Loomes and Croft, 2013) while in this
report groceries monthly expenditure was $37.31. Internet and other electronics spent was
averagely $64.16 per student per month among expenses of other items
Simple linear regression analysis
Table 3: Correlations
Entertainment Phone Internet Income
Entertainment 1
Phone -0.25269 1
Internet -0.08529 0.025376 1
Income -0.44082 0.070278 0.360764 1
Expenses on entertainment had weak negative correlation (r=-0.44082) with monthly income of
international students. Phones had very weak positive correlation of (r=0.070278) with the
monthly income of international students in Australia and finally, internet also posted weak
positive correlation of (r=0.360764) with monthly income of international students.
8
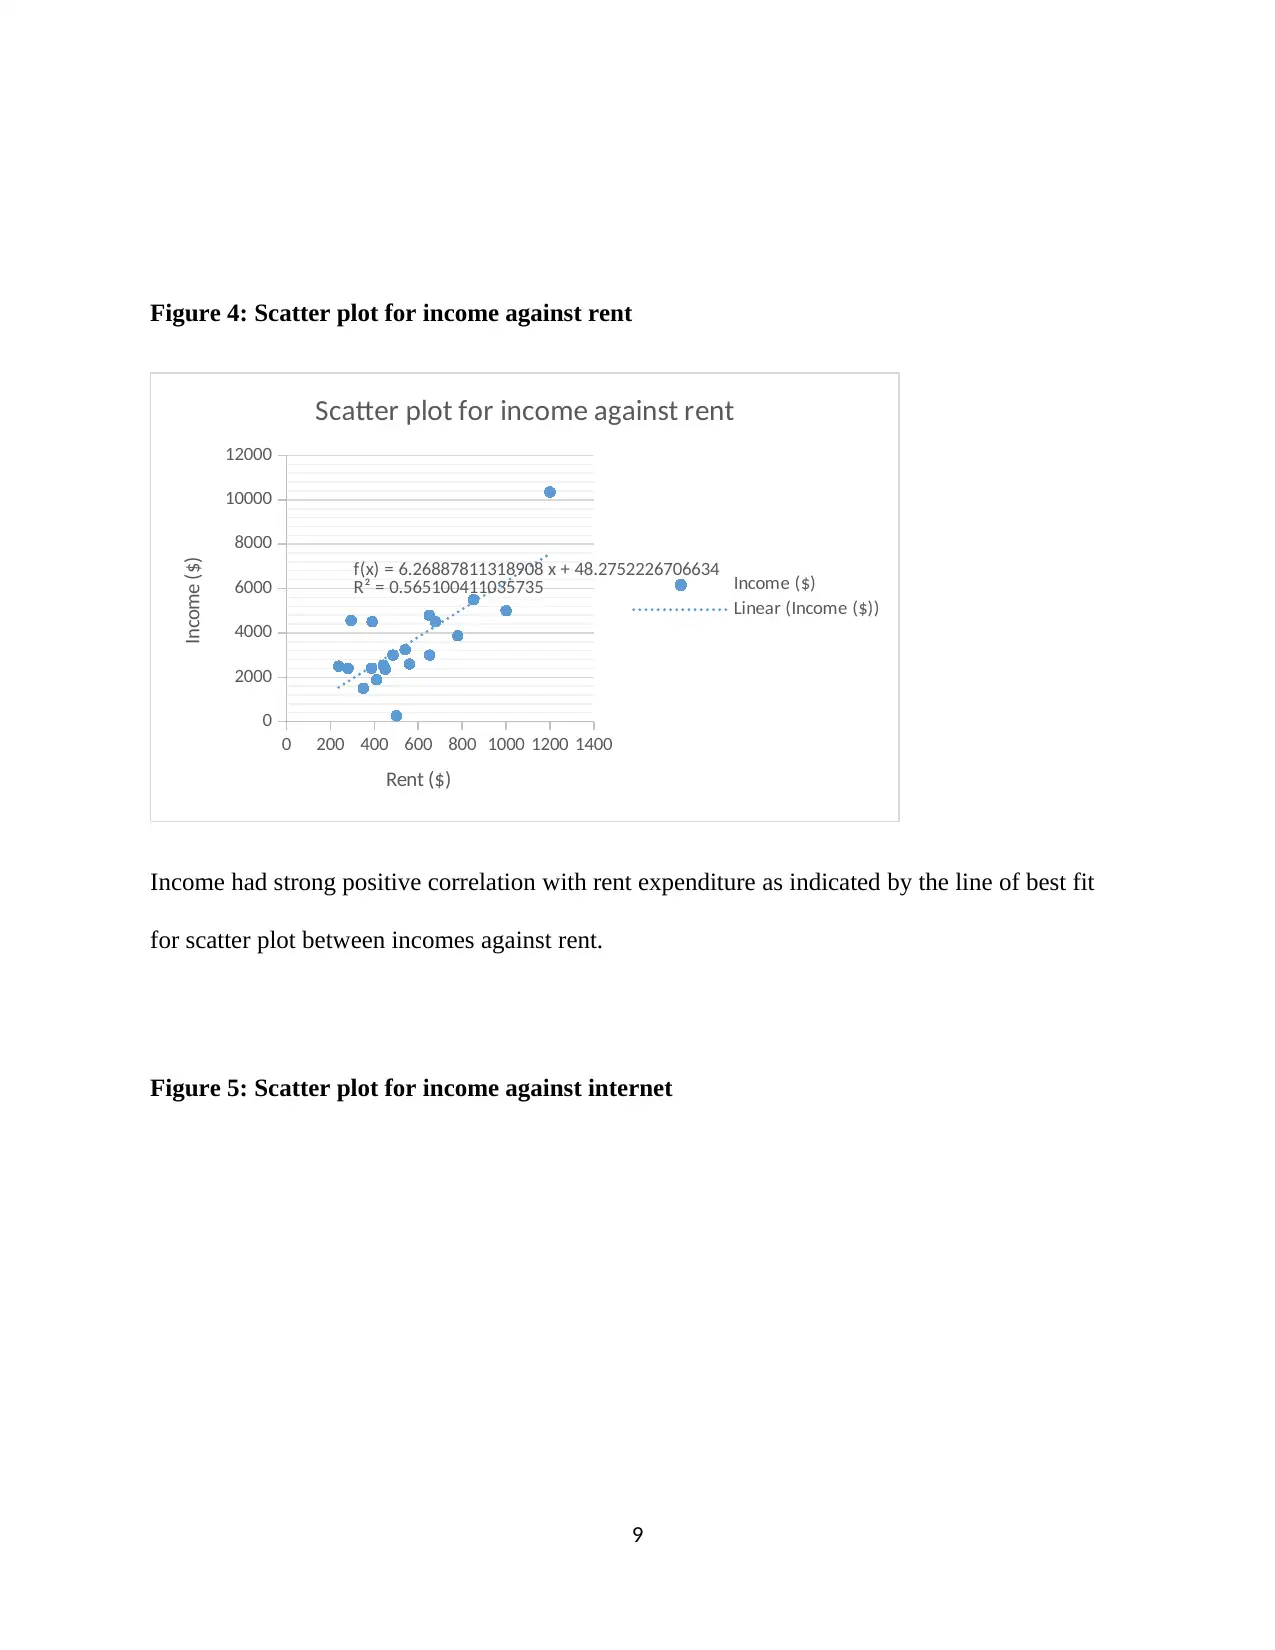
Figure 4: Scatter plot for income against rent
0 200 400 600 800 1000 1200 1400
0
2000
4000
6000
8000
10000
12000
f(x) = 6.26887811318908 x + 48.2752226706634
R² = 0.565100411035735
Scatter plot for income against rent
Income ($)
Linear (Income ($))
Rent ($)
Income ($)
Income had strong positive correlation with rent expenditure as indicated by the line of best fit
for scatter plot between incomes against rent.
Figure 5: Scatter plot for income against internet
9
⊘ This is a preview!⊘
Do you want full access?
Subscribe today to unlock all pages.
Trusted by 1+ million students worldwide
1 out of 16
Related Documents


Your All-in-One AI-Powered Toolkit for Academic Success.
+13062052269
info@desklib.com
Available 24*7 on WhatsApp / Email
![[object Object]](/_next/static/media/star-bottom.7253800d.svg)
Unlock your academic potential
Copyright © 2020–2026 A2Z Services. All Rights Reserved. Developed and managed by ZUCOL.