Determinants of Expenditure Patterns: Int'l Students in Australia
VerifiedAdded on 2023/06/05
|16
|2471
|171
Report
AI Summary
This research report investigates the expenditure patterns of international students in Australian universities during 2018. It aims to understand how international students allocate their spending, their average monthly income, and the factors influencing this income. A survey was conducted with 20 randomly selected international students, and data was analyzed using descriptive statistics and multiple linear regression. Key variables considered include gender, marital status, type of study, and expenditures on rent, food, internet, transport, and entertainment. The findings reveal that monthly rent, food, and transport expenses significantly predict the income of international students. The report concludes by recommending that stakeholders focus on ensuring the affordability of basic needs like rent, transport, and food for international students. Desklib offers similar reports and study tools to aid students in their academic pursuits.
Expenditure Patterns of International Students in Australia
Statistics
Student Name:
Instructor Name:
Course Number:
26 September 2018
Statistics
Student Name:
Instructor Name:
Course Number:
26 September 2018
Paraphrase This Document
Need a fresh take? Get an instant paraphrase of this document with our AI Paraphraser
Executive summary
The main purpose of this research was to analyze determinants of international students’
expenditure using a survey of foreign students studying in Australian universities in 2018. This
study had two aims. The first was to investigate the rough idea on how the international students
spend in terms of their main spending and how much as well as their average monthly income.
The other aim was to determine the impact of a set of relevant explanatory variables on the
average monthly income of the international students. Some of the factors that were initially
thought to predict the income were gender of the student, marital status of the student, student’s
type of study, spending on various expenditures such as rent, internet, transport, food and
entertainment. A sample of 20 randomly selected students was used to answer the concerns of
the researcher. Descriptive statistical analysis was performed on the demographic, monthly
expenditure and average monthly income. Multiple linear regression was performed to determine
what factors predict the international student’s income. The findings provide evidence of the
factors that significantly predict the income of the students. The study provides valuable
information for various stakeholders in the education sector since it reveals the major areas
where the international student’s major spending goes to. Research results could serve as
guidelines for modifying international student management and education policies, strategies and
plans in order to attract more international students.
Table of Contents
Executive summary.........................................................................................................................2
Introduction......................................................................................................................................4
Method of data collection................................................................................................................5
Summary of the data set..................................................................................................................5
Descriptive data analysis.................................................................................................................6
Frequencies......................................................................................................................................7
Gender......................................................................................................................................7
Country of origin......................................................................................................................8
Type of studies.........................................................................................................................8
Marital Status...........................................................................................................................9
Simple linear regression analysis...................................................................................................10
References......................................................................................................................................14
Appendix........................................................................................................................................15
Questionnaire.............................................................................................................................15
⊘ This is a preview!⊘
Do you want full access?
Subscribe today to unlock all pages.
Trusted by 1+ million students worldwide
List of tables
Table 1: Description of the variables...............................................................................................6
Table 2: Dataset...............................................................................................................................6
Table 3: Coding table.......................................................................................................................7
Table 4: Descriptive statistics..........................................................................................................8
Table 5: Regression summary statistics.........................................................................................13
Table 6: ANOVA Table.................................................................................................................13
Table 7: Regression coefficient table............................................................................................13
List of figures
Figure 1: Pie chart for the gender....................................................................................................9
Figure 2: Bar chart for the country of origin.................................................................................10
Figure 3: Pie chart for the type of studies......................................................................................11
Figure 4: Pie chart for the marital status........................................................................................11
Paraphrase This Document
Need a fresh take? Get an instant paraphrase of this document with our AI Paraphraser

Introduction
Australia has a complex and lucrative industry in terms of international students it enrolls every
year. It estimated that international students are the third largest contributor to the country's
economy with close to 16 billion dollars received in 2010/2011 (Cohen, et al., 2002). This has
subsequently resulted to more job creations with an estimated 120,000 jobs available to
Australian as a result of the enrolment of the international students (Boddy & Smith, 2009). The
study sought to answer the following research questions;
What is the average monthly income of the international students?
What factors predict the income of the international students’ income?
What is the average expenditure on various items such as rent, transport, entertainment,
food and internet
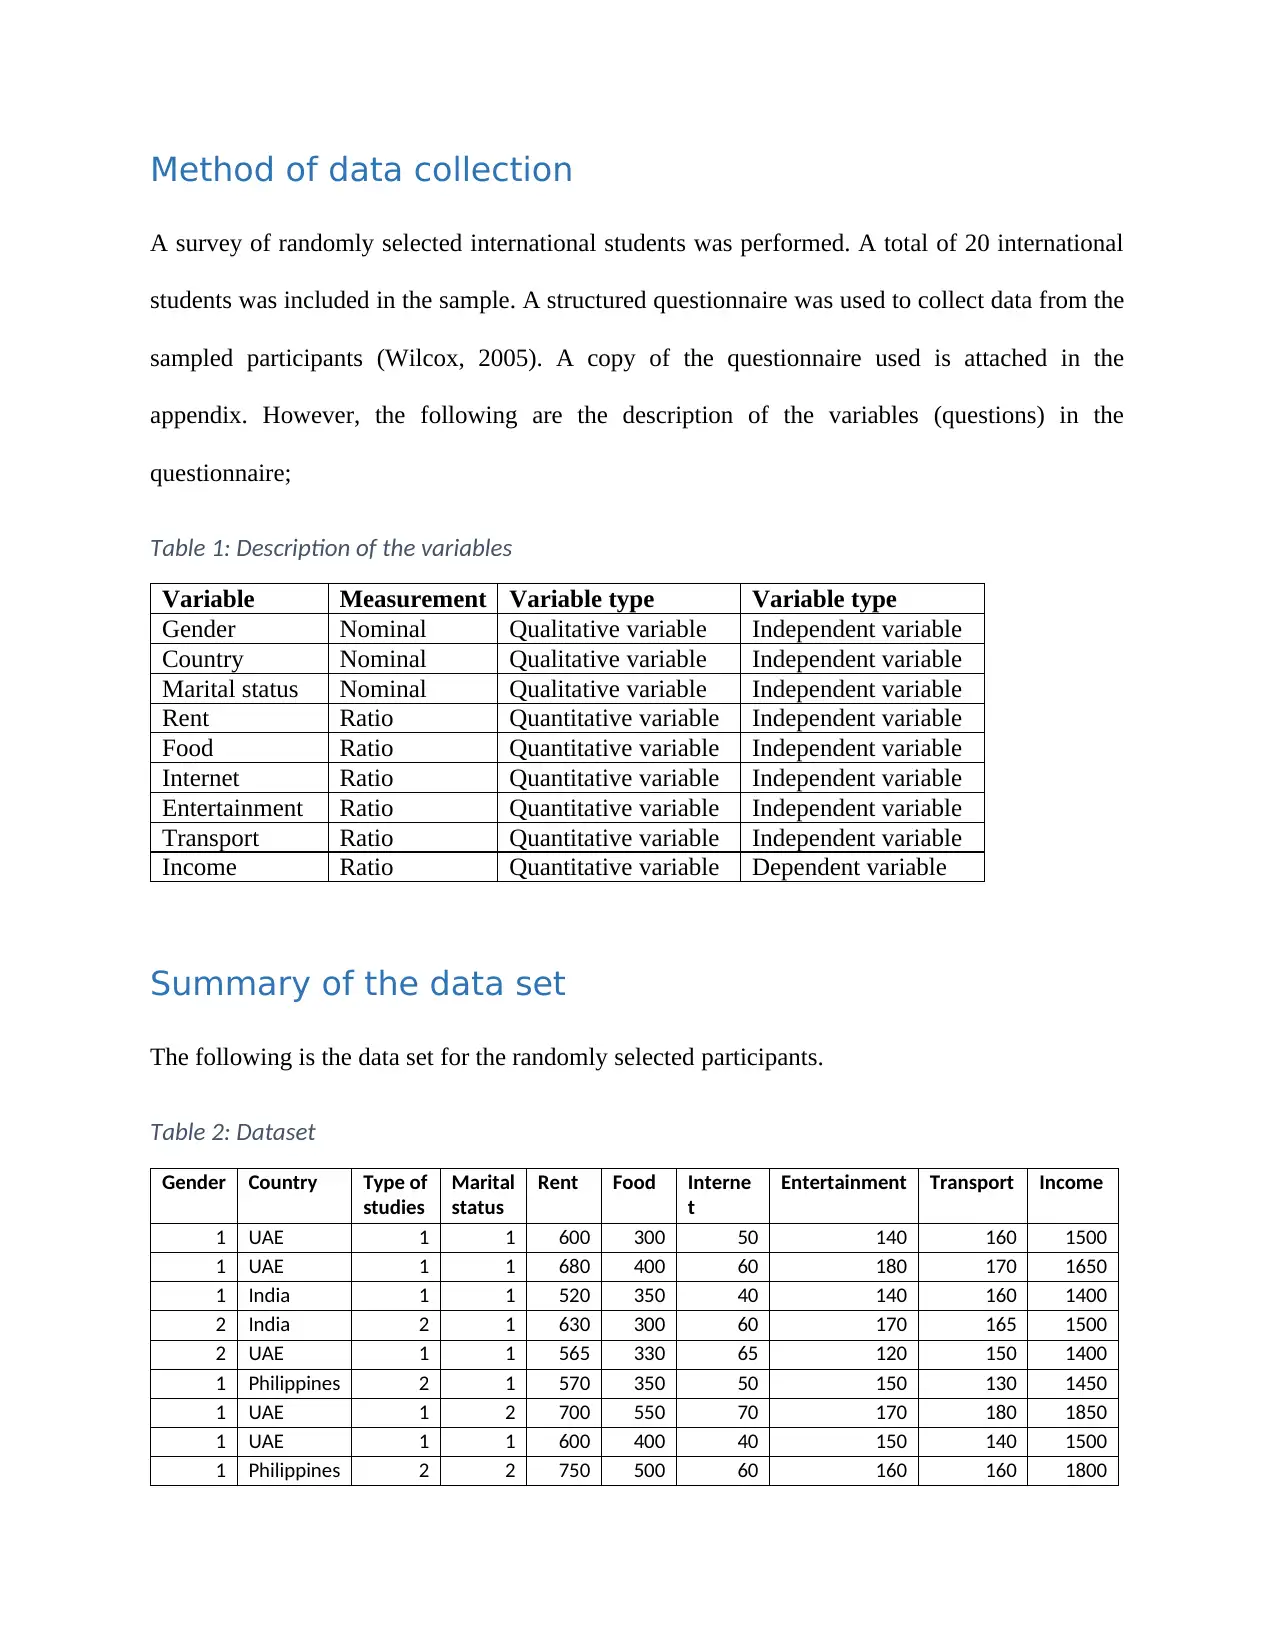
Method of data collection
A survey of randomly selected international students was performed. A total of 20 international
students was included in the sample. A structured questionnaire was used to collect data from the
sampled participants (Wilcox, 2005). A copy of the questionnaire used is attached in the
appendix. However, the following are the description of the variables (questions) in the
questionnaire;
Table 1: Description of the variables
Variable Measurement Variable type Variable type
Gender Nominal Qualitative variable Independent variable
Country Nominal Qualitative variable Independent variable
Marital status Nominal Qualitative variable Independent variable
Rent Ratio Quantitative variable Independent variable
Food Ratio Quantitative variable Independent variable
Internet Ratio Quantitative variable Independent variable
Entertainment Ratio Quantitative variable Independent variable
Transport Ratio Quantitative variable Independent variable
Income Ratio Quantitative variable Dependent variable
Summary of the data set
The following is the data set for the randomly selected participants.
Table 2: Dataset
Gender Country Type of
studies
Marital
status
Rent Food Interne
t
Entertainment Transport Income
1 UAE 1 1 600 300 50 140 160 1500
1 UAE 1 1 680 400 60 180 170 1650
1 India 1 1 520 350 40 140 160 1400
2 India 2 1 630 300 60 170 165 1500
2 UAE 1 1 565 330 65 120 150 1400
1 Philippines 2 1 570 350 50 150 130 1450
1 UAE 1 2 700 550 70 170 180 1850
1 UAE 1 1 600 400 40 150 140 1500
1 Philippines 2 2 750 500 60 160 160 1800
⊘ This is a preview!⊘
Do you want full access?
Subscribe today to unlock all pages.
Trusted by 1+ million students worldwide
2 Philippines 1 1 550 300 40 130 120 1300
1 UAE 1 1 660 350 50 135 140 1500
2 Nigeria 2 2 700 450 70 175 180 1750
2 Nigeria 2 2 650 300 45 170 160 1500
2 UAE 1 1 650 350 40 120 120 1450
2 UAE 2 1 600 300 50 150 150 1400
1 India 1 1 500 300 40 140 145 1300
1 India 2 2 600 400 70 140 140 1500
1 Philippines 1 2 650 450 80 180 170 1700
1 UAE 2 1 500 300 30 140 120 1250
1 UAE 1 1 630 300 60 170 165 1500
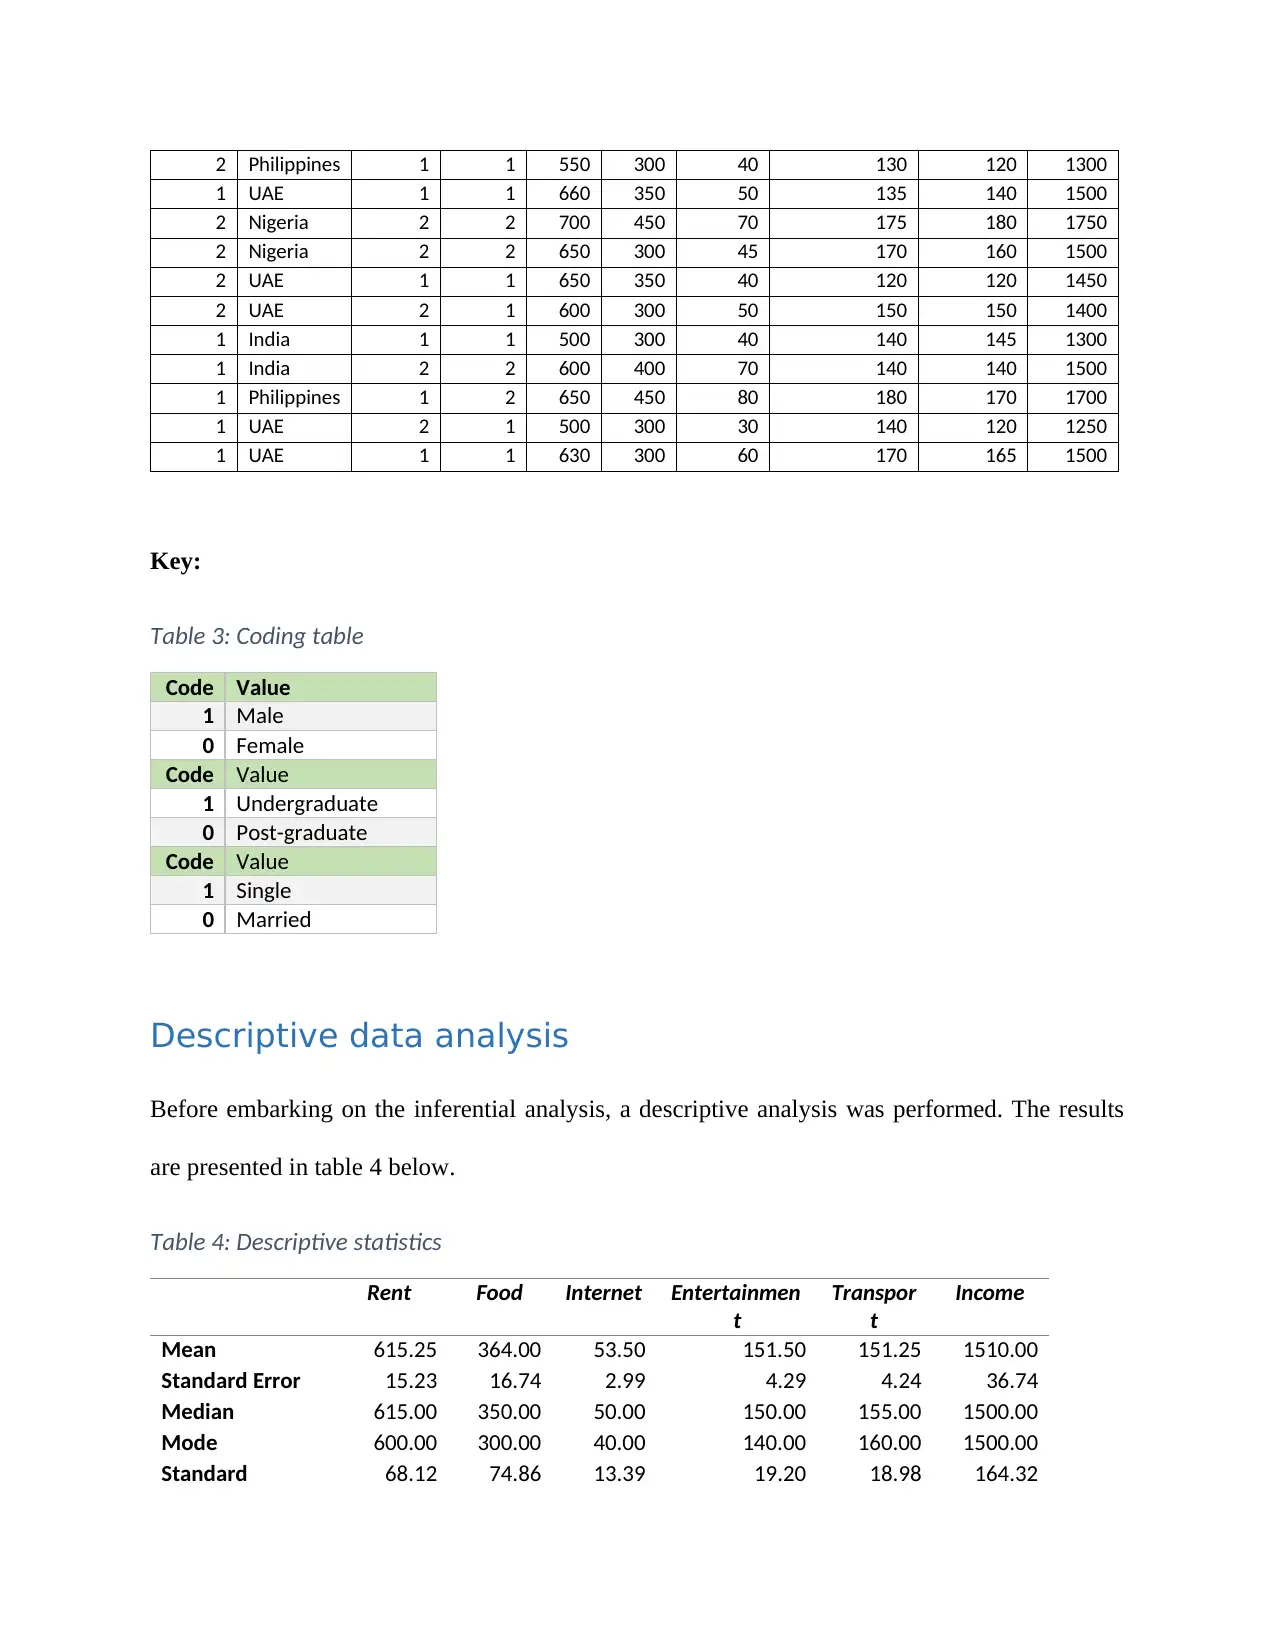
Key:
Table 3: Coding table
Code Value
1 Male
0 Female
Code Value
1 Undergraduate
0 Post-graduate
Code Value
1 Single
0 Married
Descriptive data analysis
Before embarking on the inferential analysis, a descriptive analysis was performed. The results
are presented in table 4 below.
Table 4: Descriptive statistics
Rent Food Internet Entertainmen
t
Transpor
t
Income
Mean 615.25 364.00 53.50 151.50 151.25 1510.00
Standard Error 15.23 16.74 2.99 4.29 4.24 36.74
Median 615.00 350.00 50.00 150.00 155.00 1500.00
Mode 600.00 300.00 40.00 140.00 160.00 1500.00
Standard 68.12 74.86 13.39 19.20 18.98 164.32
1 UAE 1 1 660 350 50 135 140 1500
2 Nigeria 2 2 700 450 70 175 180 1750
2 Nigeria 2 2 650 300 45 170 160 1500
2 UAE 1 1 650 350 40 120 120 1450
2 UAE 2 1 600 300 50 150 150 1400
1 India 1 1 500 300 40 140 145 1300
1 India 2 2 600 400 70 140 140 1500
1 Philippines 1 2 650 450 80 180 170 1700
1 UAE 2 1 500 300 30 140 120 1250
1 UAE 1 1 630 300 60 170 165 1500
Key:
Table 3: Coding table
Code Value
1 Male
0 Female
Code Value
1 Undergraduate
0 Post-graduate
Code Value
1 Single
0 Married
Descriptive data analysis
Before embarking on the inferential analysis, a descriptive analysis was performed. The results
are presented in table 4 below.
Table 4: Descriptive statistics
Rent Food Internet Entertainmen
t
Transpor
t
Income
Mean 615.25 364.00 53.50 151.50 151.25 1510.00
Standard Error 15.23 16.74 2.99 4.29 4.24 36.74
Median 615.00 350.00 50.00 150.00 155.00 1500.00
Mode 600.00 300.00 40.00 140.00 160.00 1500.00
Standard 68.12 74.86 13.39 19.20 18.98 164.32
Paraphrase This Document
Need a fresh take? Get an instant paraphrase of this document with our AI Paraphraser
Deviation
Sample Variance 4640.72 5604.21 179.21 368.68 360.20 27000.00
Kurtosis -0.44 0.58 -0.80 -1.18 -0.85 -0.13
Skewness -0.05 1.15 0.21 0.01 -0.32 0.61
Range 250.00 250.00 50.00 60.00 60.00 600.00
Minimum 500.00 300.00 30.00 120.00 120.00 1250.00
Maximum 750.00 550.00 80.00 180.00 180.00 1850.00
Sum 12305.00 7280.00 1070.00 3030.00 3025.00 30200.00
Count 20 20 20 20 20 20
From the table, it can be seen that the average monthly income for the sampled international
students was $1,510.00 with median income being $1,500.00
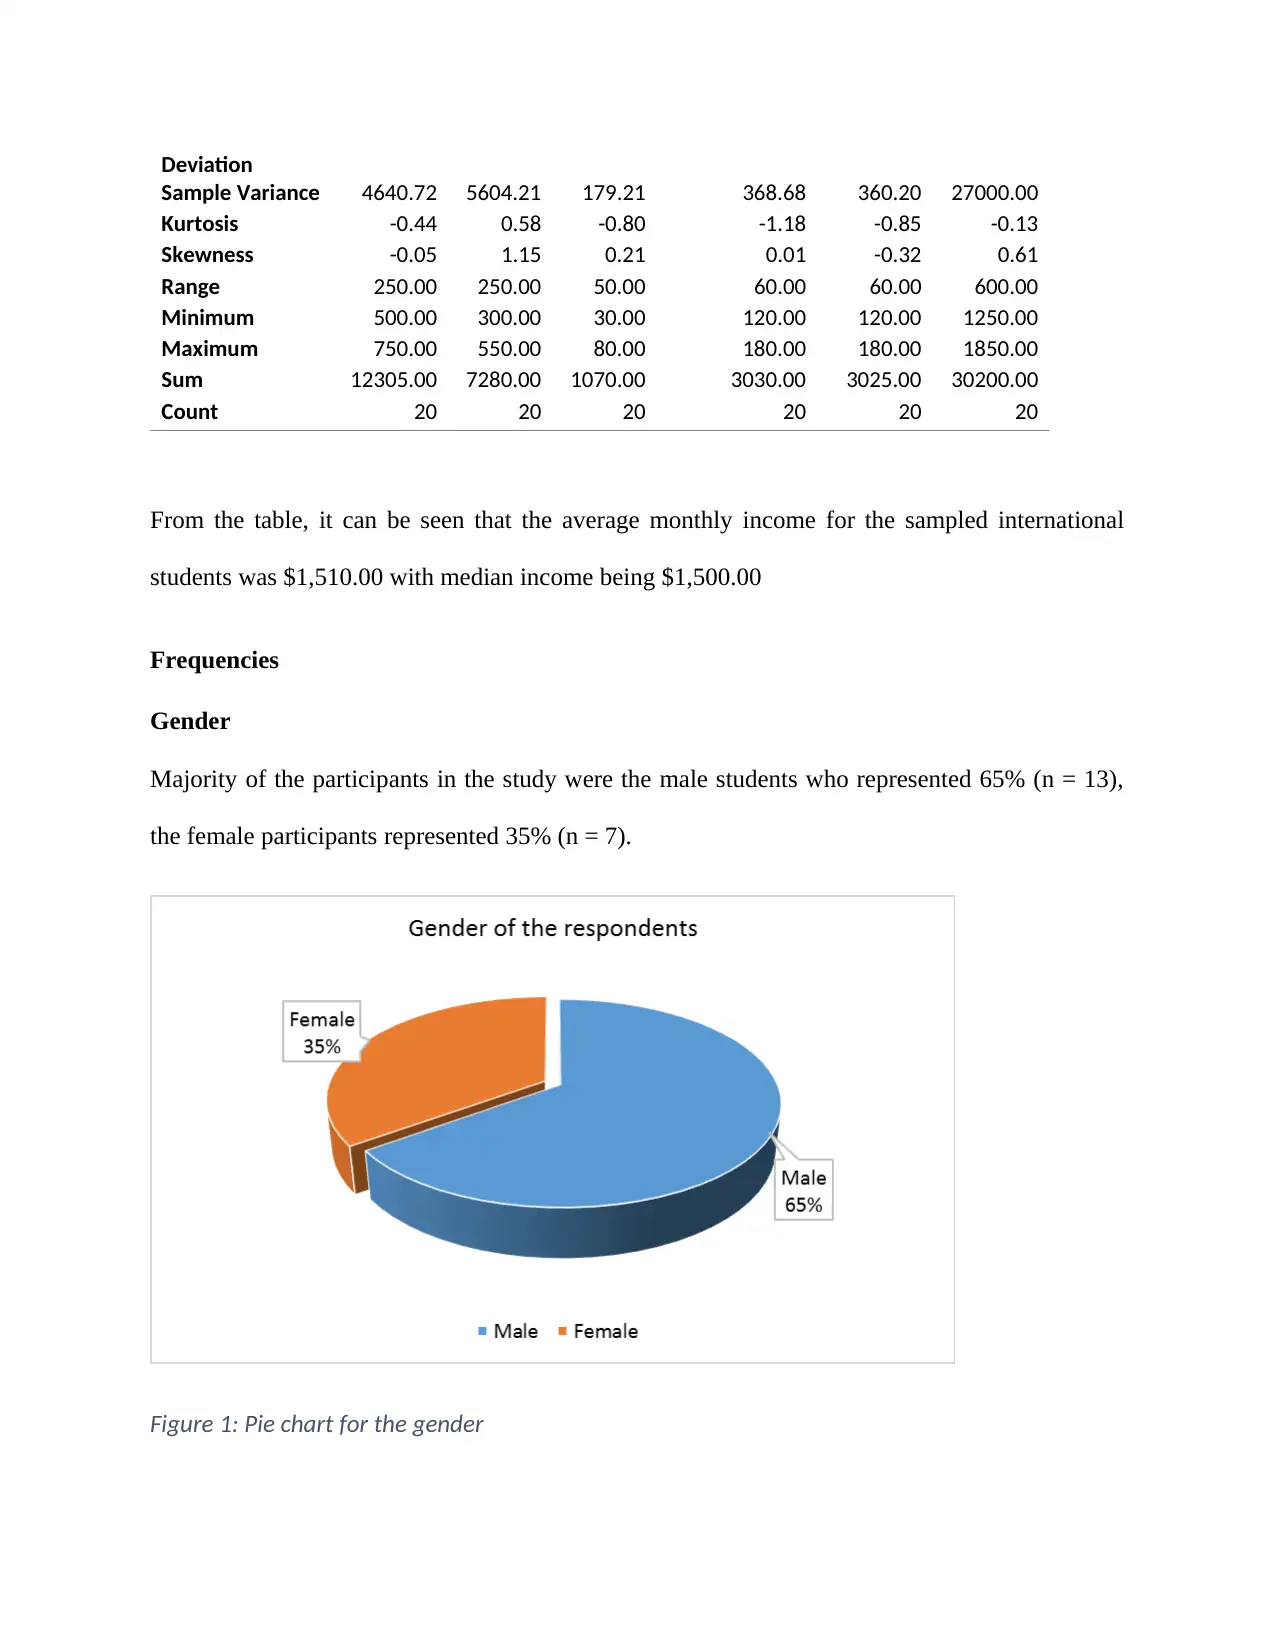
Frequencies
Gender
Majority of the participants in the study were the male students who represented 65% (n = 13),
the female participants represented 35% (n = 7).
Figure 1: Pie chart for the gender
Sample Variance 4640.72 5604.21 179.21 368.68 360.20 27000.00
Kurtosis -0.44 0.58 -0.80 -1.18 -0.85 -0.13
Skewness -0.05 1.15 0.21 0.01 -0.32 0.61
Range 250.00 250.00 50.00 60.00 60.00 600.00
Minimum 500.00 300.00 30.00 120.00 120.00 1250.00
Maximum 750.00 550.00 80.00 180.00 180.00 1850.00
Sum 12305.00 7280.00 1070.00 3030.00 3025.00 30200.00
Count 20 20 20 20 20 20
From the table, it can be seen that the average monthly income for the sampled international
students was $1,510.00 with median income being $1,500.00
Frequencies
Gender
Majority of the participants in the study were the male students who represented 65% (n = 13),
the female participants represented 35% (n = 7).
Figure 1: Pie chart for the gender
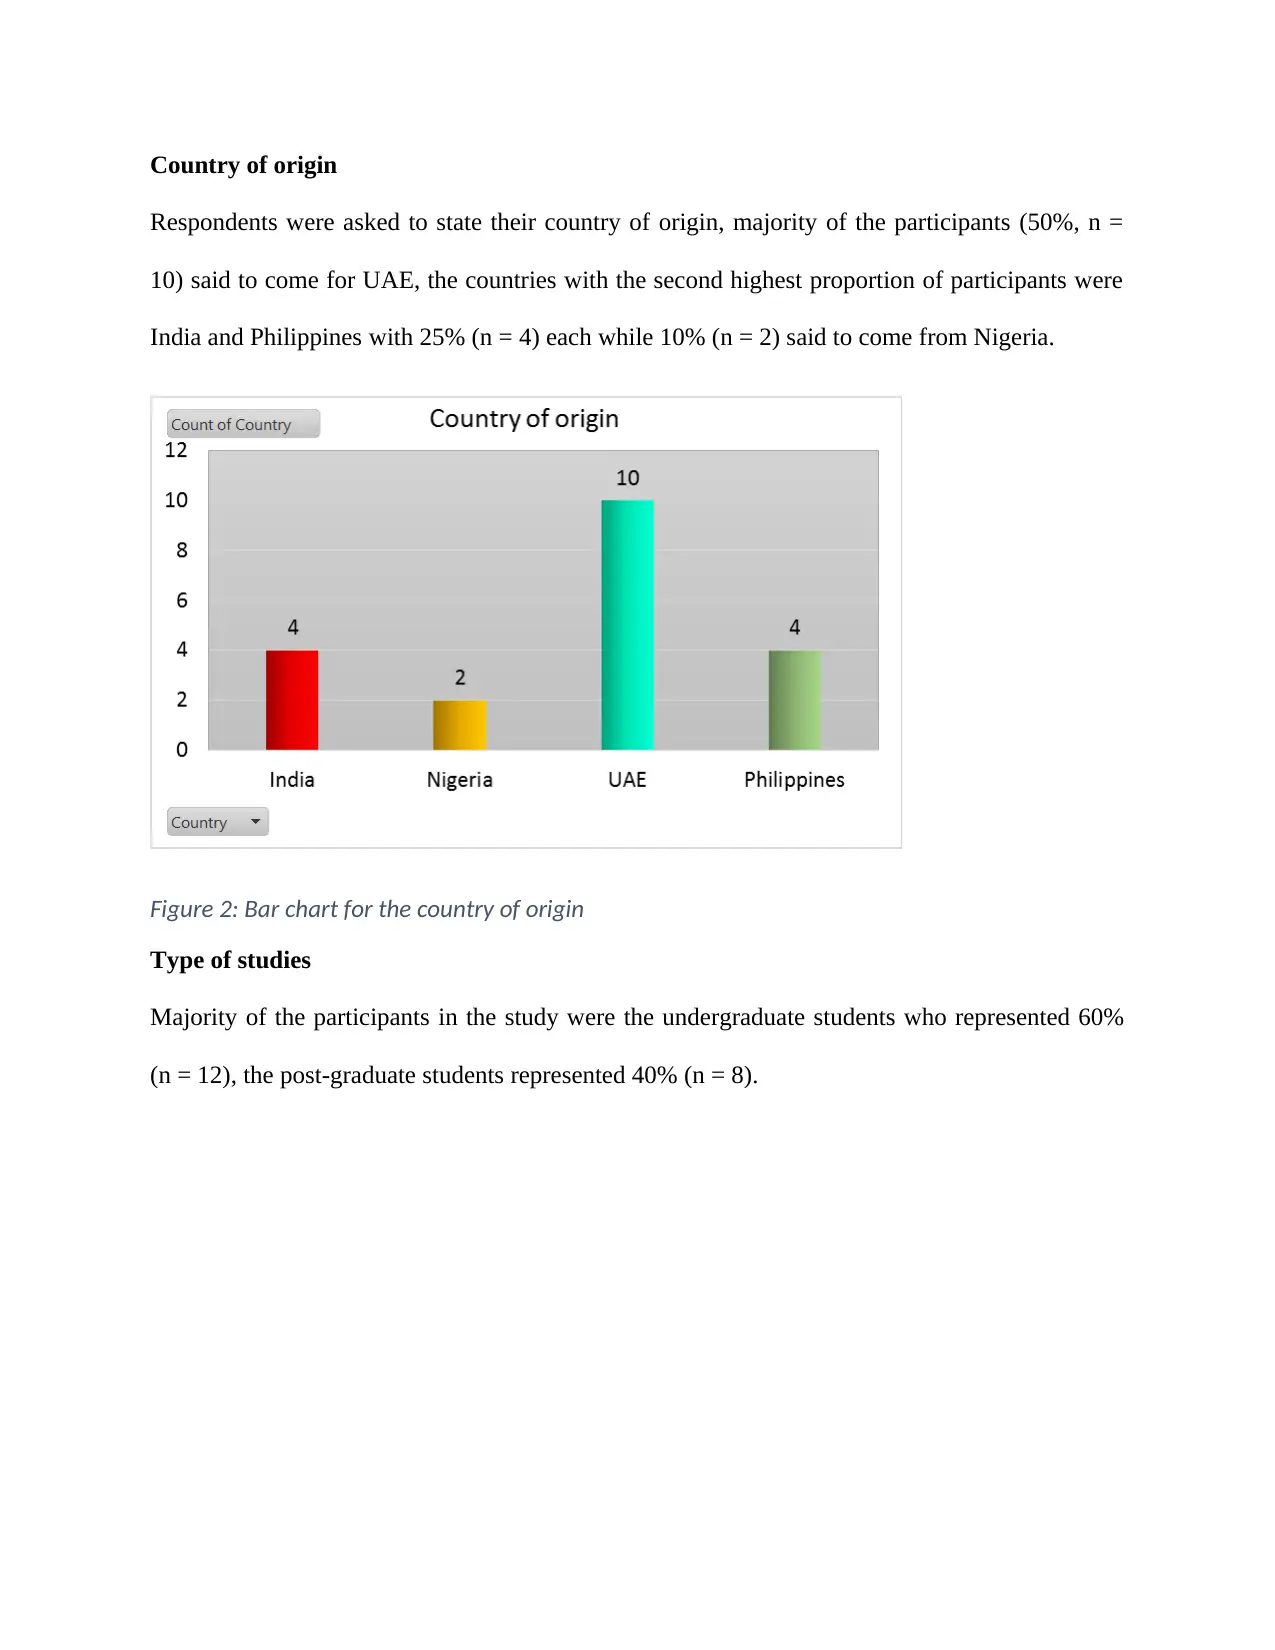
Country of origin
Respondents were asked to state their country of origin, majority of the participants (50%, n =
10) said to come for UAE, the countries with the second highest proportion of participants were
India and Philippines with 25% (n = 4) each while 10% (n = 2) said to come from Nigeria.
Figure 2: Bar chart for the country of origin
Type of studies
Majority of the participants in the study were the undergraduate students who represented 60%
(n = 12), the post-graduate students represented 40% (n = 8).
⊘ This is a preview!⊘
Do you want full access?
Subscribe today to unlock all pages.
Trusted by 1+ million students worldwide
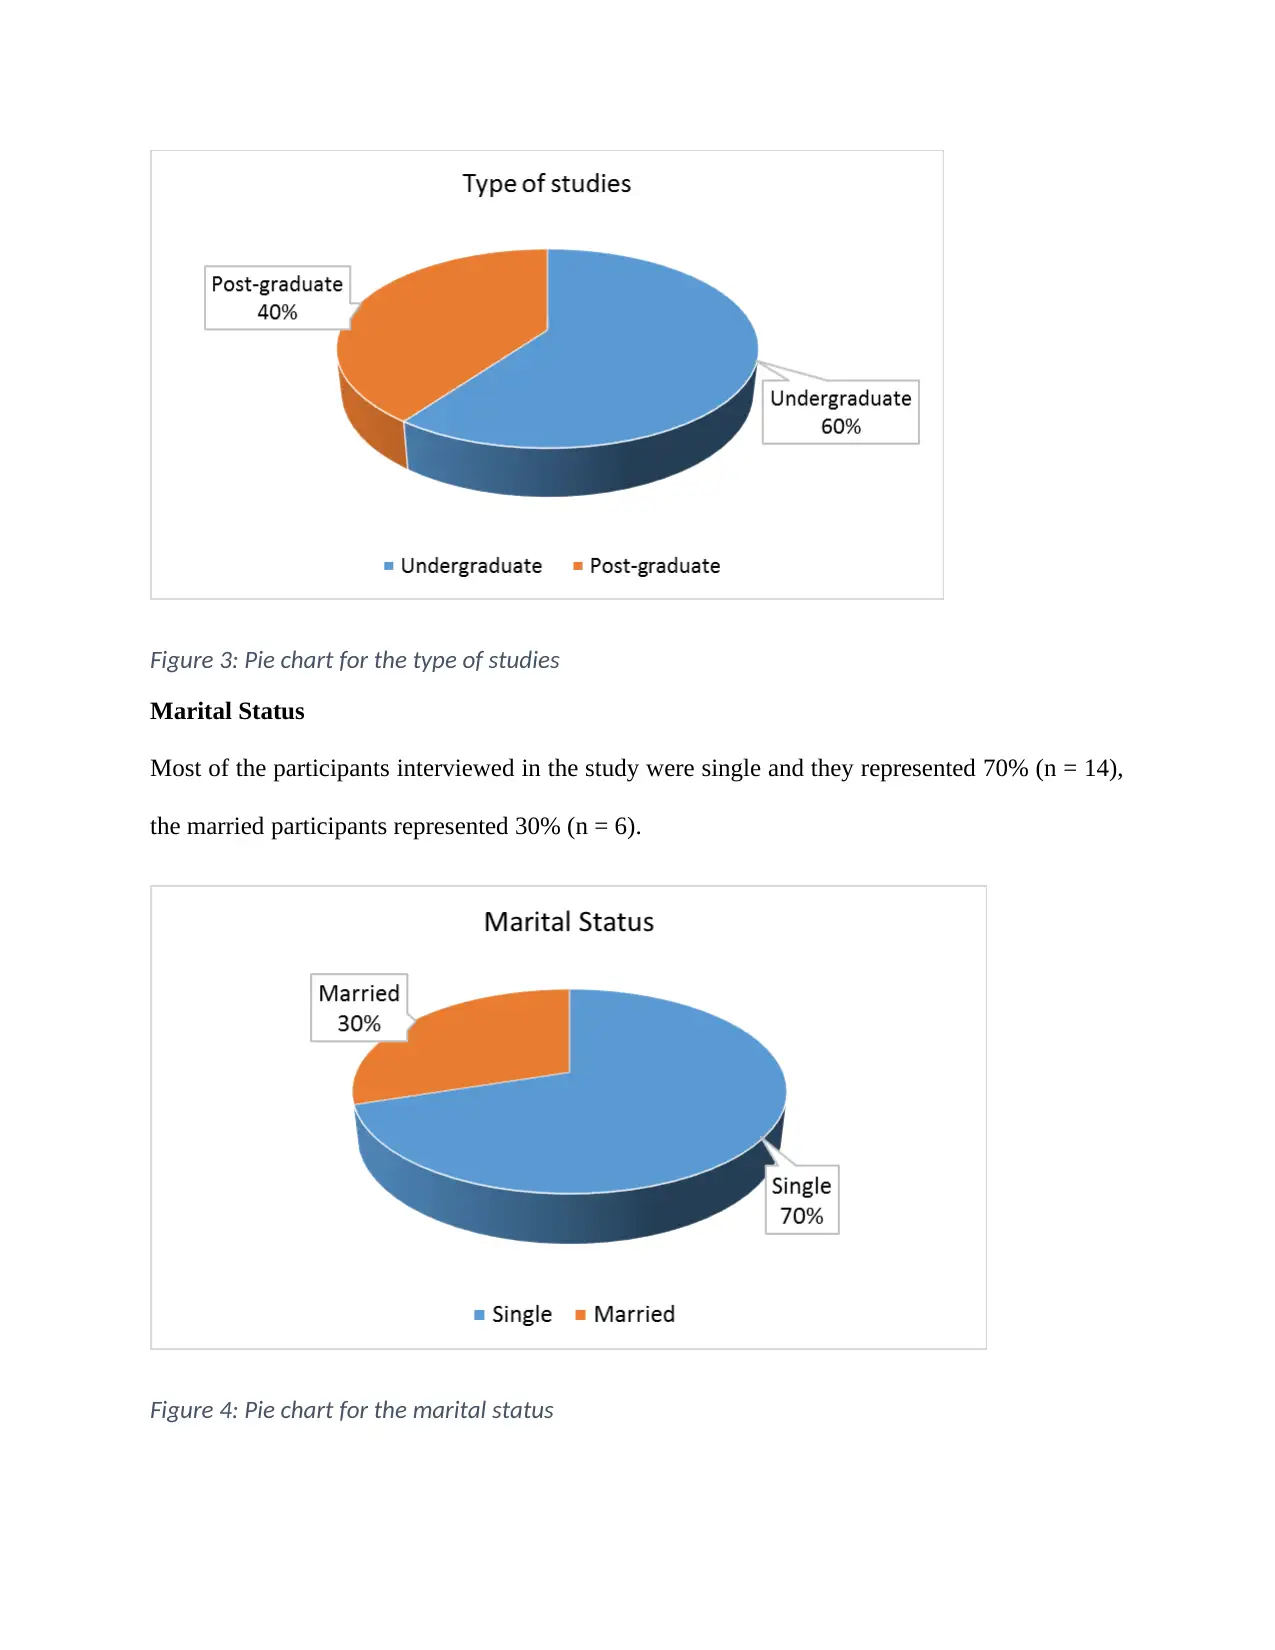
Figure 3: Pie chart for the type of studies
Marital Status
Most of the participants interviewed in the study were single and they represented 70% (n = 14),
the married participants represented 30% (n = 6).
Figure 4: Pie chart for the marital status
Marital Status
Most of the participants interviewed in the study were single and they represented 70% (n = 14),
the married participants represented 30% (n = 6).
Figure 4: Pie chart for the marital status
Paraphrase This Document
Need a fresh take? Get an instant paraphrase of this document with our AI Paraphraser

Simple linear regression analysis
The study sought to identify the factors that predict the monthly income of the international
students. To achieve this, a multiple regression was modelled. The model that the study sought to
fix is given below;
y=β0 + β1 x1 + β2 x2 + β3 x3 +β4 x4 + β5 x5 + β6 x6 + β7 x7 + β8 x8 + ε
Where y=monthly averageincome
x1=dummy variable for gender (1=male , 0=female)
x2=dummy variable for type of studies(1=undergraduate , 0=postgraduate )
x3=dummy variable for marital status (1=single , 0=married )
x4 =monthly rent expense
x5=monthly food expense
x6=monthly internet expense
x7=monthly entertainment expense
x8=monthly transport expense
β0=constant coefficient
β1 , β2 ,… , β8 are thebeta coefficient for theindependent variables x1 , x2 , … . , x8 respectively
The results of the analysis are presented in the tables below;
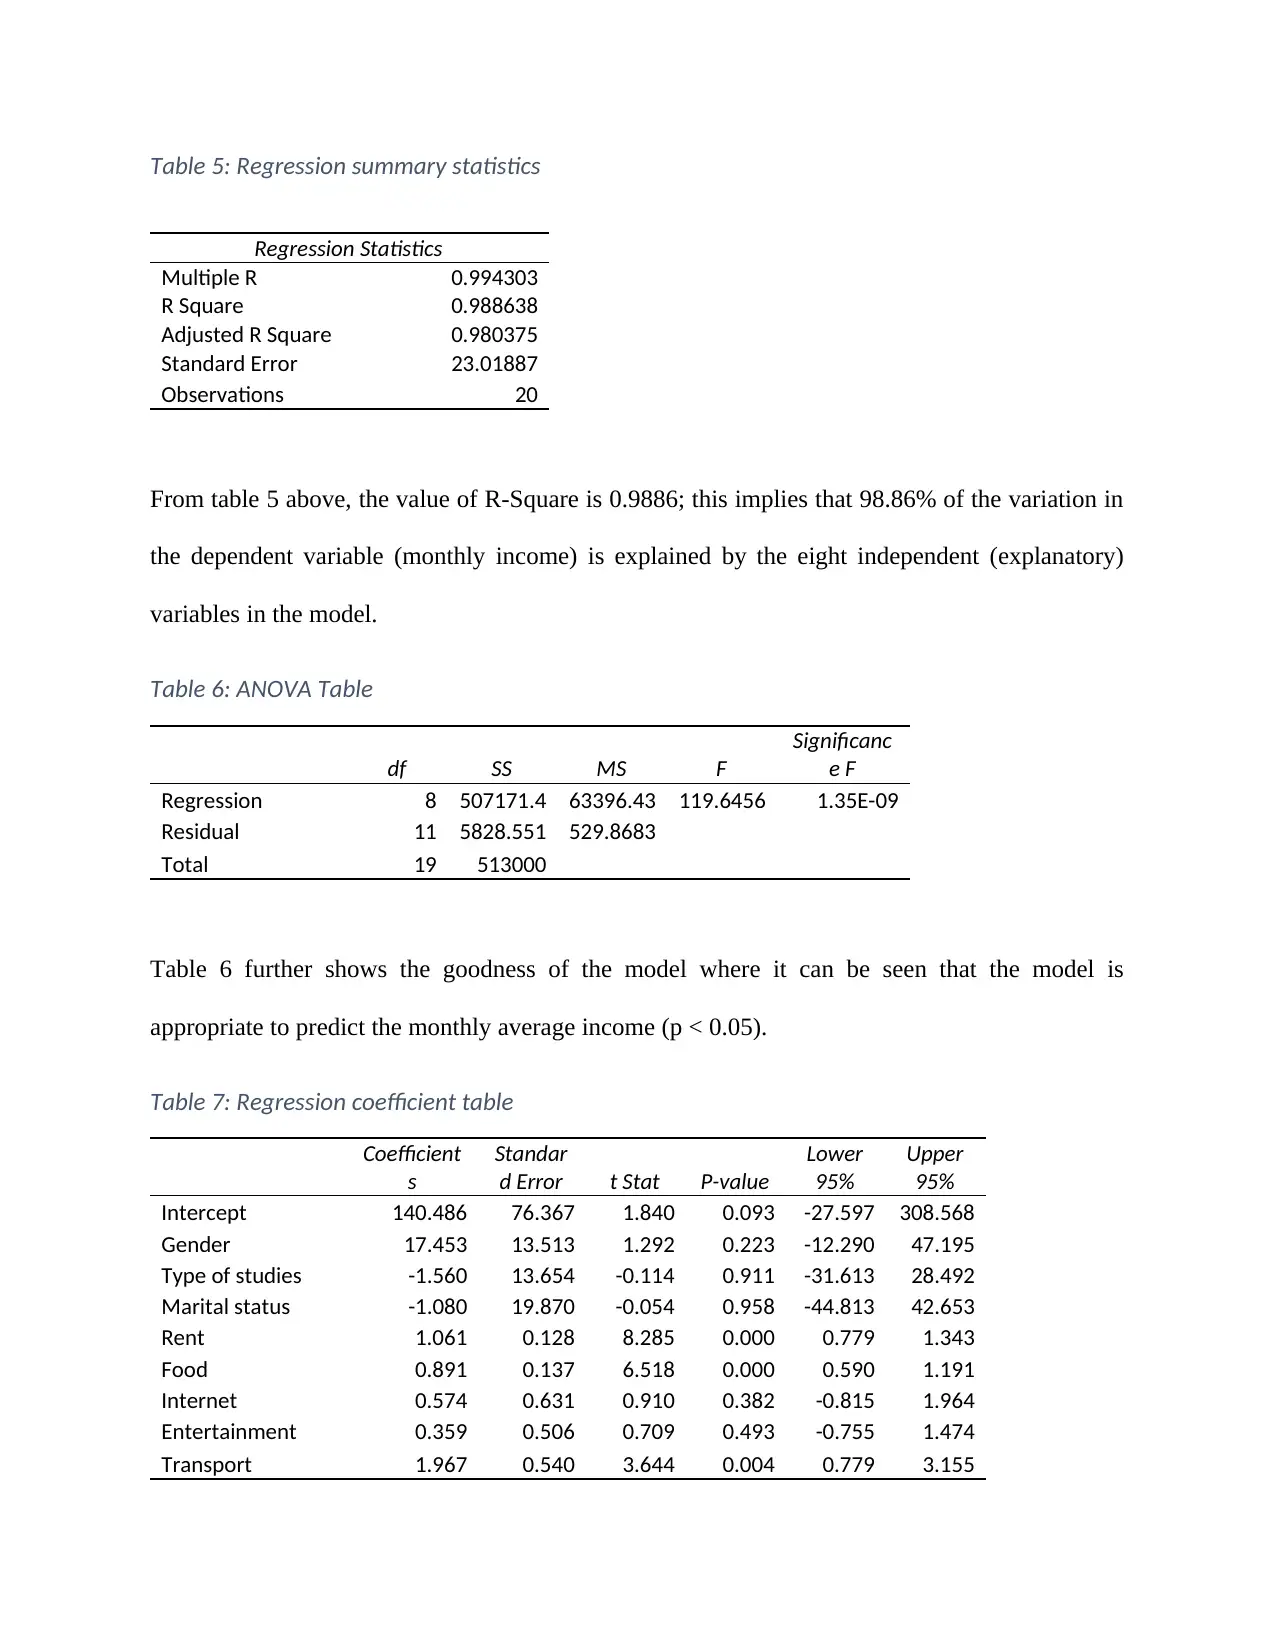
Table 5: Regression summary statistics
Regression Statistics
Multiple R 0.994303
R Square 0.988638
Adjusted R Square 0.980375
Standard Error 23.01887
Observations 20
From table 5 above, the value of R-Square is 0.9886; this implies that 98.86% of the variation in
the dependent variable (monthly income) is explained by the eight independent (explanatory)
variables in the model.
Table 6: ANOVA Table
df SS MS F
Significanc
e F
Regression 8 507171.4 63396.43 119.6456 1.35E-09
Residual 11 5828.551 529.8683
Total 19 513000
Table 6 further shows the goodness of the model where it can be seen that the model is
appropriate to predict the monthly average income (p < 0.05).
Table 7: Regression coefficient table
Coefficient
s
Standar
d Error t Stat P-value
Lower
95%
Upper
95%
Intercept 140.486 76.367 1.840 0.093 -27.597 308.568
Gender 17.453 13.513 1.292 0.223 -12.290 47.195
Type of studies -1.560 13.654 -0.114 0.911 -31.613 28.492
Marital status -1.080 19.870 -0.054 0.958 -44.813 42.653
Rent 1.061 0.128 8.285 0.000 0.779 1.343
Food 0.891 0.137 6.518 0.000 0.590 1.191
Internet 0.574 0.631 0.910 0.382 -0.815 1.964
Entertainment 0.359 0.506 0.709 0.493 -0.755 1.474
Transport 1.967 0.540 3.644 0.004 0.779 3.155
⊘ This is a preview!⊘
Do you want full access?
Subscribe today to unlock all pages.
Trusted by 1+ million students worldwide
1 out of 16
Related Documents


Your All-in-One AI-Powered Toolkit for Academic Success.
+13062052269
info@desklib.com
Available 24*7 on WhatsApp / Email
![[object Object]](/_next/static/media/star-bottom.7253800d.svg)
Unlock your academic potential
Copyright © 2020–2026 A2Z Services. All Rights Reserved. Developed and managed by ZUCOL.