ECON 1086/1089: International Trade Report on Australia & Singapore

Verified

Added on  2022/10/10

|7
|1355
|12
Report
AI Summary
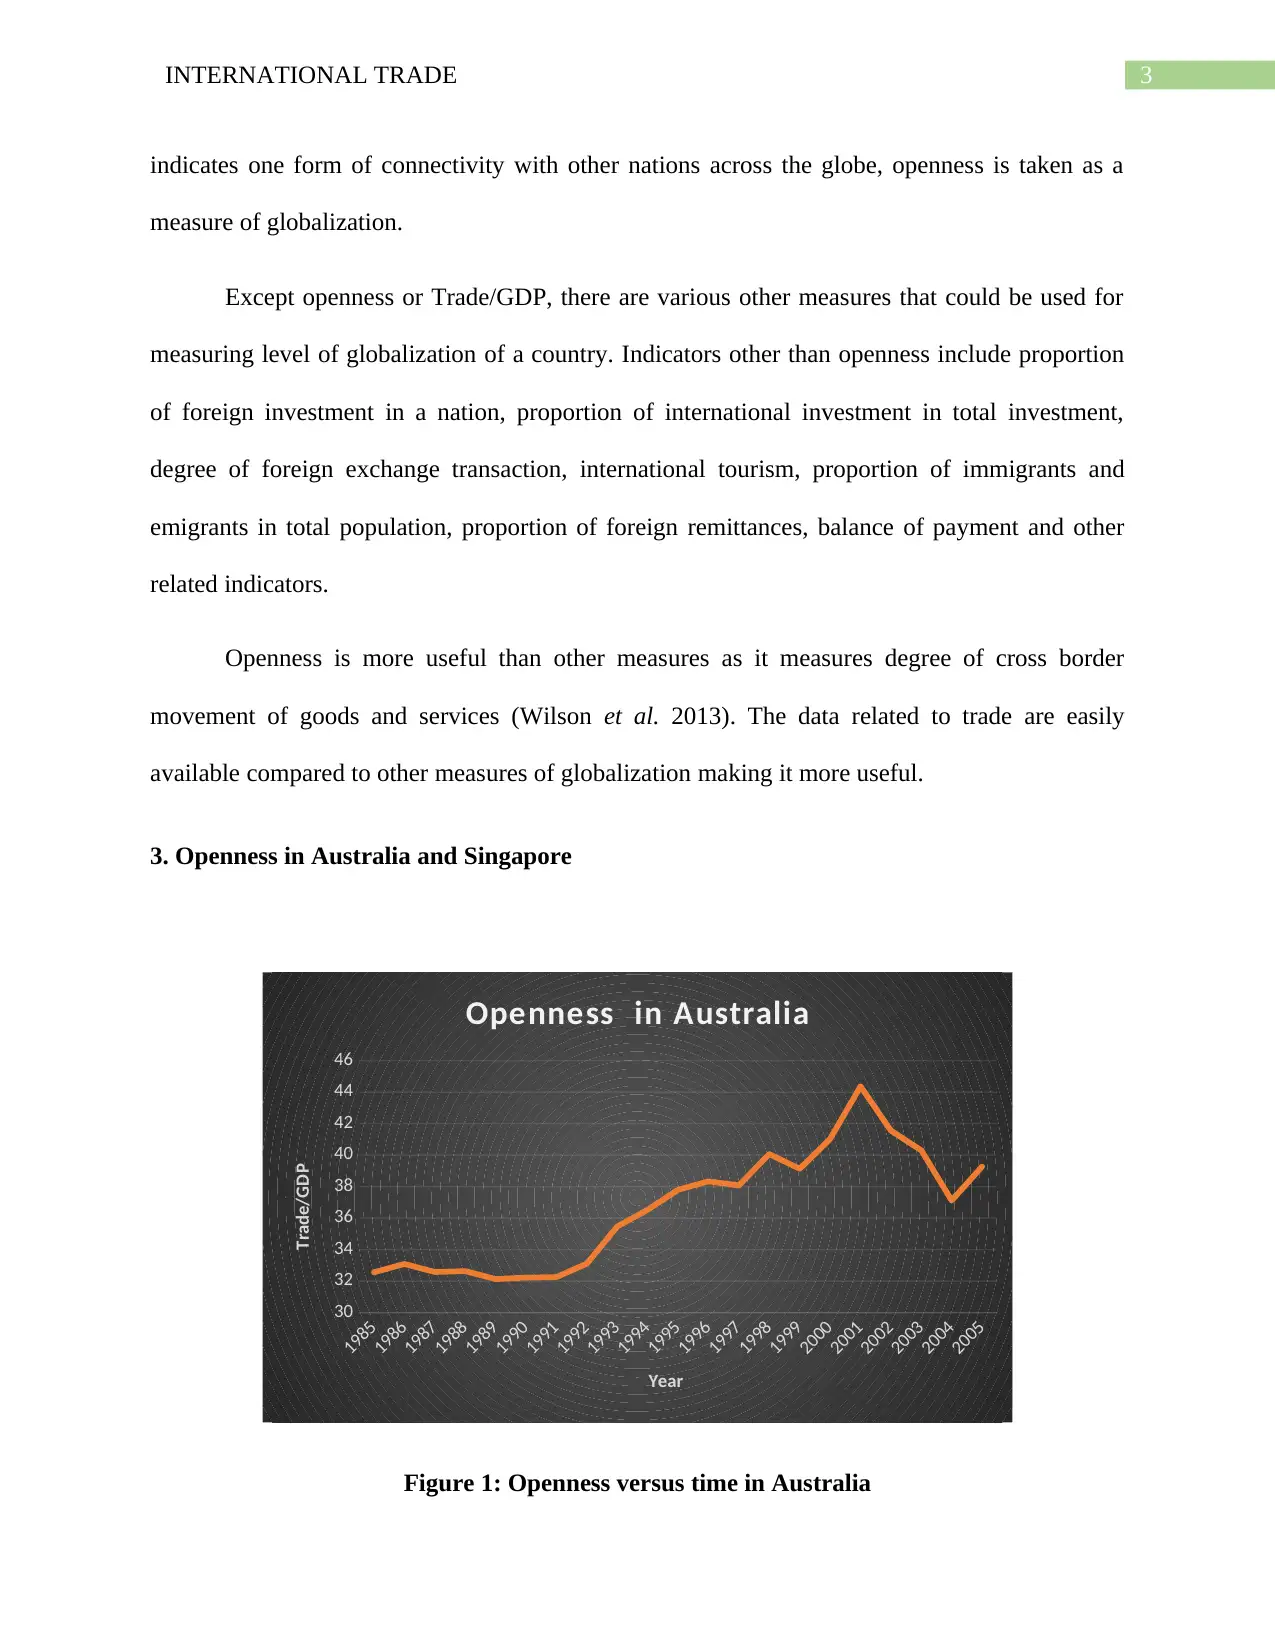
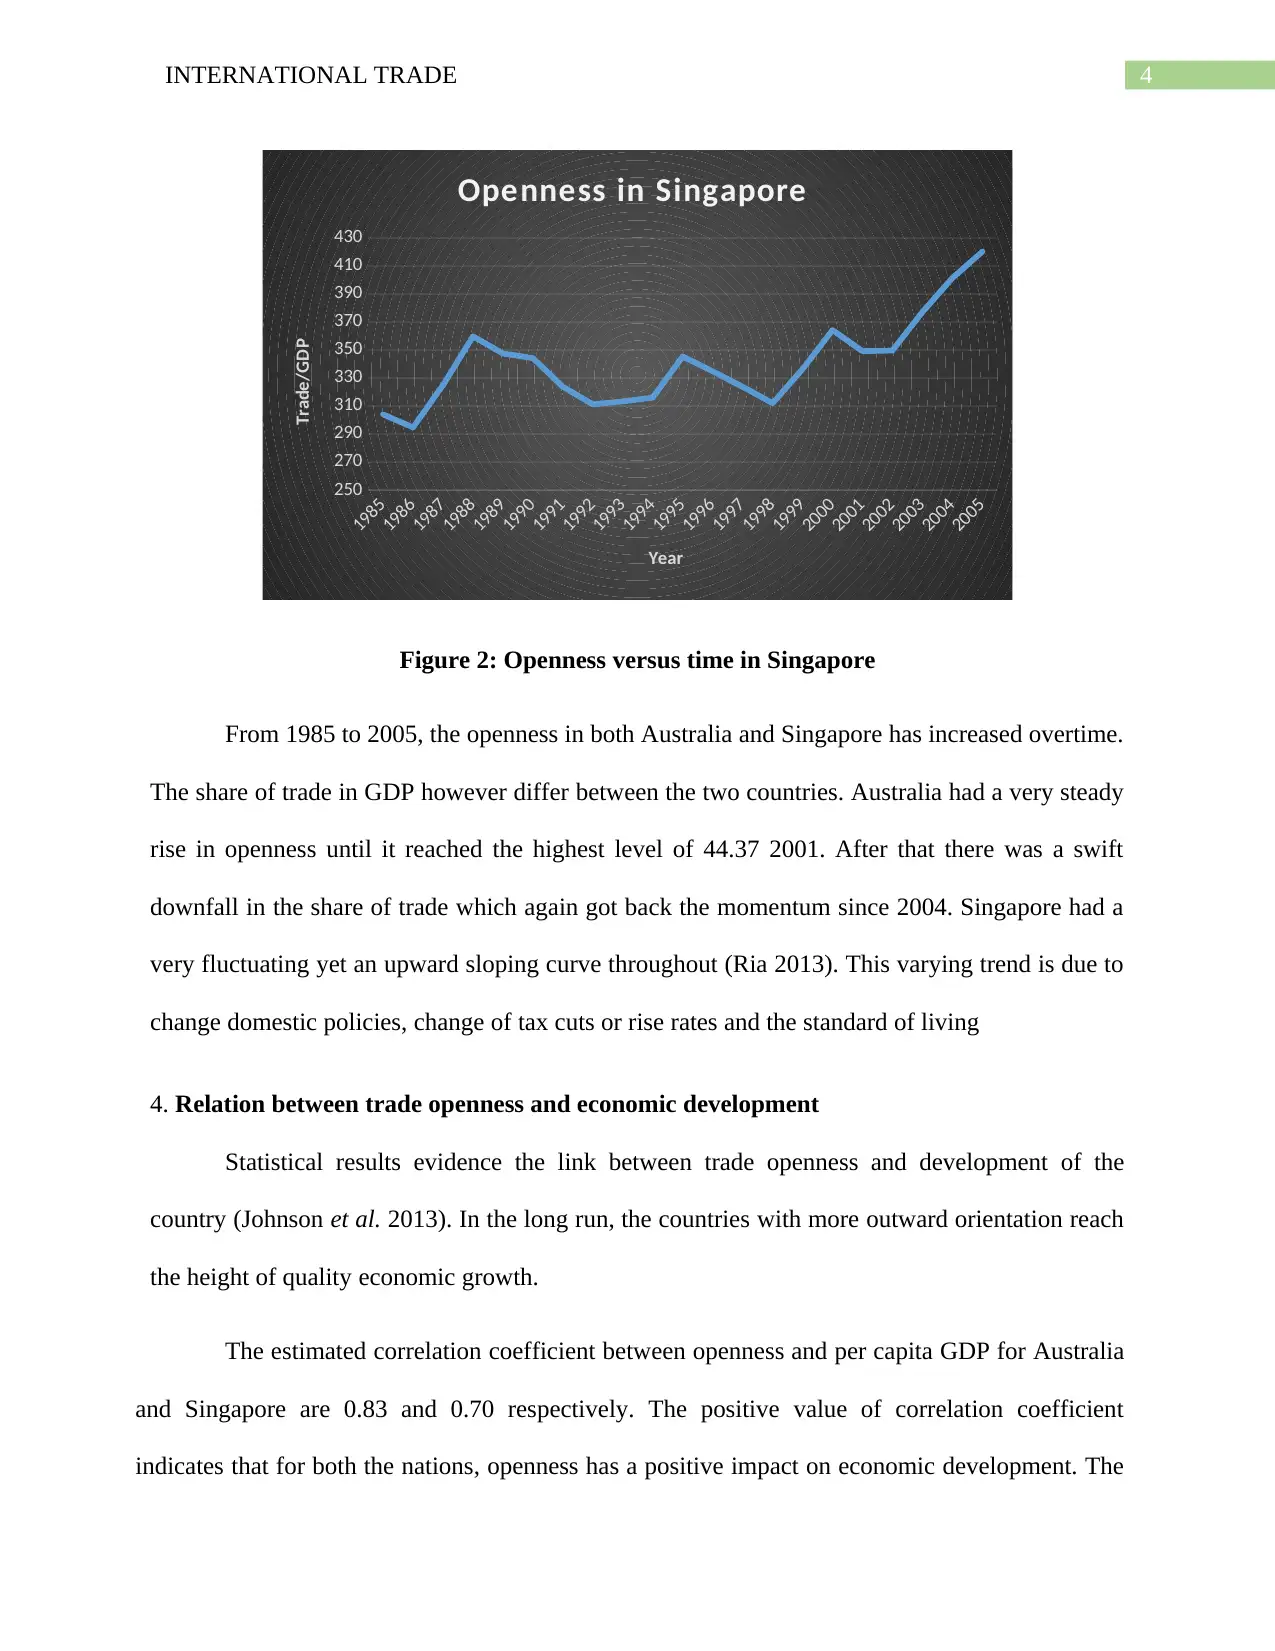
This report provides an analysis of international trade, focusing on Australia and Singapore. It begins with an overview of the economic backgrounds of both countries, highlighting their GDP, population, and key exports. The report then explores trade/GDP as a measure of globalization, discussing its significance in assessing a country's economic integration. Openness in Australia and Singapore is examined using data from 1985 to 2005, illustrating the trends and differences in their trade shares. The report also investigates the relationship between trade openness and economic development, presenting correlation coefficients and their implications. Finally, it discusses the policies driving economic openness in both countries, including trade liberalization, tariff reductions, and foreign investment regulations. The report references key academic papers and data sources to support its findings.
Document Page
Running head: INTERNATIONAL TRADE
International Trade
Name of the Student
Name of the University
Student ID
tabler-icon-diamond-filled.svg

Paraphrase This Document

Need a fresh take? Get an instant paraphrase of this document with our AI Paraphraser
Document Page
1INTERNATIONAL TRADE
Table of Contents
1. Economic Background of Australia and Singapore.....................................................................2
2.Trade/GDP as a measure of globalization....................................................................................2
3. Openness in Australia and Singapore..........................................................................................3
4. Relation between trade openness and economic development....................................................4
5. Policies driving economic openness............................................................................................5
Reference List..................................................................................................................................6
Document Page
2INTERNATIONAL TRADE
1. Economic Background of Australia and Singapore
Australia has big mixed economy market structure having a GDP level of 1.69 trillion
Austrian dollars and 25 million populations. The country is reputed to have the largest wealth per
capita and is located between South Pacific and India Ocean in Oceania. It is engaged in the
export of goods like coal briquettes, petroleum, wheat, gas and gold retrieving about 195 billion
dollars from the given sector. Australia is considered as one of the fourteenth richest nations in
the world.
Singapore is a highly developed economy that drives most of its income from the
production of manufacturing goods. Located in the Asian continent with an area of 687
kilometers and density of 58.7 lakhs. The GDP is estimated to be 372.807 billion dollars. The
economy is reputed to have the third least corruption with low tax rates and high per capita GDP
favouring good business prospective. The major exported goods of Singapore include electric
machinery, equipment, machinery include computers, mineral fuels including oil, optical,
technical, medical apparatus, gem, precious metals and other. Singapore also is a very rich nation
accounting a very high per capita GDP.
2.Trade/GDP as a measure of globalization
Trade/GDP also known as an indicator of openness measures economic globalization and
is considered as an indicator of economic integration. The measure gives an estimation regarding
proportion of all goods and services that cross the boundary of a nation indicating dependency of
the country on external trade. In terms of globalization, it shows the proportion of world
production using for exports and imports between nations. As the extent of international trade
Document Page
3INTERNATIONAL TRADE
indicates one form of connectivity with other nations across the globe, openness is taken as a
measure of globalization.
Except openness or Trade/GDP, there are various other measures that could be used for
measuring level of globalization of a country. Indicators other than openness include proportion
of foreign investment in a nation, proportion of international investment in total investment,
degree of foreign exchange transaction, international tourism, proportion of immigrants and
emigrants in total population, proportion of foreign remittances, balance of payment and other
related indicators.
Openness is more useful than other measures as it measures degree of cross border
movement of goods and services (Wilson et al. 2013). The data related to trade are easily
available compared to other measures of globalization making it more useful.
3. Openness in Australia and Singapore
1985
1986
1987
1988
1989
1990
1991
1992
1993
1994
1995
1996
1997
1998
1999
2000
2001
2002
2003
2004
2005
30
32
34
36
38
40
42
44
46
Openness in Australia
Year
Trade/GDP
Figure 1: Openness versus time in Australia
tabler-icon-diamond-filled.svg

Paraphrase This Document

Need a fresh take? Get an instant paraphrase of this document with our AI Paraphraser
Document Page
4INTERNATIONAL TRADE
1985
1986
1987
1988
1989
1990
1991
1992
1993
1994
1995
1996
1997
1998
1999
2000
2001
2002
2003
2004
2005
250
270
290
310
330
350
370
390
410
430
Openness in Singapore
Year
Trade/GDP
Figure 2: Openness versus time in Singapore
From 1985 to 2005, the openness in both Australia and Singapore has increased overtime.
The share of trade in GDP however differ between the two countries. Australia had a very steady
rise in openness until it reached the highest level of 44.37 2001. After that there was a swift
downfall in the share of trade which again got back the momentum since 2004. Singapore had a
very fluctuating yet an upward sloping curve throughout (Ria 2013). This varying trend is due to
change domestic policies, change of tax cuts or rise rates and the standard of living
4. Relation between trade openness and economic development
Statistical results evidence the link between trade openness and development of the
country (Johnson et al. 2013). In the long run, the countries with more outward orientation reach
the height of quality economic growth.
The estimated correlation coefficient between openness and per capita GDP for Australia
and Singapore are 0.83 and 0.70 respectively. The positive value of correlation coefficient
indicates that for both the nations, openness has a positive impact on economic development. The
Document Page
5INTERNATIONAL TRADE
value of correlation coefficient lies between 0 and 1. More the value of coefficient of correlation
closer to 1, stronger is the country’s economic state. If the value is closer to 0, there is less source
of economic development and growth (Hurst and Pedersen 2017). In this case, the chosen
countries have a strong positive correlation coefficient
5. Policies driving economic openness
After the economic modelling aroused in Australia, merchandise trade liberalization
policies shaped the economy with real GDP being 5.4 percent. Since the last 30 years, the
average rate if applied tariff fell over 7 percent. The reduction in tariff percentage to a maximum
of 5 percent from previous year caused hike in GDP. About of population is employed in trade
and related activities. Australia faced a period of recession during mid of 1990 that led to
downfall in GDP of 1.7 percent. Barriers on car industry increased the GDP by a percent. Service
firms accounts for 70 percent of Australian GDP. The Australian market drew unrestricted
competition from utility service markets like Optus (Amul and Pang 2018).
Singapore had a tariff bound of 9.7 percent in 1999. Within 1995 and 1999, Singapore
lowered the tariff rate aligned to import substitution for automatic and non-automatic import
licensing. To maintain the import restrictions, import of motor vehicles were banned and
licensing of imports for food security. Foreign investment in incorporated local banks were
limited to 40 percent and Singapore being an interactive member of World Trade Organization
pursued linearization at regional level. The Stock Exchange market saw an expansion from 49
percent to 70 percent. The telecommunication market was refrained from trade restrictions for
which the revenue from exports highly increased. 25 percent of Singapore’s GDP is incorporated
from marketing and manufacturing industry. 70 percent of workforce is encountered from the
service sector engaged in trade based work (Chi-Ching and Keng-Chu 2017).
Document Page
6INTERNATIONAL TRADE
Reference List
Amul, G.G.H. and Pang, T., 2018. Progress in tobacco control in Singapore: Lessons and
challenges in the implementation of the framework convention on tobacco control. Asia & the
Pacific Policy Studies, 5(1), pp.102-121.
Chi-Ching, Y. and Keng-Choo, Y., 2017. Human resource management practices in
Singapore. Human Resource Management on the Pacific Rim: Institutions, Practices, and
Attitudes, 60, p.243.
Hurst, B., Ooi, Y.H. and Pedersen, L.H., 2017. A century of evidence on trend-following
investing. The Journal of Portfolio Management, 44(1), pp.15-29.
Johnston, S.E., Gratten, J., Berenos, C., Pilkington, J.G., Clutton-Brock, T.H., Pemberton, J.M.
and Slate, J., 2013. Life history trade-offs at a single locus maintain sexually selected genetic
variation. Nature, 502(7469), p.93.
Rix, A., 2013. The Australia-Japan political alignment: 1952 to the present. Routledge.
Wilson, S., Spies‐Butcher, B., Stebbing, A. and St John, S., 2013. Wage‐Earners' Welfare after
Economic Reform: Refurbishing, Retrenching or Hollowing Out Social Protection in A ustralia
and N ew Z ealand?. Social Policy & Administration, 47(6), pp.623-646.
wto.org 2019. WTO | Trade policy review - Singapore 2000. [online] Wto.org. Available at:
https://www.wto.org/english/tratop_e/tpr_e/tp130_e.htm [Accessed 8 Aug. 2019].
chevron_up_icon
1 out of 7
circle_padding
hide_on_mobile
zoom_out_icon
[object Object]