University International Trade Assignment ECO2ITR Semester 2 2019
VerifiedAdded on 2022/11/30
|12
|1208
|405
Homework Assignment
AI Summary
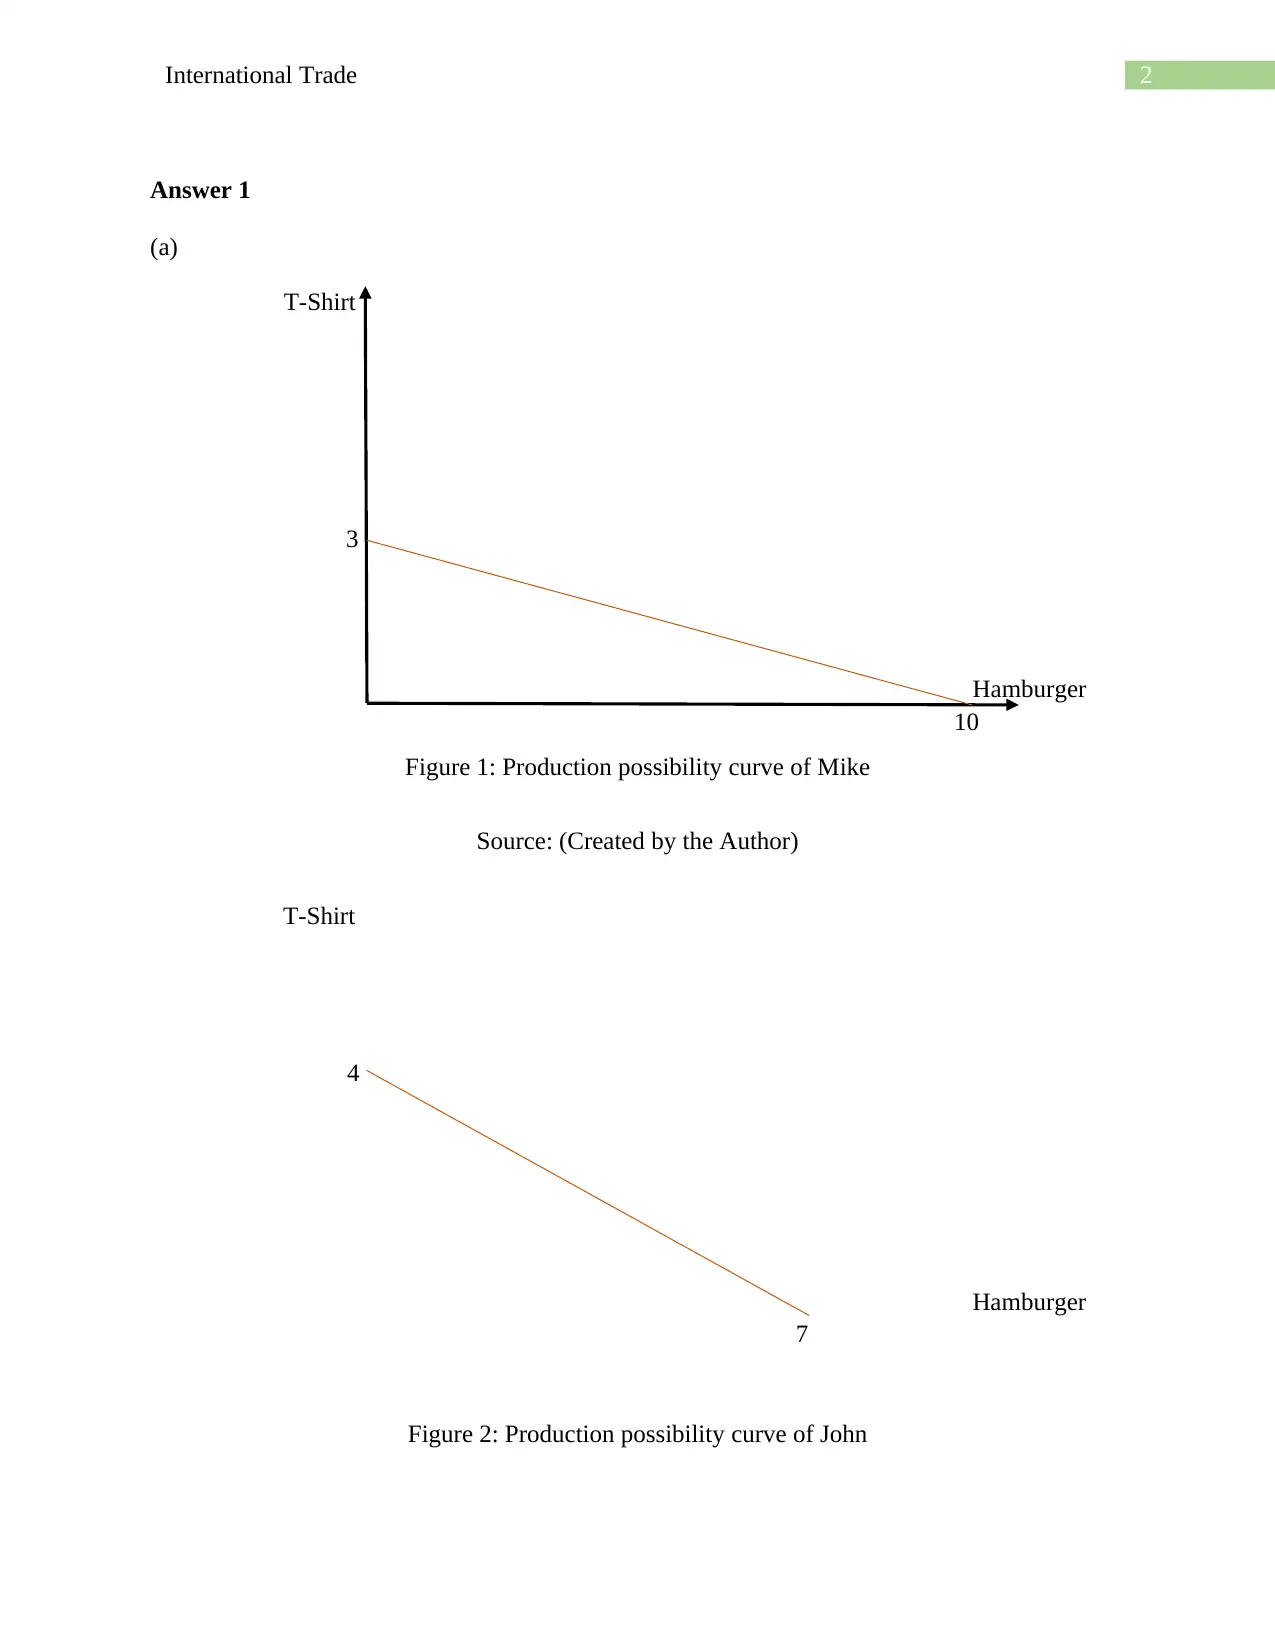
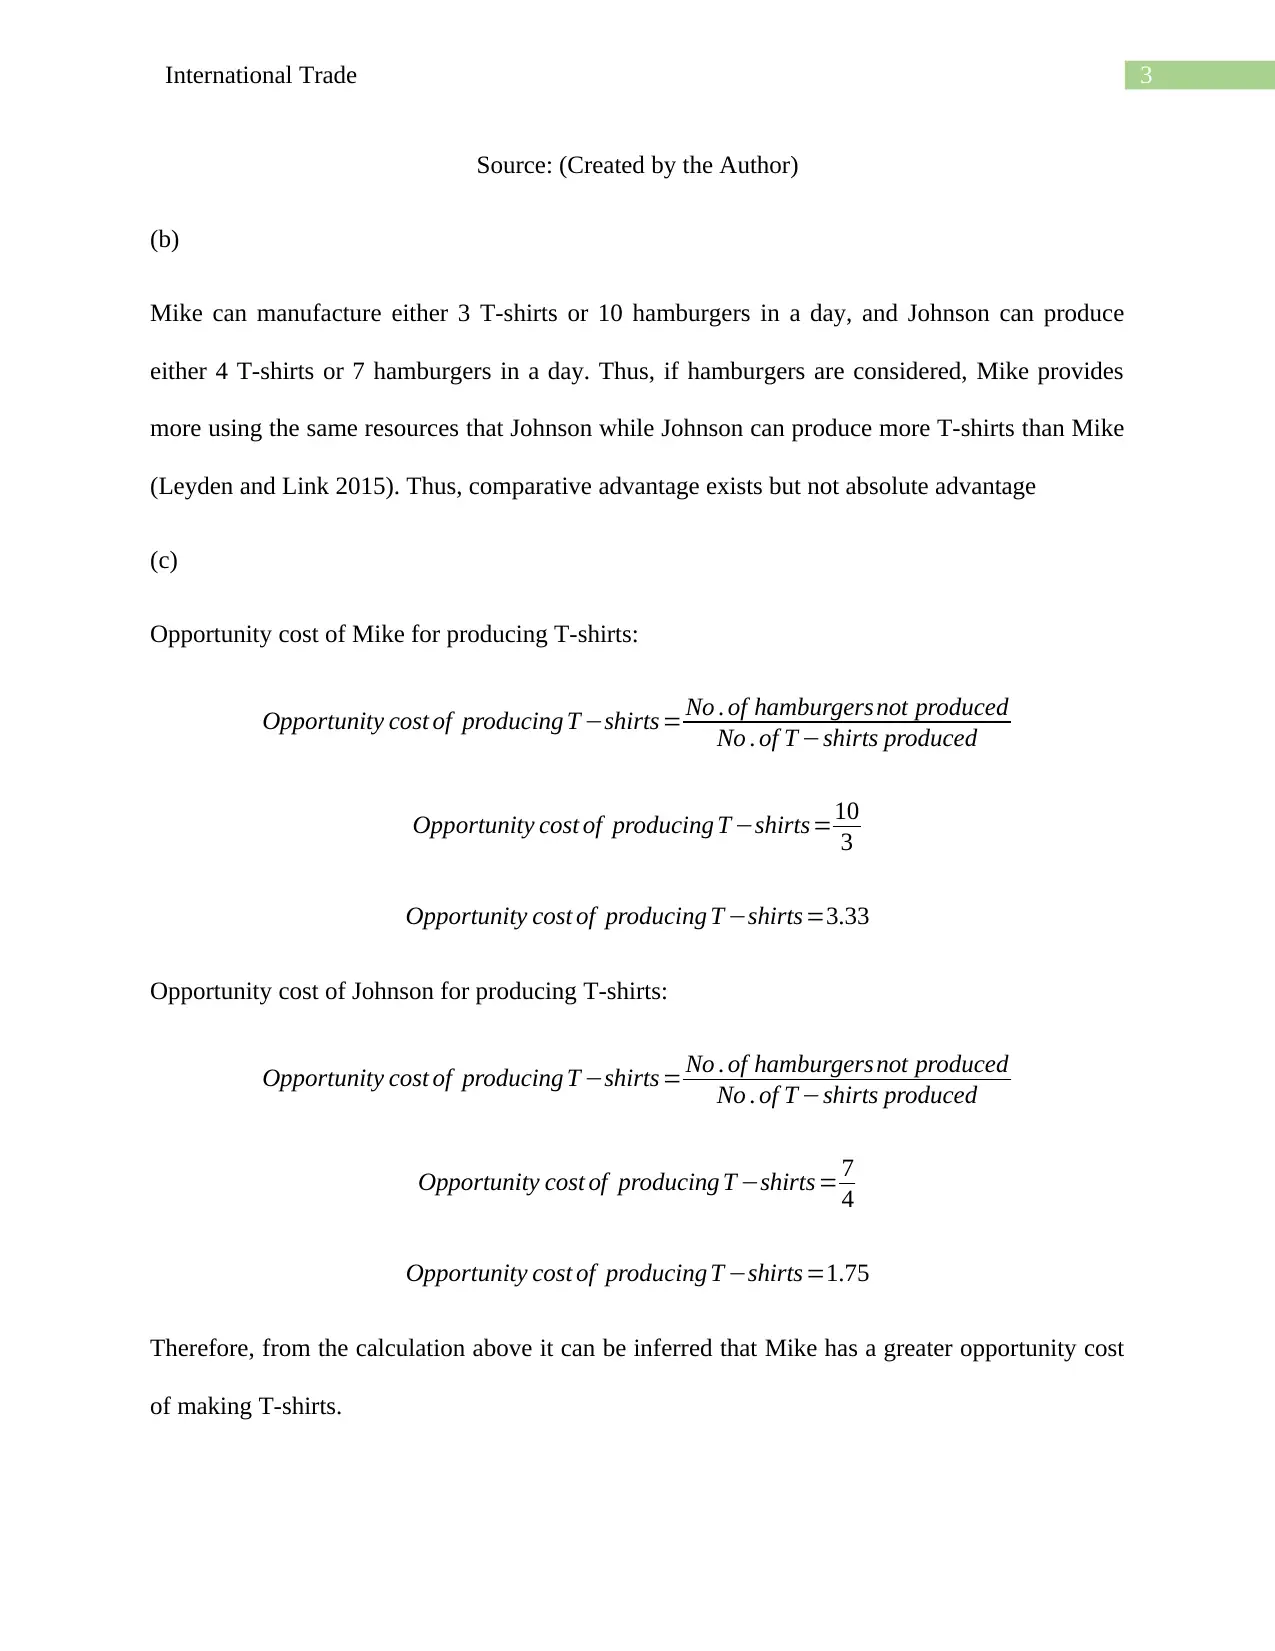
This assignment solution addresses key concepts in international trade, providing a detailed analysis of production possibilities, comparative advantage, and opportunity costs. The assignment begins by examining production possibility curves for two individuals, Mike and Johnson, and determining their absolute and comparative advantages in producing hamburgers and T-shirts. It then explores a scenario involving two economies, H and F, and their production of goods X and Y, analyzing autarky equilibrium, opportunity costs, and world price ratios. The solution includes the construction of production possibility frontiers and relative supply curves to illustrate the impact of trade. Finally, the assignment delves into the effects of trade on production factors and income distribution, examining how capital, land, and labor are affected. The solution concludes with multiple-choice questions testing the understanding of core international trade principles.

Running head: International Trade
International Trade
Name of the Student
Name of the University
Student ID
International Trade
Name of the Student
Name of the University
Student ID
Paraphrase This Document
Need a fresh take? Get an instant paraphrase of this document with our AI Paraphraser

1International Trade
Table of Contents
Answer 1..........................................................................................................................................2
Answer 2..........................................................................................................................................4
Answer 3..........................................................................................................................................8
Answer 4........................................................................................................................................10
References......................................................................................................................................11

2International Trade
10
3
Hamburger
T-Shirt
7
4
Hamburger
T-Shirt
Answer 1
(a)
Figure 1: Production possibility curve of Mike
Source: (Created by the Author)
Figure 2: Production possibility curve of John
10
3
Hamburger
T-Shirt
7
4
Hamburger
T-Shirt
Answer 1
(a)
Figure 1: Production possibility curve of Mike
Source: (Created by the Author)
Figure 2: Production possibility curve of John
⊘ This is a preview!⊘
Do you want full access?
Subscribe today to unlock all pages.

Trusted by 1+ million students worldwide

3International Trade
Source: (Created by the Author)
(b)
Mike can manufacture either 3 T-shirts or 10 hamburgers in a day, and Johnson can produce
either 4 T-shirts or 7 hamburgers in a day. Thus, if hamburgers are considered, Mike provides
more using the same resources that Johnson while Johnson can produce more T-shirts than Mike
(Leyden and Link 2015). Thus, comparative advantage exists but not absolute advantage
(c)
Opportunity cost of Mike for producing T-shirts:
Opportunity cost of producing T −shirts = No . of hamburgersnot produced
No . of T −shirts produced
Opportunity cost of producing T −shirts=10
3
Opportunity cost of producing T −shirts=3.33
Opportunity cost of Johnson for producing T-shirts:
Opportunity cost of producing T −shirts = No . of hamburgersnot produced
No . of T −shirts produced
Opportunity cost of producing T −shirts = 7
4
Opportunity cost of producing T −shirts =1.75
Therefore, from the calculation above it can be inferred that Mike has a greater opportunity cost
of making T-shirts.
Paraphrase This Document
Need a fresh take? Get an instant paraphrase of this document with our AI Paraphraser

4International Trade
(d)
Mike- Opprotunity cost of making hamburgers:
Opportunity cost of hamburgers= No . of T −shirts manufactured
No . of hamburgersnot manufactured
Opportunity cost ofhamburgers= 3
10
Opportunity cost of hamburgers=0.3
Johnson - opportunity cost of hamburgers:
Opportunity cost of hamburgers= No . of T −shirts manufactured
No . of hamburgersnot manufactured
Opportunity cost of hamburgers= 4
7
Opportunity cost of hamburgers=0.57
From the calculation above it is observed that Johnson has greater opportunity cost of making
hamburgers than Mike. Thus, comparative advantage in making hamburgers is owned by Mike.
Answer 2
Country H has 2400 units of labour and to manufacture a unit of Y and X it utilizes 12
units and 6 units of labour respectively. Therefore, if total labour is used in production of good
X, then 400 units of X can be producedSimilarly using same amount o labour 200 unit sof Y can
be proudced.

5International Trade
200
400
Y
X
On the other hand, Country F with 1800 labour produces 450 unit of good X and 900
units of good Y.
(a)
Figure 3: H’s PPF
Source: (Created by the Author)
200
400
Y
X
On the other hand, Country F with 1800 labour produces 450 unit of good X and 900
units of good Y.
(a)
Figure 3: H’s PPF
Source: (Created by the Author)
⊘ This is a preview!⊘
Do you want full access?
Subscribe today to unlock all pages.

Trusted by 1+ million students worldwide

6International Trade
900
450
Y
X
Figure 4: F’s PPF
Source: (Created by the Author)
Autarky equilibrium price ratio∈country H = Px
Py
¿ , Autarky equilibrium price ratio∈country H= 400
200
¿ , Autarky equilibrium price ratio∈country H=2
Autarky equilibrium price ratio∈country F= Px
Py
¿ , Autarky equilibrium price ratio∈country F= 450
900
¿ , Autarky equilibrium price ratio∈country F=0.5
900
450
Y
X
Figure 4: F’s PPF
Source: (Created by the Author)
Autarky equilibrium price ratio∈country H = Px
Py
¿ , Autarky equilibrium price ratio∈country H= 400
200
¿ , Autarky equilibrium price ratio∈country H=2
Autarky equilibrium price ratio∈country F= Px
Py
¿ , Autarky equilibrium price ratio∈country F= 450
900
¿ , Autarky equilibrium price ratio∈country F=0.5
Paraphrase This Document
Need a fresh take? Get an instant paraphrase of this document with our AI Paraphraser

7International Trade
(b)
H' s opportunity cost of producing X= 200
400
¿ , H' s opportunity cost of producing X=0.5
H' s opportunity cost of producing Y = 400
200
¿ , H' s opportunity cost of producingY =2
F' s opportunity cost of producing X= 900
450
¿ , F' s opportunity cost of producing X =2
F' s opportunity cost of producing Y = 450
900
¿ , F' s opportunity cost of producing Y =0.5
Therefore,
World price ratio for X= 0.5
2
¿ , World price ratio for X =0.25
World price ratio for Y = 2
0.5
¿ , World price ratio for Y =4
Range of feasible equilibrium world price ratios is 0.5 to 4
(c) H has lower opportunity cost of manufacturing good X and thus it will export X.

8International Trade
150
Good1
Good 2
100
100
(d) While trading countries use similar factors of production and thus to shortlist the item that is
to be traded price of factors of production are equalized and thus it can be said that trade does
equlaize the real return on labour.
Answer 3
(a)
Figure 5: Shift in PPF for good 1 due to rise in capital in the home country
Source: (Created by the Author)
Good 1 uses labour and capital for its production. Thus increase in capital in the home
country increases its capacity to produce more of good 1 due availability of more amount of
factor. This increased possibility of more production shifts the PPF for good 1. However,
increment in output has been assumed as 50 because the increase in the amount of capital is not
known.
⊘ This is a preview!⊘
Do you want full access?
Subscribe today to unlock all pages.

Trusted by 1+ million students worldwide

9International Trade
(b)
Figure 6: Relative supply curve for Home country
Source: (Created by the Author)
Figure 7: Relative supply curve for Foreign country
0 20 40 60 80 100 120
0
20
40
60
80
100
120
0 20 40 60 80 100 120
0
20
40
60
80
100
120
(b)
Figure 6: Relative supply curve for Home country
Source: (Created by the Author)
Figure 7: Relative supply curve for Foreign country
0 20 40 60 80 100 120
0
20
40
60
80
100
120
0 20 40 60 80 100 120
0
20
40
60
80
100
120
Paraphrase This Document
Need a fresh take? Get an instant paraphrase of this document with our AI Paraphraser

10International Trade
Source: (Created by the Author)
(c) Home country will export Good 1 after making participation in the trade because in home
county amount of capital has increased which allowed it to produce more of good 1 and it gained
the comparative advantage in good 1 production. Hence, the Foreign country will export good 2
(d) Capital, land and labour are free production factors, and these are affected by trade. Thus,
when both the concerned country engages in trade the mobile factor is affected the most. The
wages of labour changes and transfer of labour occurs from one sector to another (Becker 2017).
However, the immobile factors do not get directly affected. The difference in the number of
labour in the sector changes the productivity of capital and labour. It means that if labour
increases in land-intensive sector productivity of per unit of land increases and similarly
productivity of per unit of capital increases.
Answer 4
(1) D) Pre-trade and free-trade relative prices are identical
(2) B) more, higher, mobile
(3) C) Trade can have substantial effects on a country’s distribution of income
(4) C) a curved line, diminishing marginal returns
(5) A) is insignificant in the short run

11International Trade
References
Becker, G.S., 2017. Economic theory. Routledge.
Leyden, D.P. and Link, A.N., 2015. Toward a theory of the entrepreneurial process. Small
Business Economics, 44(3), pp.475-484.
References
Becker, G.S., 2017. Economic theory. Routledge.
Leyden, D.P. and Link, A.N., 2015. Toward a theory of the entrepreneurial process. Small
Business Economics, 44(3), pp.475-484.
⊘ This is a preview!⊘
Do you want full access?
Subscribe today to unlock all pages.

Trusted by 1+ million students worldwide
1 out of 12
Related Documents

Your All-in-One AI-Powered Toolkit for Academic Success.
+13062052269
info@desklib.com
Available 24*7 on WhatsApp / Email
Unlock your academic potential
Copyright © 2020–2025 A2Z Services. All Rights Reserved. Developed and managed by ZUCOL.