MAE 213: International Trade Assignment - Trimester 2, 2019
VerifiedAdded on 2022/12/12
|12
|2503
|359
Homework Assignment
AI Summary
This assignment analyzes Australia's international trade relationships, focusing on the impact of free trade agreements (FTAs) with countries like New Zealand, the USA, and Thailand. It examines the validity of claims regarding export and import dynamics, providing trade data analysis to support its arguments. The assignment further delves into the welfare analysis of FTAs, particularly between Australia and South Korea, using supply and demand diagrams to illustrate the effects on consumer and producer surplus. It explores the concept of rules of origin and their implications for Australian exporters, including the use of the gravity model to explain trade flows and challenges faced. Finally, the assignment investigates the effects of an FTA with New Zealand on the demand and supply of electronics, assessing the impact on consumer and producer surplus when considering the removal of the FTA.
1
MAE 213 INTERNATIONAL TRADE
WRITTEN ASSIGNMENT
TRIMESTER 2 2019
MAE 213 INTERNATIONAL TRADE
WRITTEN ASSIGNMENT
TRIMESTER 2 2019
Paraphrase This Document
Need a fresh take? Get an instant paraphrase of this document with our AI Paraphraser

2
Contents
Question 1..................................................................................................................................3
Question 2..................................................................................................................................5
Question 3..................................................................................................................................7
Question 4..................................................................................................................................8
Reference..................................................................................................................................11
3
Question 1
Australian trade relationships have boosted import more than the exports
Import and export is an important component of the economy and also contributes to the
aggregate demand of the economy. Jointly, the import and export have a huge role to play in
increasing the average income of the country and improving the living standard of the people
of the economy. In the given article, the statement given by Peter Martin is partially justified
as we can see from the trade data with the partners. In order to examine the validity of the
claims made by Peter Martin, we can analyse the trade data with the old trade partners of
Australia.
1981
1983
1985
1987
1989
1991
1993
1995
1997
1999
0
500000000
1000000000
1500000000
2000000000
2500000000
3000000000
3500000000
4000000000
4500000000
5000000000
International trade with New Zealand
Export
Import
Years
US Dollars
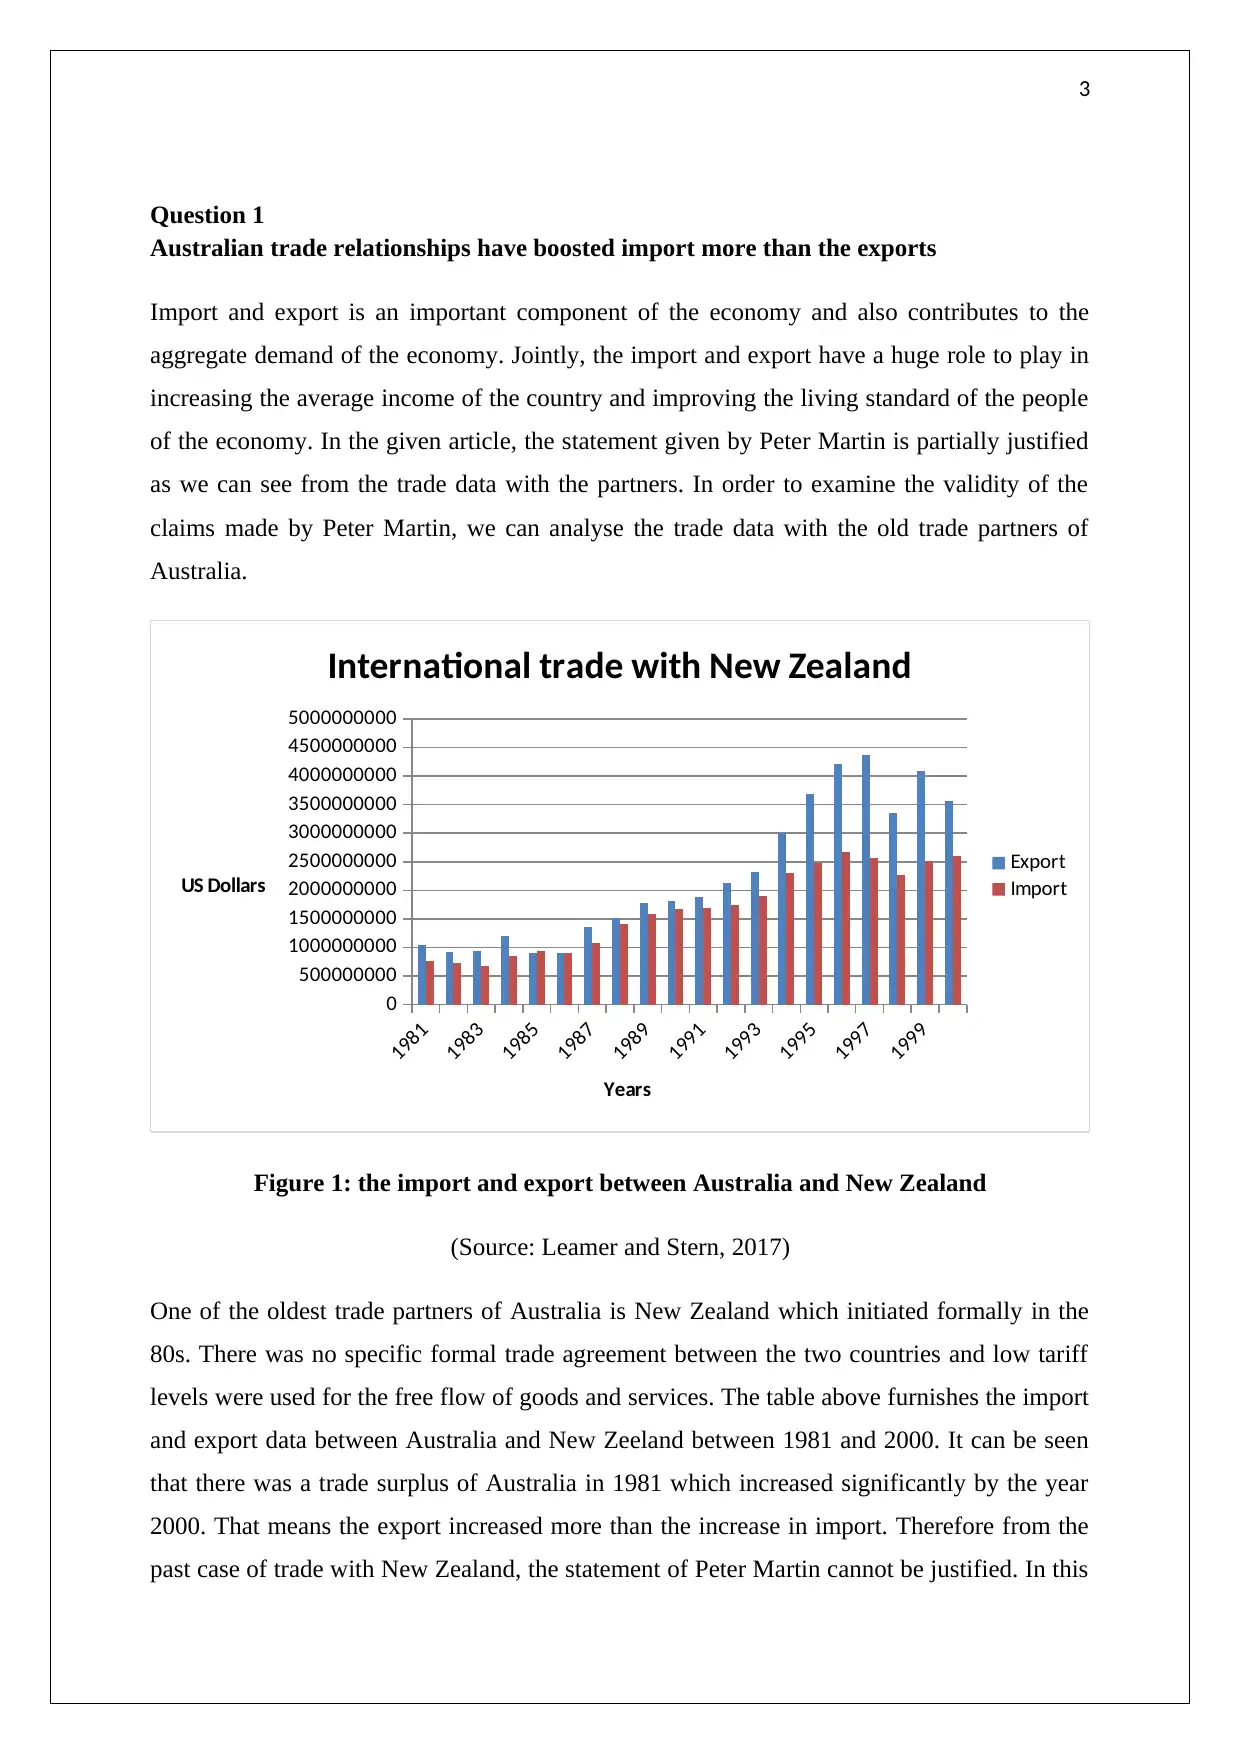
Figure 1: the import and export between Australia and New Zealand
(Source: Leamer and Stern, 2017)
One of the oldest trade partners of Australia is New Zealand which initiated formally in the
80s. There was no specific formal trade agreement between the two countries and low tariff
levels were used for the free flow of goods and services. The table above furnishes the import
and export data between Australia and New Zeeland between 1981 and 2000. It can be seen
that there was a trade surplus of Australia in 1981 which increased significantly by the year
2000. That means the export increased more than the increase in import. Therefore from the
past case of trade with New Zealand, the statement of Peter Martin cannot be justified. In this
Question 1
Australian trade relationships have boosted import more than the exports
Import and export is an important component of the economy and also contributes to the
aggregate demand of the economy. Jointly, the import and export have a huge role to play in
increasing the average income of the country and improving the living standard of the people
of the economy. In the given article, the statement given by Peter Martin is partially justified
as we can see from the trade data with the partners. In order to examine the validity of the
claims made by Peter Martin, we can analyse the trade data with the old trade partners of
Australia.
1981
1983
1985
1987
1989
1991
1993
1995
1997
1999
0
500000000
1000000000
1500000000
2000000000
2500000000
3000000000
3500000000
4000000000
4500000000
5000000000
International trade with New Zealand
Export
Import
Years
US Dollars
Figure 1: the import and export between Australia and New Zealand
(Source: Leamer and Stern, 2017)
One of the oldest trade partners of Australia is New Zealand which initiated formally in the
80s. There was no specific formal trade agreement between the two countries and low tariff
levels were used for the free flow of goods and services. The table above furnishes the import
and export data between Australia and New Zeeland between 1981 and 2000. It can be seen
that there was a trade surplus of Australia in 1981 which increased significantly by the year
2000. That means the export increased more than the increase in import. Therefore from the
past case of trade with New Zealand, the statement of Peter Martin cannot be justified. In this
⊘ This is a preview!⊘
Do you want full access?
Subscribe today to unlock all pages.
Trusted by 1+ million students worldwide
4
case, the trade with New Zealand has improved the trade surplus of Australia that in turn has
allowed Australia to increase its per capita wealth during that time.
1995
1997
1999
2001
2003
2005
2007
2009
2011
2013
2015
0
5000000000
10000000000
15000000000
20000000000
25000000000
30000000000
35000000000
International Trade with the USA
Export
Import
Years
US Dollars
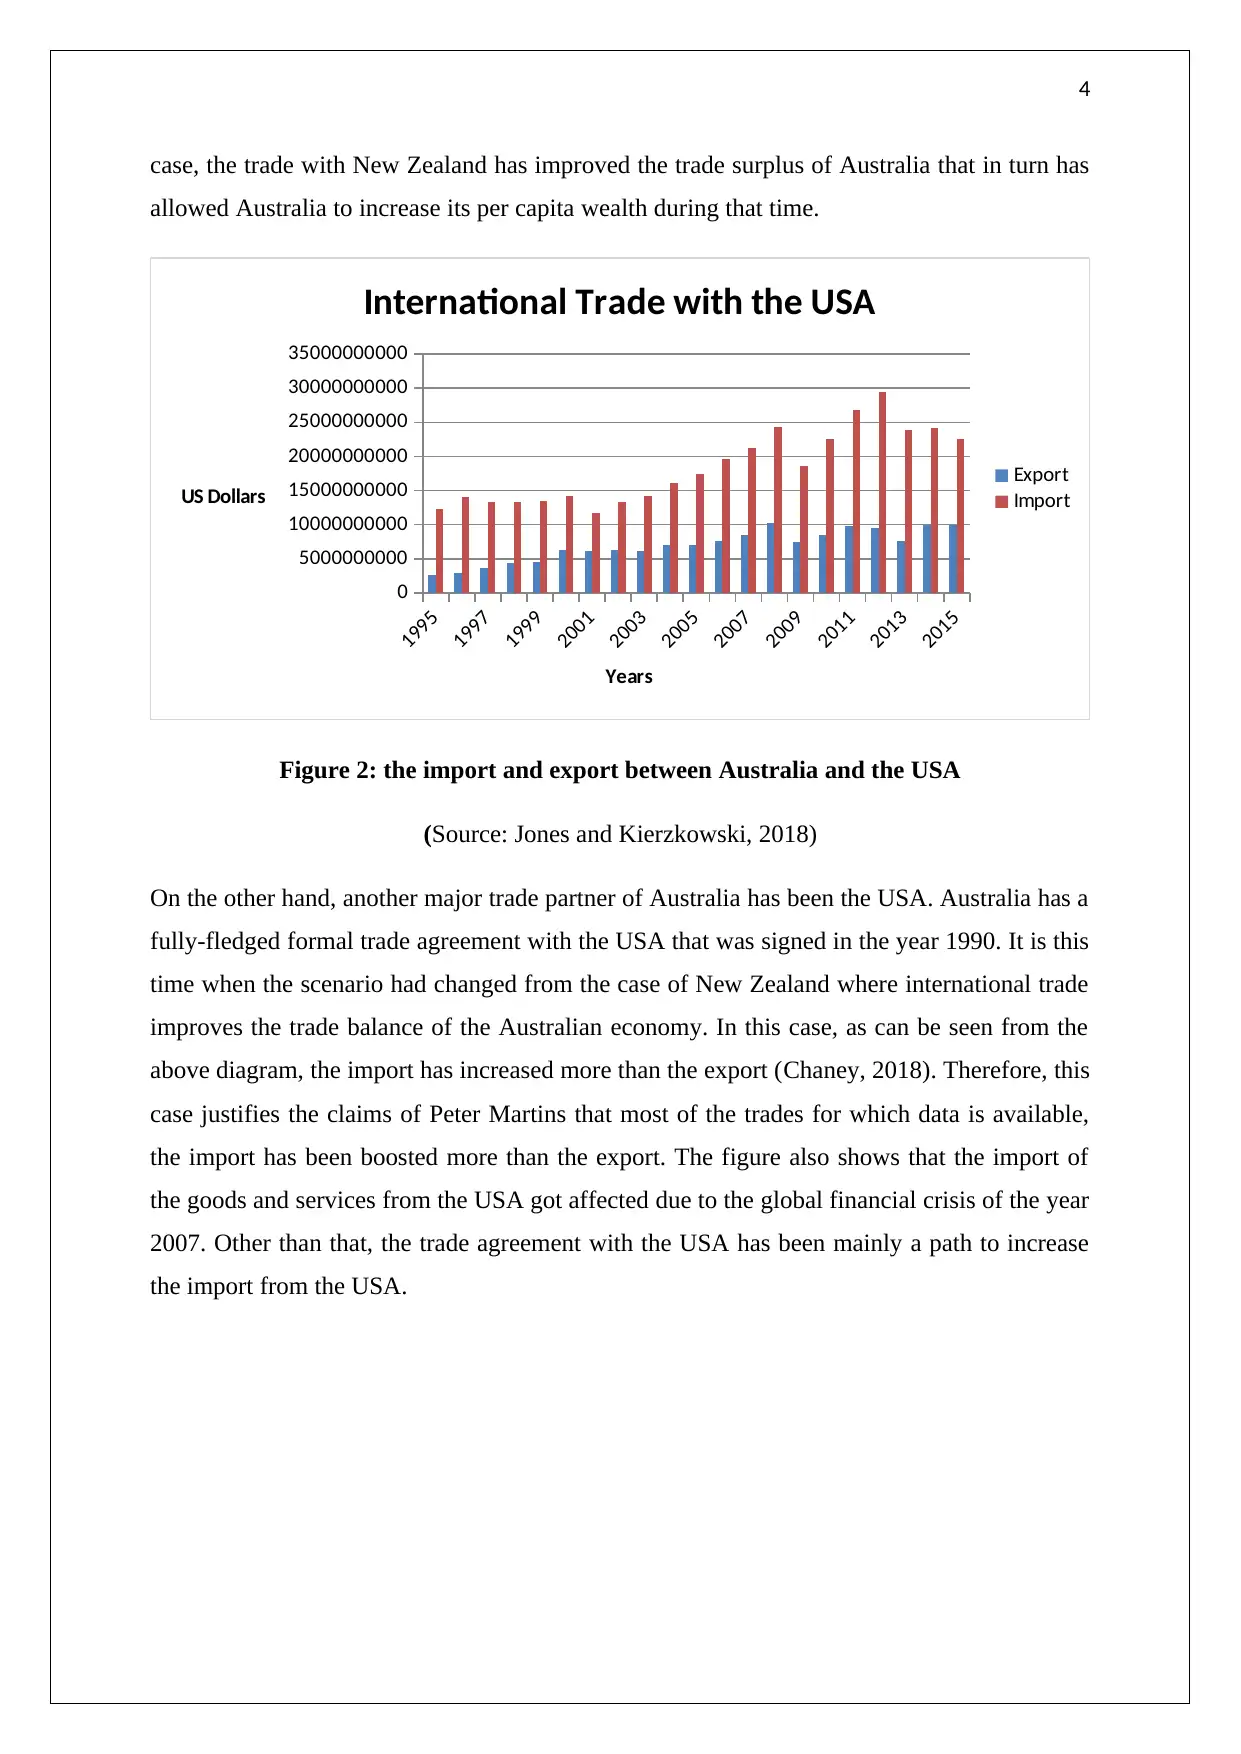
Figure 2: the import and export between Australia and the USA
(Source: Jones and Kierzkowski, 2018)
On the other hand, another major trade partner of Australia has been the USA. Australia has a
fully-fledged formal trade agreement with the USA that was signed in the year 1990. It is this
time when the scenario had changed from the case of New Zealand where international trade
improves the trade balance of the Australian economy. In this case, as can be seen from the
above diagram, the import has increased more than the export (Chaney, 2018). Therefore, this
case justifies the claims of Peter Martins that most of the trades for which data is available,
the import has been boosted more than the export. The figure also shows that the import of
the goods and services from the USA got affected due to the global financial crisis of the year
2007. Other than that, the trade agreement with the USA has been mainly a path to increase
the import from the USA.
case, the trade with New Zealand has improved the trade surplus of Australia that in turn has
allowed Australia to increase its per capita wealth during that time.
1995
1997
1999
2001
2003
2005
2007
2009
2011
2013
2015
0
5000000000
10000000000
15000000000
20000000000
25000000000
30000000000
35000000000
International Trade with the USA
Export
Import
Years
US Dollars
Figure 2: the import and export between Australia and the USA
(Source: Jones and Kierzkowski, 2018)
On the other hand, another major trade partner of Australia has been the USA. Australia has a
fully-fledged formal trade agreement with the USA that was signed in the year 1990. It is this
time when the scenario had changed from the case of New Zealand where international trade
improves the trade balance of the Australian economy. In this case, as can be seen from the
above diagram, the import has increased more than the export (Chaney, 2018). Therefore, this
case justifies the claims of Peter Martins that most of the trades for which data is available,
the import has been boosted more than the export. The figure also shows that the import of
the goods and services from the USA got affected due to the global financial crisis of the year
2007. Other than that, the trade agreement with the USA has been mainly a path to increase
the import from the USA.
Paraphrase This Document
Need a fresh take? Get an instant paraphrase of this document with our AI Paraphraser
5
1995
1997
1999
2001
2003
2005
2007
2009
2011
2013
2015
0
2000000000
4000000000
6000000000
8000000000
10000000000
12000000000
International trade with Thailand
Export
Import
year
US Dollar
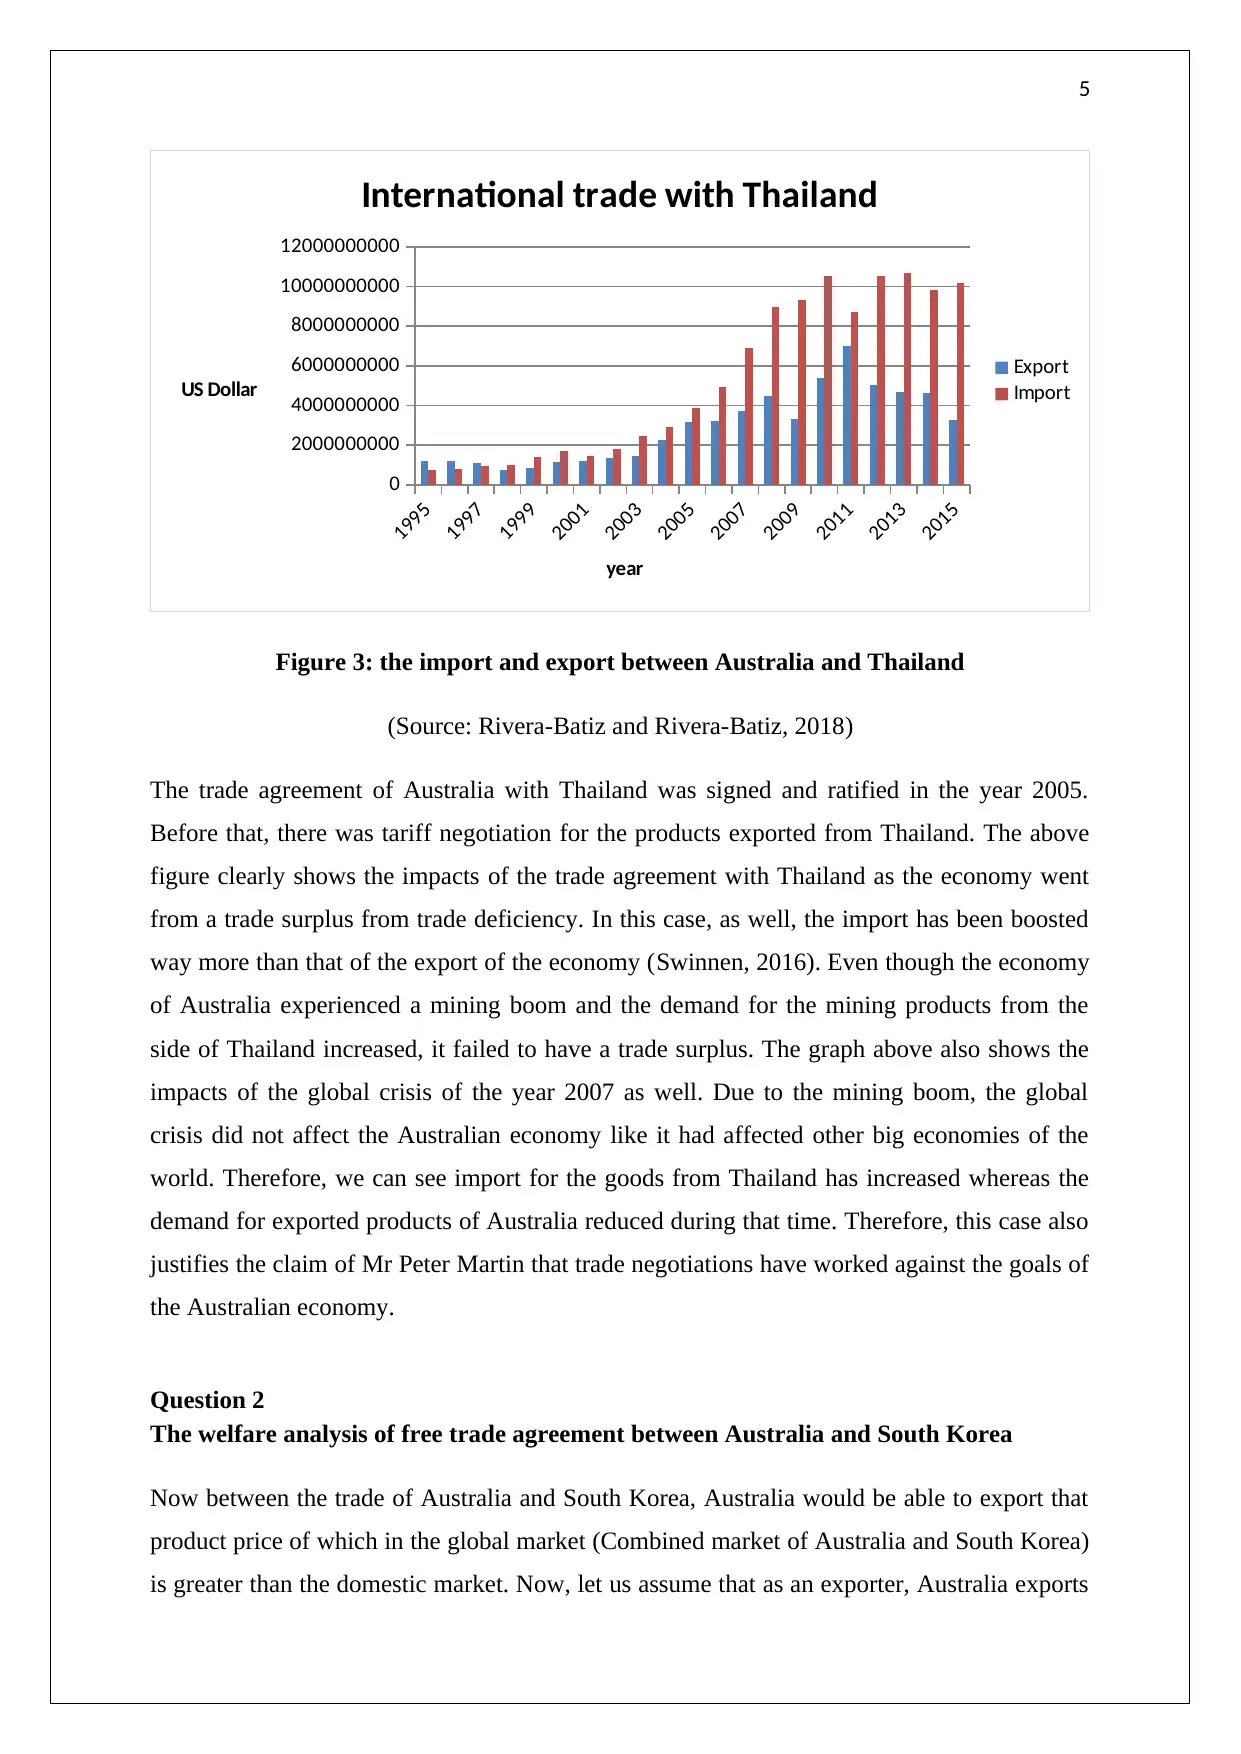
Figure 3: the import and export between Australia and Thailand
(Source: Rivera-Batiz and Rivera-Batiz, 2018)
The trade agreement of Australia with Thailand was signed and ratified in the year 2005.
Before that, there was tariff negotiation for the products exported from Thailand. The above
figure clearly shows the impacts of the trade agreement with Thailand as the economy went
from a trade surplus from trade deficiency. In this case, as well, the import has been boosted
way more than that of the export of the economy (Swinnen, 2016). Even though the economy
of Australia experienced a mining boom and the demand for the mining products from the
side of Thailand increased, it failed to have a trade surplus. The graph above also shows the
impacts of the global crisis of the year 2007 as well. Due to the mining boom, the global
crisis did not affect the Australian economy like it had affected other big economies of the
world. Therefore, we can see import for the goods from Thailand has increased whereas the
demand for exported products of Australia reduced during that time. Therefore, this case also
justifies the claim of Mr Peter Martin that trade negotiations have worked against the goals of
the Australian economy.
Question 2
The welfare analysis of free trade agreement between Australia and South Korea
Now between the trade of Australia and South Korea, Australia would be able to export that
product price of which in the global market (Combined market of Australia and South Korea)
is greater than the domestic market. Now, let us assume that as an exporter, Australia exports
1995
1997
1999
2001
2003
2005
2007
2009
2011
2013
2015
0
2000000000
4000000000
6000000000
8000000000
10000000000
12000000000
International trade with Thailand
Export
Import
year
US Dollar
Figure 3: the import and export between Australia and Thailand
(Source: Rivera-Batiz and Rivera-Batiz, 2018)
The trade agreement of Australia with Thailand was signed and ratified in the year 2005.
Before that, there was tariff negotiation for the products exported from Thailand. The above
figure clearly shows the impacts of the trade agreement with Thailand as the economy went
from a trade surplus from trade deficiency. In this case, as well, the import has been boosted
way more than that of the export of the economy (Swinnen, 2016). Even though the economy
of Australia experienced a mining boom and the demand for the mining products from the
side of Thailand increased, it failed to have a trade surplus. The graph above also shows the
impacts of the global crisis of the year 2007 as well. Due to the mining boom, the global
crisis did not affect the Australian economy like it had affected other big economies of the
world. Therefore, we can see import for the goods from Thailand has increased whereas the
demand for exported products of Australia reduced during that time. Therefore, this case also
justifies the claim of Mr Peter Martin that trade negotiations have worked against the goals of
the Australian economy.
Question 2
The welfare analysis of free trade agreement between Australia and South Korea
Now between the trade of Australia and South Korea, Australia would be able to export that
product price of which in the global market (Combined market of Australia and South Korea)
is greater than the domestic market. Now, let us assume that as an exporter, Australia exports
6
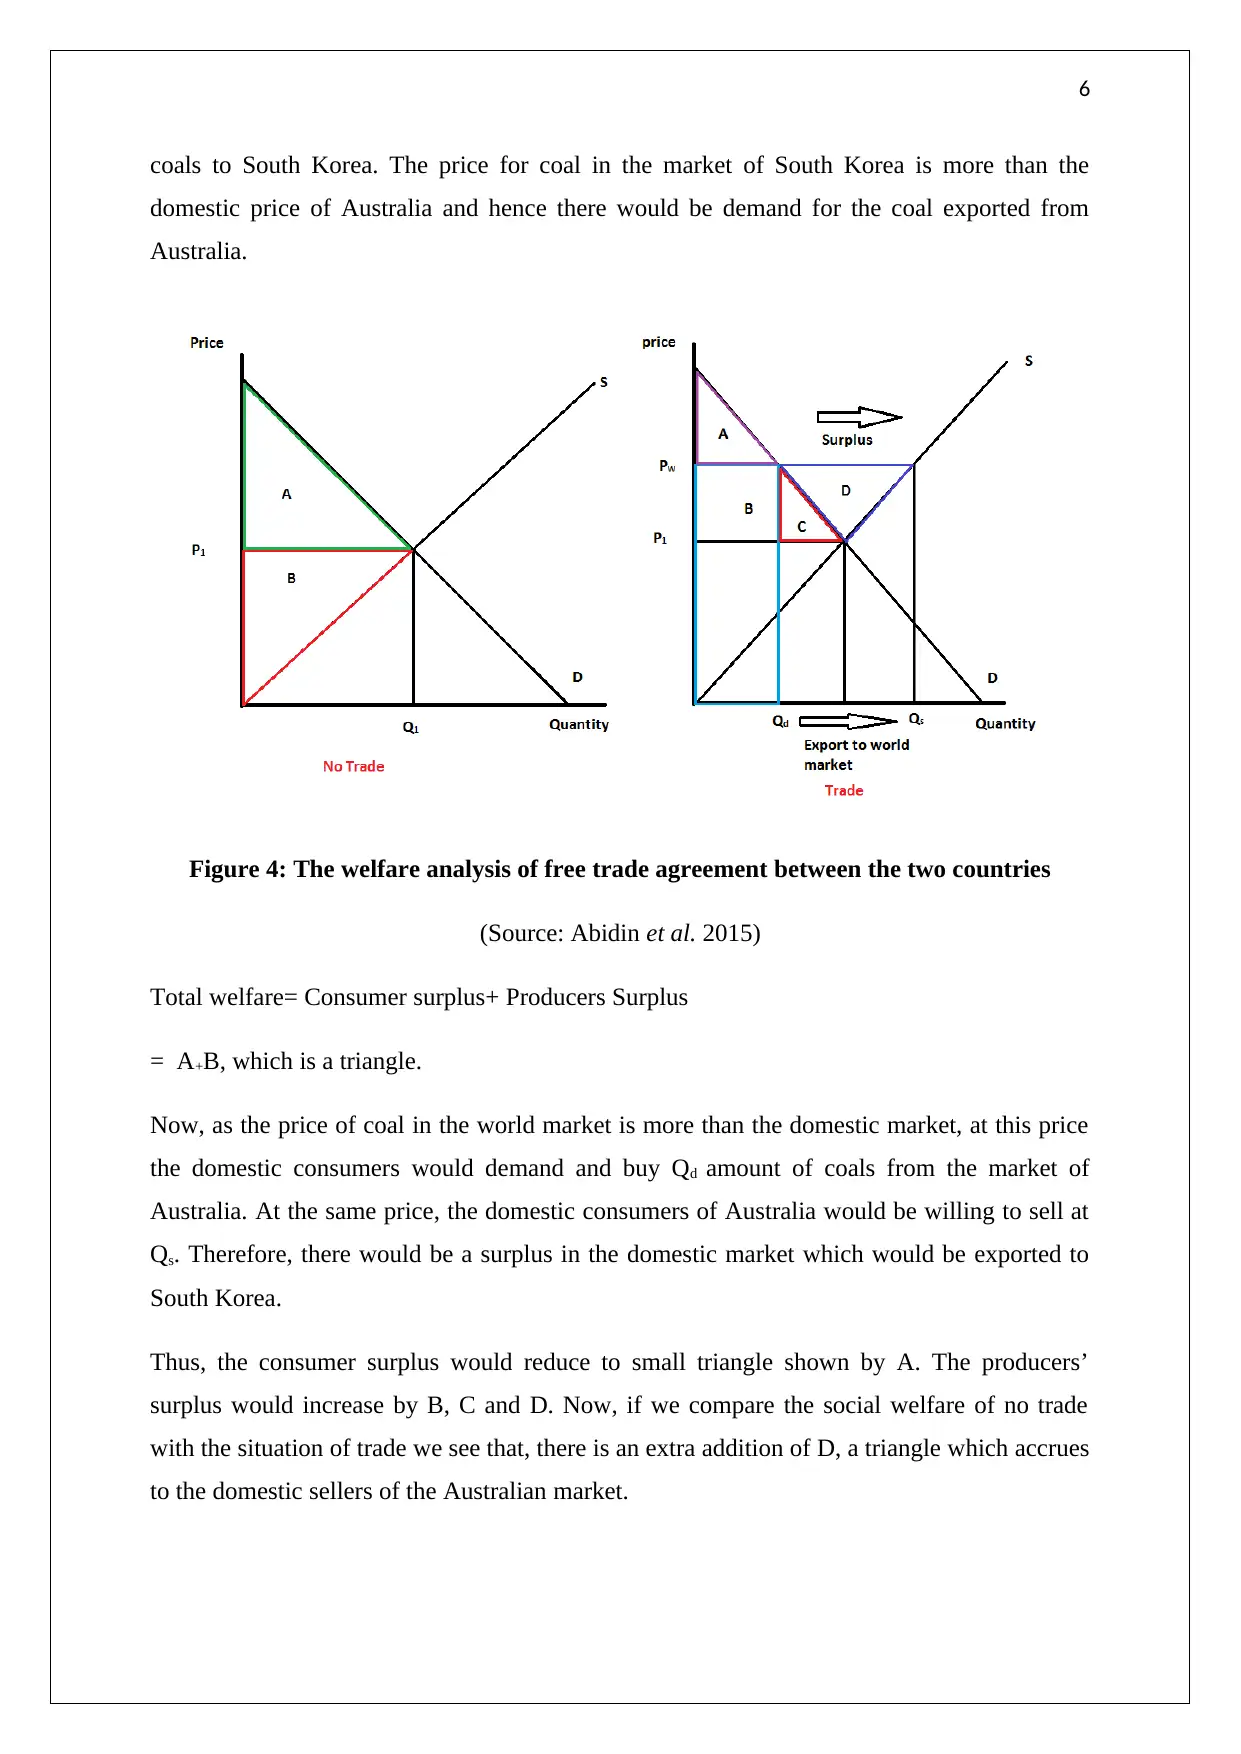
coals to South Korea. The price for coal in the market of South Korea is more than the
domestic price of Australia and hence there would be demand for the coal exported from
Australia.
Figure 4: The welfare analysis of free trade agreement between the two countries
(Source: Abidin et al. 2015)
Total welfare= Consumer surplus+ Producers Surplus
= A+B, which is a triangle.
Now, as the price of coal in the world market is more than the domestic market, at this price
the domestic consumers would demand and buy Qd amount of coals from the market of
Australia. At the same price, the domestic consumers of Australia would be willing to sell at
Qs. Therefore, there would be a surplus in the domestic market which would be exported to
South Korea.
Thus, the consumer surplus would reduce to small triangle shown by A. The producers’
surplus would increase by B, C and D. Now, if we compare the social welfare of no trade
with the situation of trade we see that, there is an extra addition of D, a triangle which accrues
to the domestic sellers of the Australian market.
⊘ This is a preview!⊘
Do you want full access?
Subscribe today to unlock all pages.
Trusted by 1+ million students worldwide
7
The figure shows that in no trade situation, social welfare is the area of the green and red
triangle. On the other hand, the social welfare in case of a trade agreement with South Korea,
the social welfare is the summation of Purple A, Red C, Navy Blue D and light Blue B.
Clearly, the area of the latter is more than the former.
Therefore, Australia as an exporter would gain from the trade agreement between the two
countries.
Question 3
Rules of origin
Rules of origin are referred to as the assignment of nationality to a product which is
developed inside a specific national border. These rules of origin are used in the trade
negotiations such as the tariff, quota, measures, anti-dumping duties and many more. In the
literature of international trade, the rules of origin are a complex topic which is getting even
tougher in the wake of globalisation and heterogeneous standards in different parts of the
world (Kohl et al. 2016).
Negative impacts on Australian exporters
According to the article, the different trade agreements undertaken by Australia are not
always consistent with each other and hence the requirements are overlapping in many cases
(Martin, 2019). Thus, the new trade agreement proposed by Australia becomes complex and
harder to maintain. In addition to that, adherence to the rules of origin sometimes creates a
burden on the Australian companies in the export scenario. For example, while exporting
product to the market of the USA, the Australian companies need to make sure that no more
than a certain portion of the input used in the product is produced outside Australia or the
USA. This reduces the flexibility of the Australian companies as exporters. Therefore, the
overlapping of cost which sometimes accounts for 8% of the overall cost of production has
negative impacts on the Australian exporters (Foley and Manova, 2015).
Use of gravity model
The gravity model of international trade predicts the flow of trade between the two countries
given the size of the two economies and the geographical distance between them. The gravity
Paraphrase This Document
Need a fresh take? Get an instant paraphrase of this document with our AI Paraphraser
8
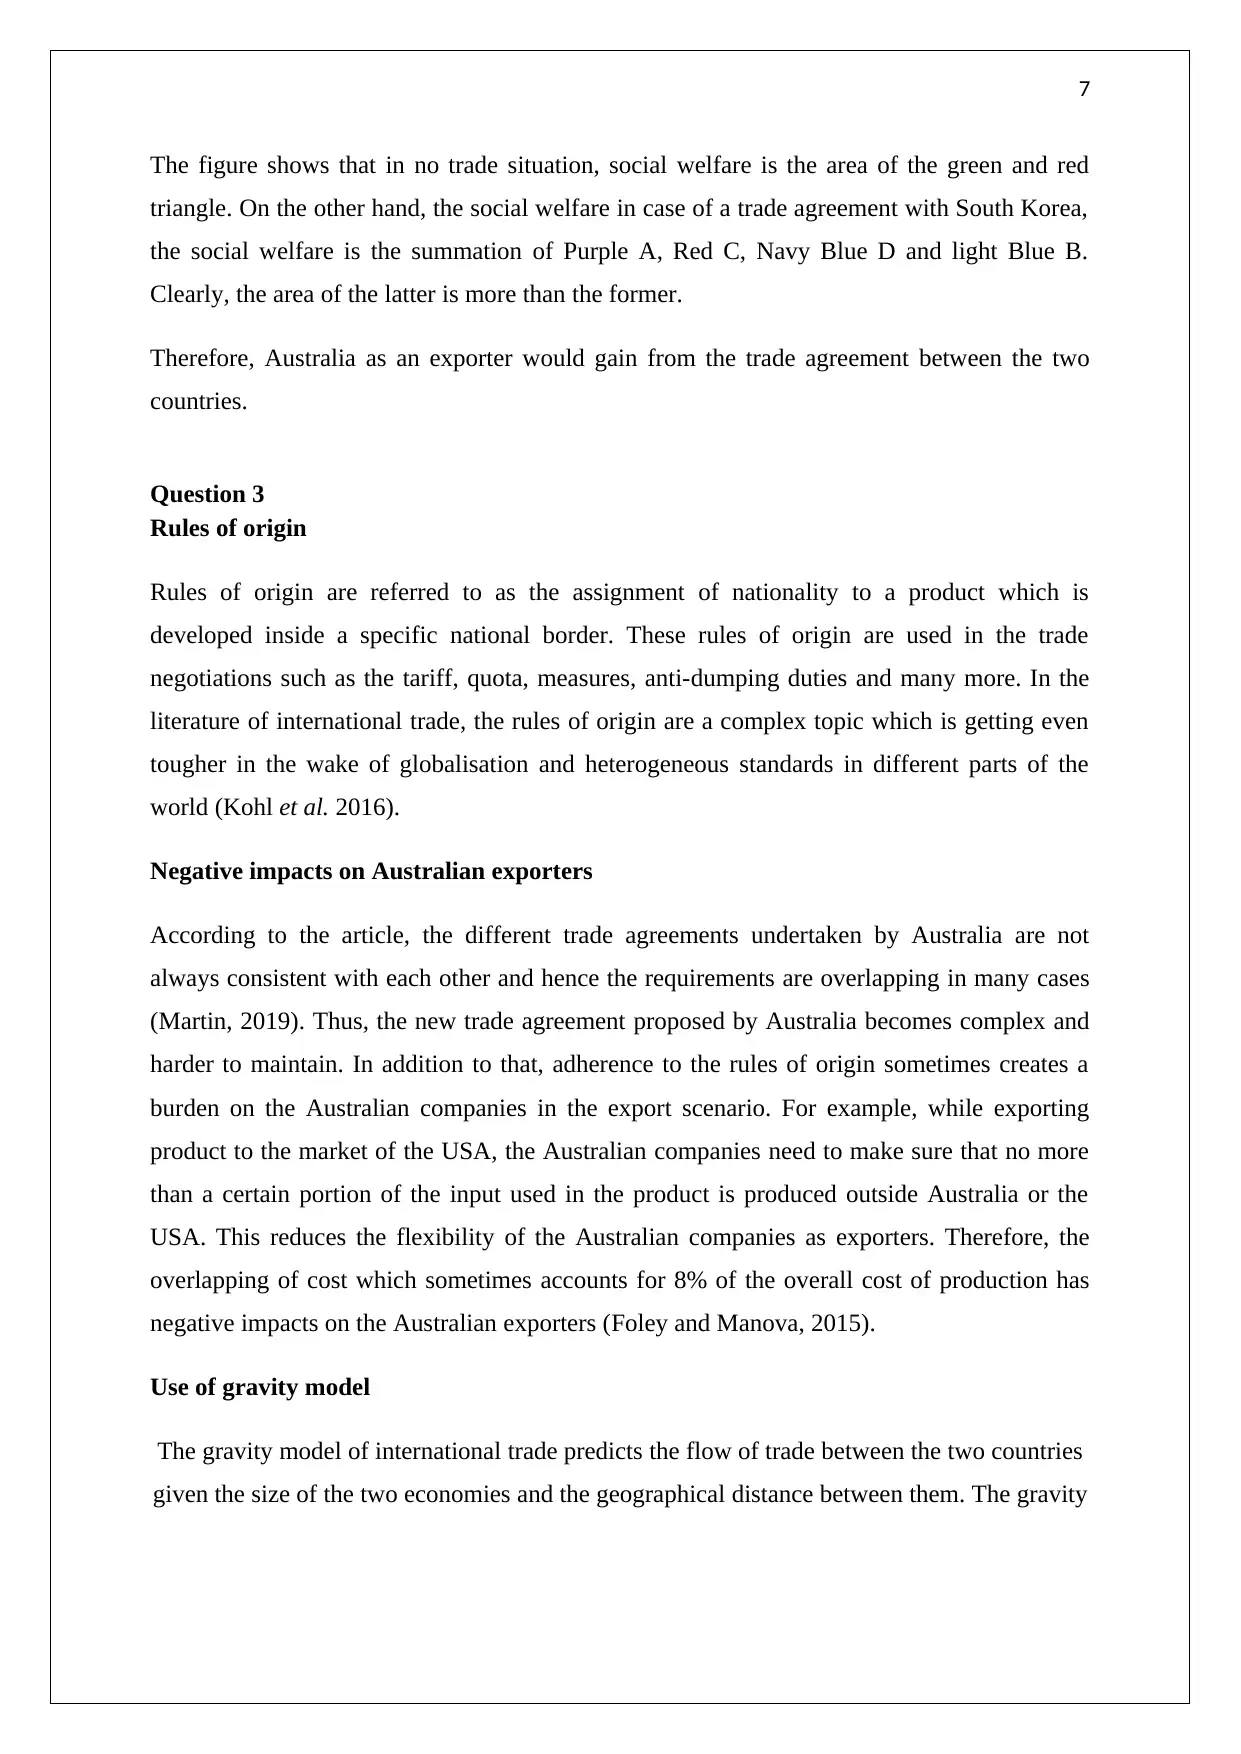
model of trade also determines the effectiveness of the trade model as well.
In this case, the gravity model can be used to explain the adverse effects on the Australian
exporters and the trade relationship in general (Gervais, 2015). Most of the trade partners of
Australia are far away and hence that reduces the trade flow according to that model. It needs
to be noted that, Australia's trade with New Zealand has been successful and effective in
terms of the trade balance. However, in the case of the USA and Thailand, we have seen that
trade balance for Australia as disrupted. Therefore, to a large extent, the model of gravity can
be used to explain the complexity faced by Australian exporters.
Question 4
Change demand and supply due to FTA with New Zealand
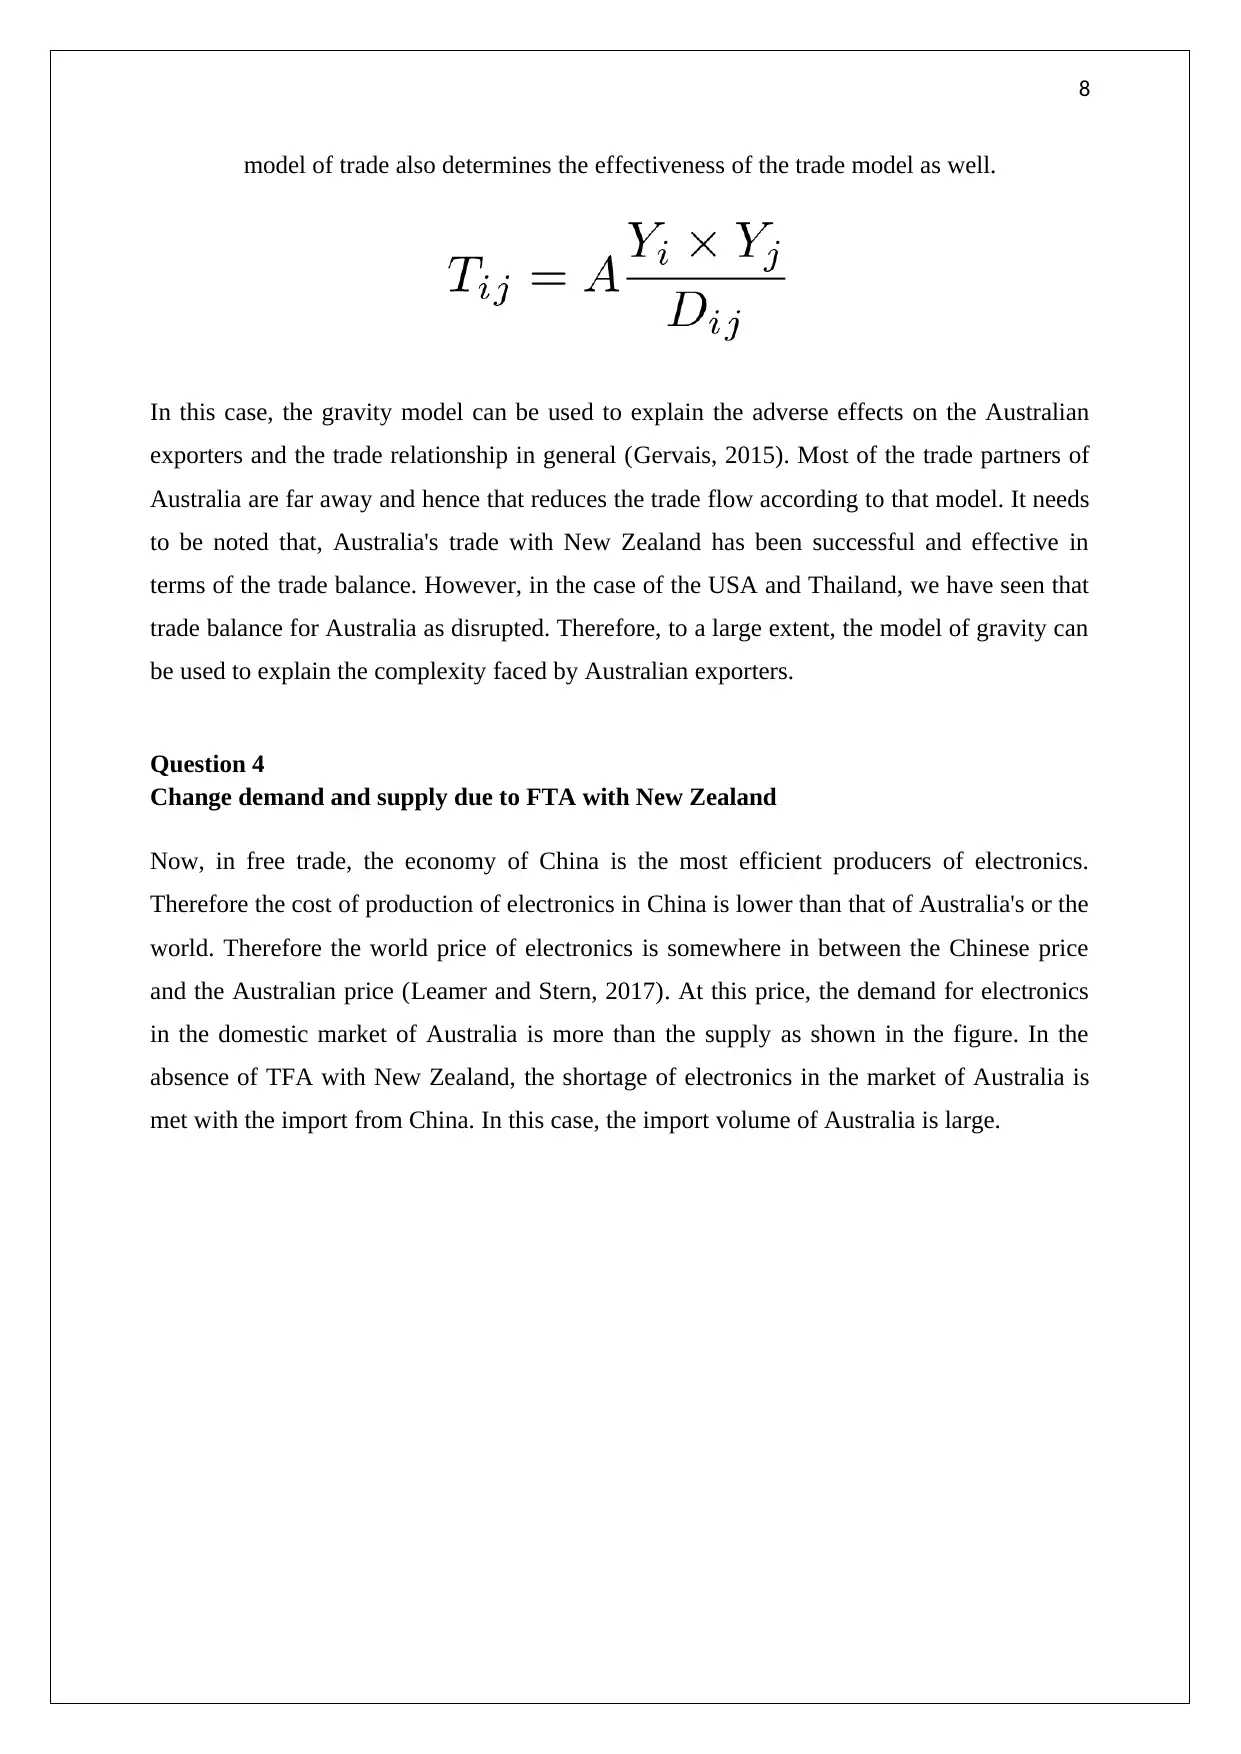
Now, in free trade, the economy of China is the most efficient producers of electronics.
Therefore the cost of production of electronics in China is lower than that of Australia's or the
world. Therefore the world price of electronics is somewhere in between the Chinese price
and the Australian price (Leamer and Stern, 2017). At this price, the demand for electronics
in the domestic market of Australia is more than the supply as shown in the figure. In the
absence of TFA with New Zealand, the shortage of electronics in the market of Australia is
met with the import from China. In this case, the import volume of Australia is large.
model of trade also determines the effectiveness of the trade model as well.
In this case, the gravity model can be used to explain the adverse effects on the Australian
exporters and the trade relationship in general (Gervais, 2015). Most of the trade partners of
Australia are far away and hence that reduces the trade flow according to that model. It needs
to be noted that, Australia's trade with New Zealand has been successful and effective in
terms of the trade balance. However, in the case of the USA and Thailand, we have seen that
trade balance for Australia as disrupted. Therefore, to a large extent, the model of gravity can
be used to explain the complexity faced by Australian exporters.
Question 4
Change demand and supply due to FTA with New Zealand
Now, in free trade, the economy of China is the most efficient producers of electronics.
Therefore the cost of production of electronics in China is lower than that of Australia's or the
world. Therefore the world price of electronics is somewhere in between the Chinese price
and the Australian price (Leamer and Stern, 2017). At this price, the demand for electronics
in the domestic market of Australia is more than the supply as shown in the figure. In the
absence of TFA with New Zealand, the shortage of electronics in the market of Australia is
met with the import from China. In this case, the import volume of Australia is large.
9
Figure 5: Before and after demand-supply for electronics
(Source: Edmond et al. 2015)
Now if the government of Australia creates FTA with New Zealand, the price at which it
imports will increase than the world price (Price of china less than the price of New Zealand).
It has been shown as Pw in the second figure. At this price, the shortage of electronics in the
market would be lower than that of the previous case. Therefore the supply curve would shift
to the right as the sellers from the market of New Zealand would be able to sell in the market
of Australia. Therefore the new equilibrium will be at a point where the price is lower and the
quantity sold is more than the previous case.
⊘ This is a preview!⊘
Do you want full access?
Subscribe today to unlock all pages.
Trusted by 1+ million students worldwide
10
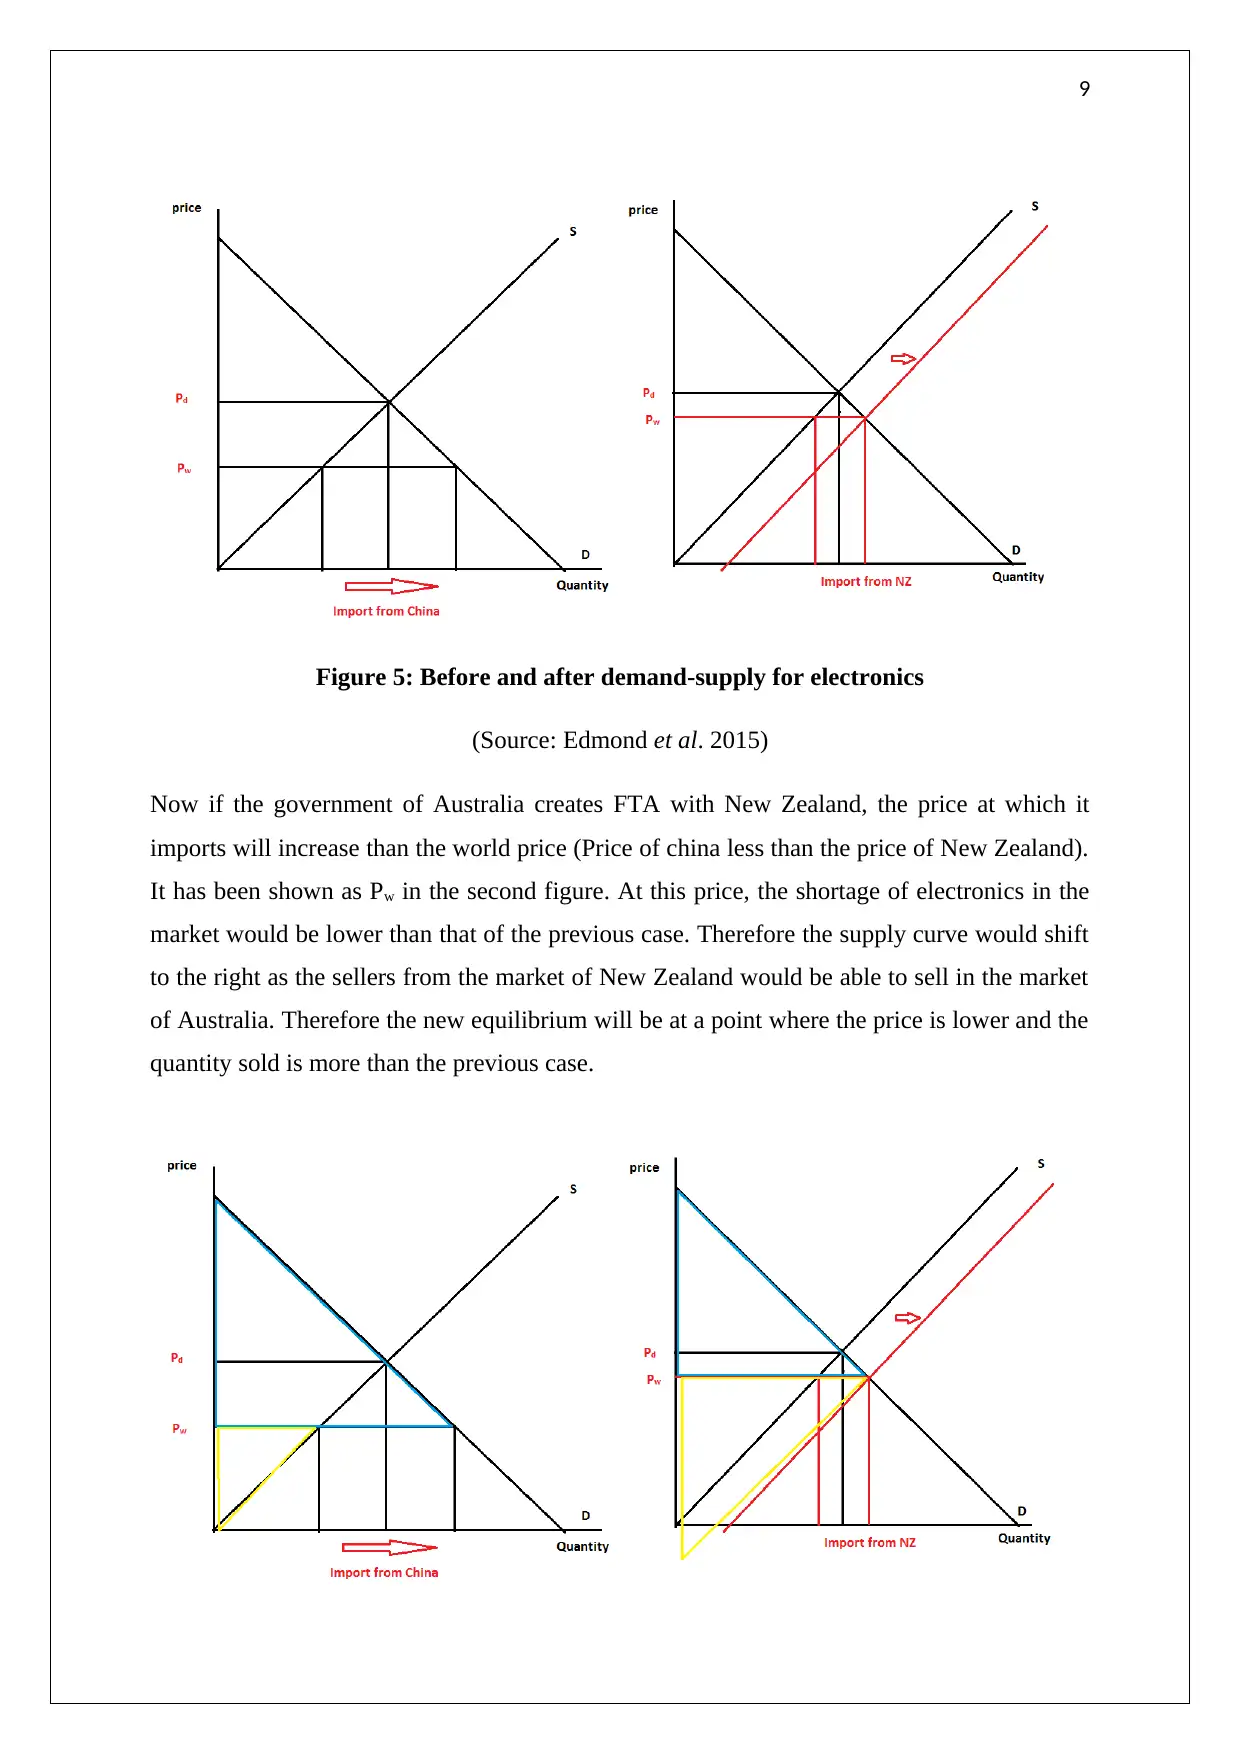
Figure 6: The changes in the surplus if FTA is withdrawn
(Source: Laursen, 2015)
Now if the government of Australia decides to get out of the FTA with New Zealand, the
consumer's surplus would increase as they would be able to buy it from the world market at
lower prices than New Zealand. Apart from that, the Australian producers would lose their
surplus, as can be seen from the shrinking size of the yellow triangle. However, if the
government gets out of the FTA with New Zealand, the import volume of Australia will
increase and therefore for the Australian producers this is not a favourable condition (Chaney,
2018). If the government goes back to the no FTA situation the income of the government
would also rise as the import volume would rise.
Paraphrase This Document
Need a fresh take? Get an instant paraphrase of this document with our AI Paraphraser
11
Reference
Abidin, I.S.Z., Haseeb, M., Azam, M. and Islam, R., 2015. Foreign direct investment,
financial Development, international trade and energy consumption: Panel data evidence
from selected ASEAN Countries. International Journal of Energy Economics and
Policy, 5(3), pp.841-850.
Chaney, T., 2018. The gravity equation in international trade: An explanation. Journal of
Political Economy, 126(1), pp.150-177.
Edmond, C., Midrigan, V. and Xu, D.Y., 2015. Competition, markups, and the gains from
international trade. American Economic Review, 105(10), pp.3183-3221.
Foley, C.F. and Manova, K., 2015. International trade, multinational activity, and corporate
finance. economics, 7(1), pp.119-146.
Gervais, A., 2015. Product quality and firm heterogeneity in international trade. Canadian
Journal of Economics/Revue canadienne d'économique, 48(3), pp.1152-1174.
Jones, R.W. and Kierzkowski, H., 2018. The role of services in production and international
trade: A theoretical framework. World Scientific Book Chapters, pp.233-253.
Kohl, T., Brakman, S. and Garretsen, H., 2016. Do trade agreements stimulate international
trade differently? Evidence from 296 trade agreements. The World Economy, 39(1), pp.97-
131.
Laursen, K., 2015. Revealed comparative advantage and the alternatives as measures of
international specialization. Eurasian Business Review, 5(1), pp.99-115.
Leamer, E.E. and Stern, R.M., 2017. Quantitative international economics. Routledge.
Martin, P. (2019). The election campaign's other big lie: the Coalition hasn't delivered 'export
agreements'. [online] The Sydney Morning Herald. Available at:
https://www.smh.com.au/opinion/the-elections-other-big-lie-the-coalition-hasnt-delivered-
export-agreements-20160706-gpzcx3.html [Accessed 6 Sep. 2019].
Rivera-Batiz, F.L. and Rivera-Batiz, L.A., 2018. The economics of technological progress
and endogenous growth in open economies. World Scientific Book Chapters, pp.105-138.
12
Swinnen, J., 2016. Economics and politics of food standards, trade, and
development#. Agricultural Economics, 47(S1), pp.7-19.
Swinnen, J., 2016. Economics and politics of food standards, trade, and
development#. Agricultural Economics, 47(S1), pp.7-19.
⊘ This is a preview!⊘
Do you want full access?
Subscribe today to unlock all pages.
Trusted by 1+ million students worldwide
1 out of 12
Related Documents


Your All-in-One AI-Powered Toolkit for Academic Success.
+13062052269
info@desklib.com
Available 24*7 on WhatsApp / Email
![[object Object]](/_next/static/media/star-bottom.7253800d.svg)
Unlock your academic potential
Copyright © 2020–2026 A2Z Services. All Rights Reserved. Developed and managed by ZUCOL.