International Trade (ECON 1086/1269/1089) Assignment 2 Analysis

Verified

Added on  2022/10/19

|8
|1086
|19
Homework Assignment
AI Summary
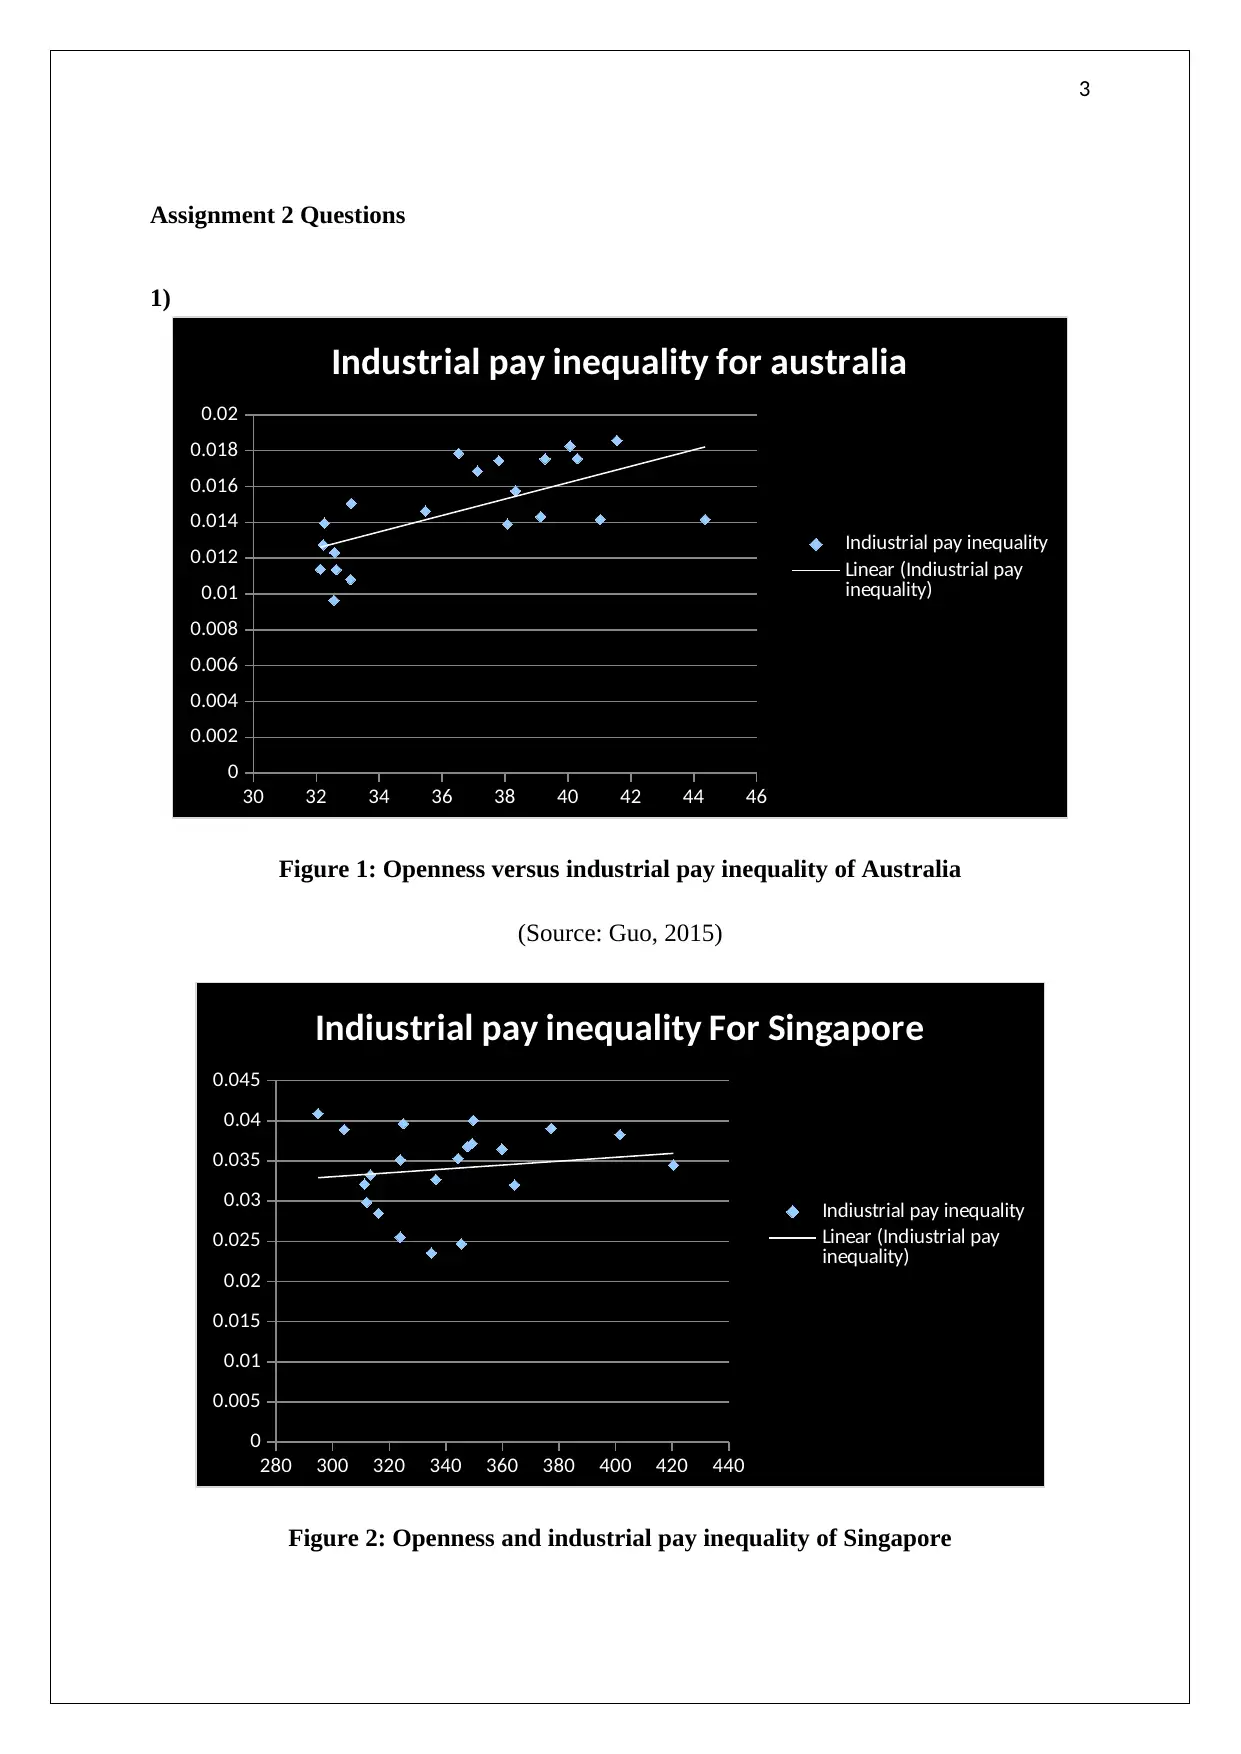
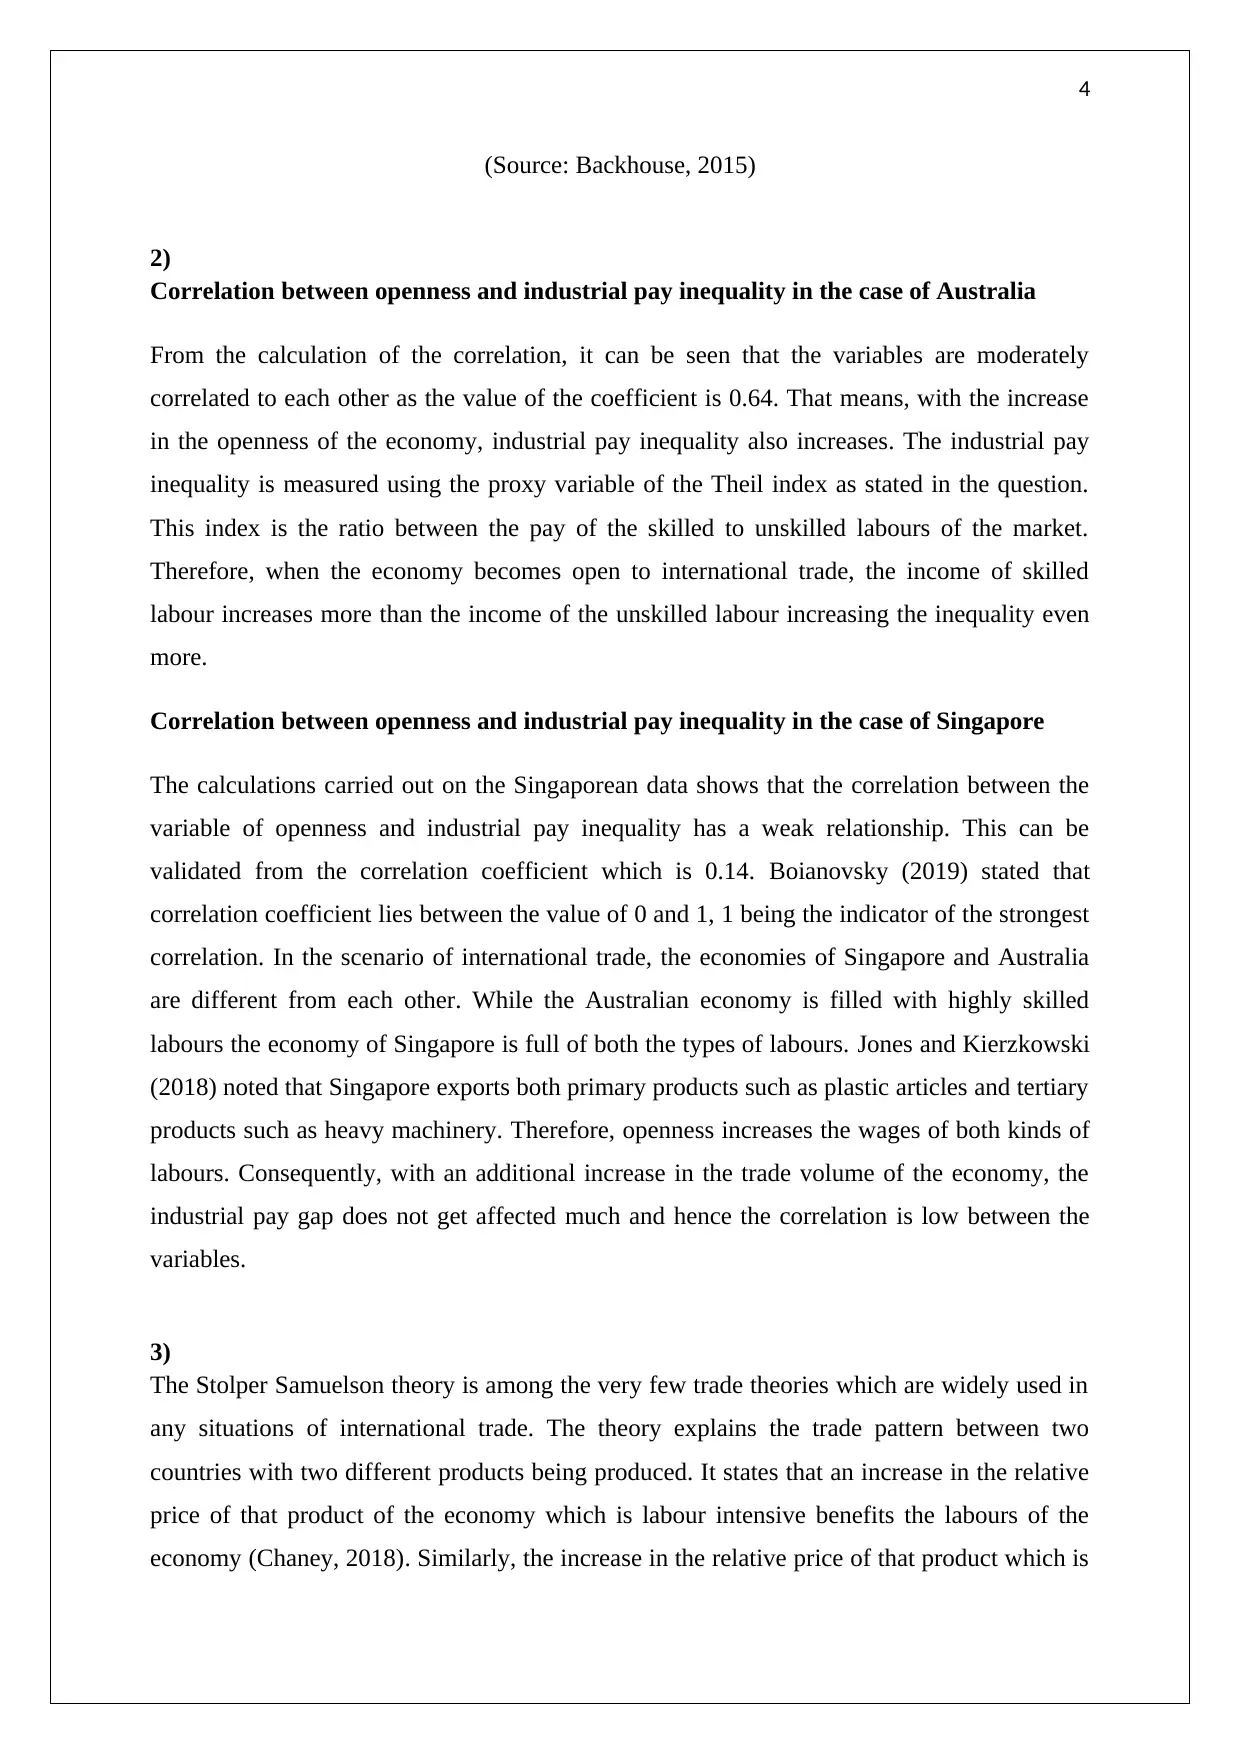
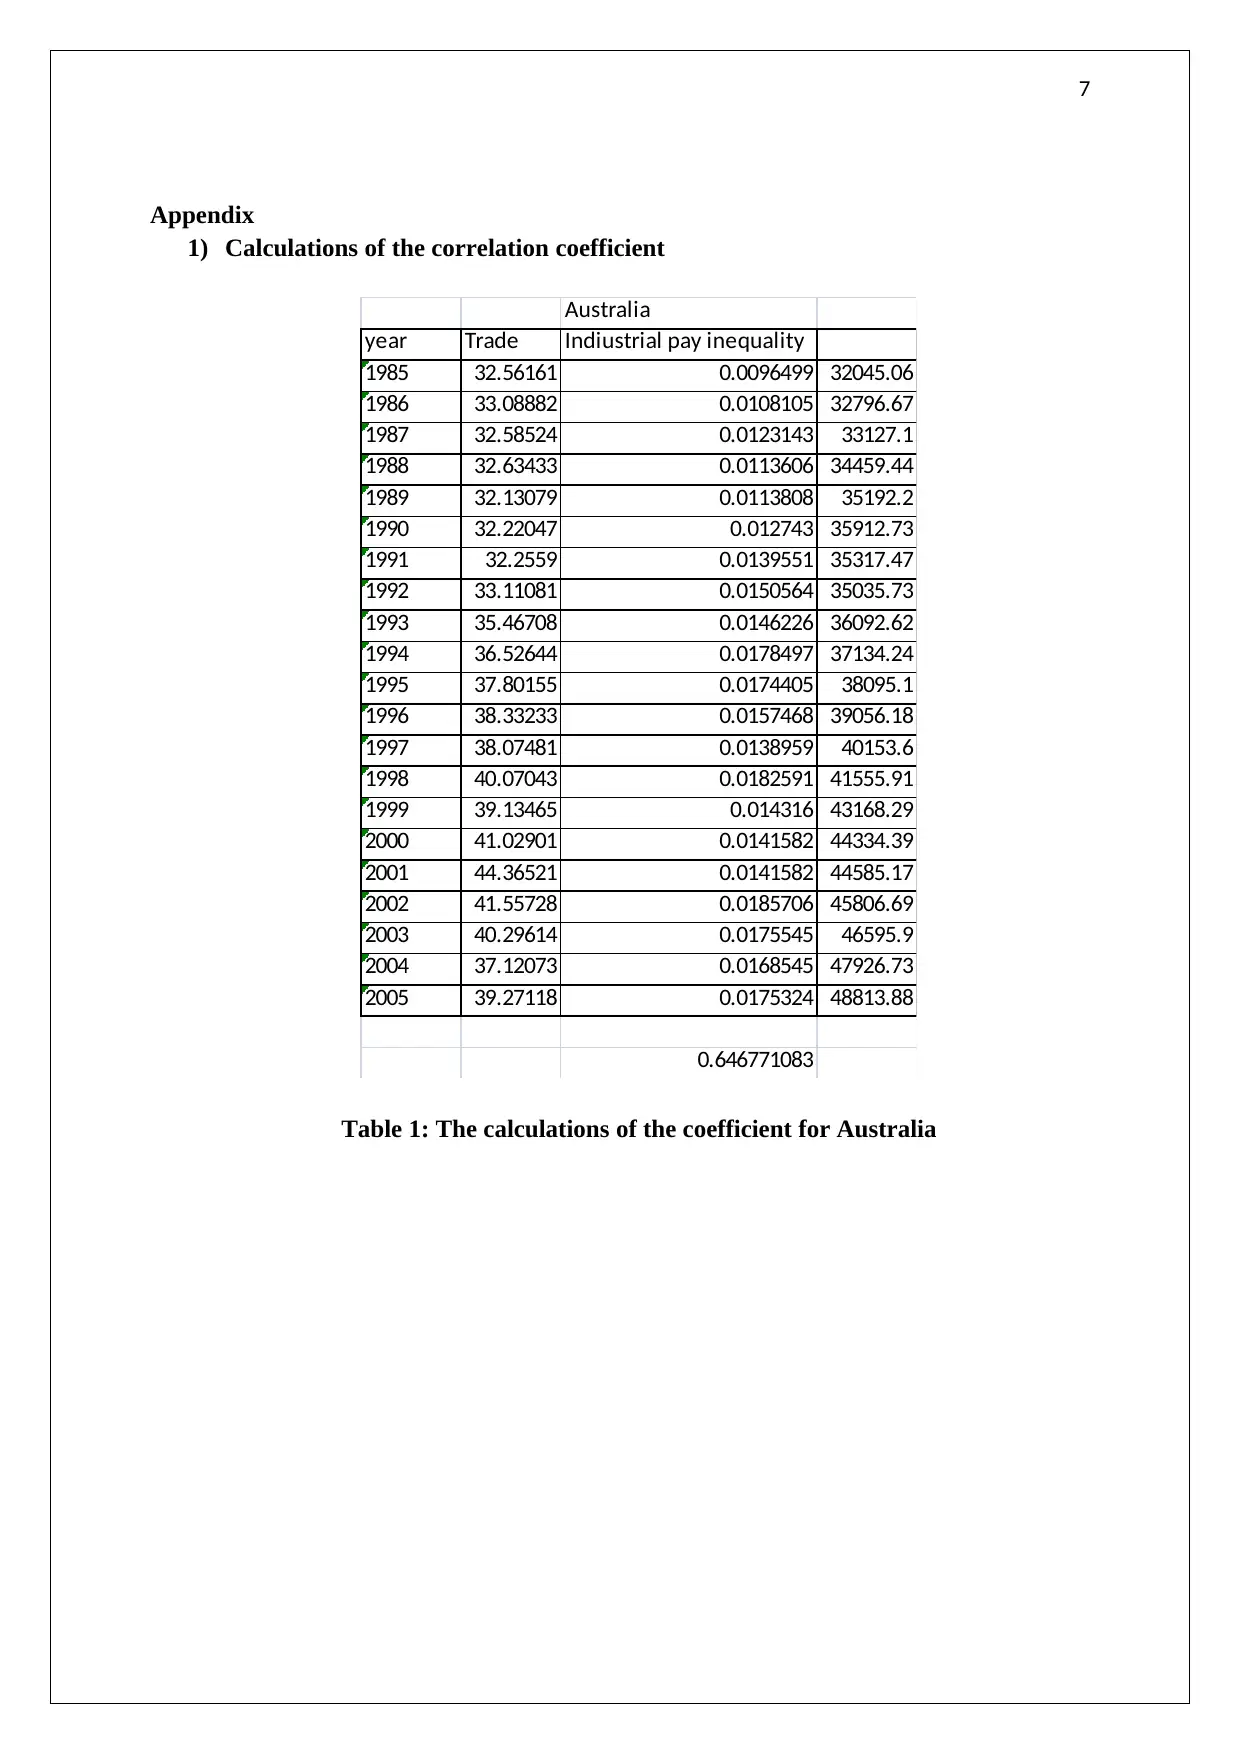
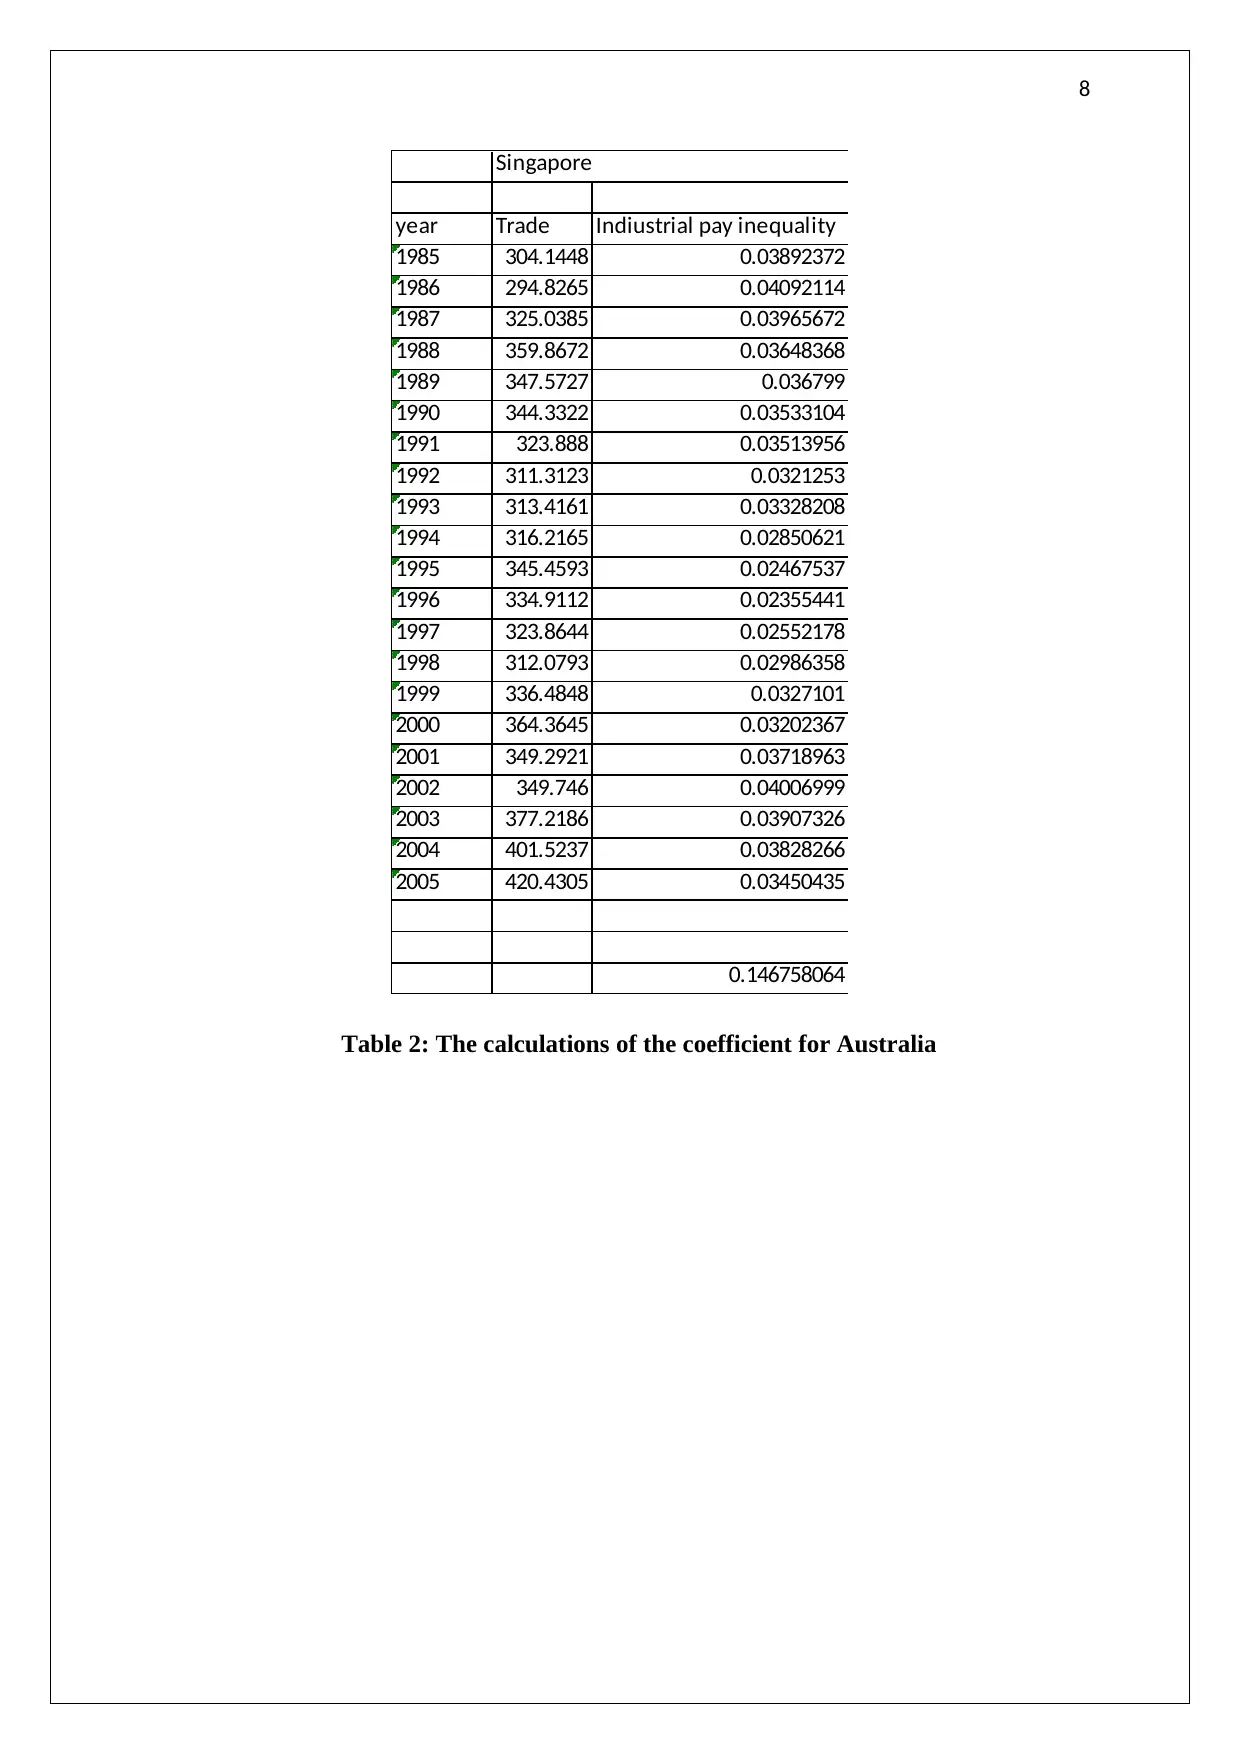
This economics assignment analyzes the relationship between international trade, economic openness, and industrial pay inequality, focusing on Australia and Singapore. The assignment begins by calculating the correlation between economic openness and industrial pay inequality in both countries, using data from 1985-2005. The analysis reveals a moderate positive correlation in Australia, indicating that increased openness is associated with rising pay inequality. Conversely, Singapore shows a weak correlation, suggesting that openness has a less pronounced effect on the pay gap. The assignment then applies the Stolper-Samuelson theory to explain these different outcomes, arguing that Australia's high-skilled labor force benefits more from openness, widening the pay gap, while Singapore's diverse economy experiences more balanced wage increases. The assignment draws on various economic sources and data to support its conclusions, providing a comprehensive understanding of the effects of international trade on labor markets.
tabler-icon-diamond-filled.svg

Contribute Materials

Your contribution can guide someone’s learning journey. Share your documents today.
Document Page
1
ECONOMICS ASSIGNMENT
INTERNATIONAL TRADE
tabler-icon-diamond-filled.svg

Secure Best Marks with AI Grader

Need help grading? Try our AI Grader for instant feedback on your assignments.
Document Page
2
Contents
Assignment 2 Questions.............................................................................................................3
1)................................................................................................................................................3
2)................................................................................................................................................4
3)................................................................................................................................................4
Reference....................................................................................................................................6
Appendix....................................................................................................................................7
Document Page
3
Assignment 2 Questions
1)
30 32 34 36 38 40 42 44 46
0
0.002
0.004
0.006
0.008
0.01
0.012
0.014
0.016
0.018
0.02
Industrial pay inequality for australia
Indiustrial pay inequality
Linear (Indiustrial pay
inequality)
Figure 1: Openness versus industrial pay inequality of Australia
(Source: Guo, 2015)
280 300 320 340 360 380 400 420 440
0
0.005
0.01
0.015
0.02
0.025
0.03
0.035
0.04
0.045
Indiustrial pay inequality For Singapore
Indiustrial pay inequality
Linear (Indiustrial pay
inequality)
Figure 2: Openness and industrial pay inequality of Singapore
Document Page
4
(Source: Backhouse, 2015)
2)
Correlation between openness and industrial pay inequality in the case of Australia
From the calculation of the correlation, it can be seen that the variables are moderately
correlated to each other as the value of the coefficient is 0.64. That means, with the increase
in the openness of the economy, industrial pay inequality also increases. The industrial pay
inequality is measured using the proxy variable of the Theil index as stated in the question.
This index is the ratio between the pay of the skilled to unskilled labours of the market.
Therefore, when the economy becomes open to international trade, the income of skilled
labour increases more than the income of the unskilled labour increasing the inequality even
more.
Correlation between openness and industrial pay inequality in the case of Singapore
The calculations carried out on the Singaporean data shows that the correlation between the
variable of openness and industrial pay inequality has a weak relationship. This can be
validated from the correlation coefficient which is 0.14. Boianovsky (2019) stated that
correlation coefficient lies between the value of 0 and 1, 1 being the indicator of the strongest
correlation. In the scenario of international trade, the economies of Singapore and Australia
are different from each other. While the Australian economy is filled with highly skilled
labours the economy of Singapore is full of both the types of labours. Jones and Kierzkowski
(2018) noted that Singapore exports both primary products such as plastic articles and tertiary
products such as heavy machinery. Therefore, openness increases the wages of both kinds of
labours. Consequently, with an additional increase in the trade volume of the economy, the
industrial pay gap does not get affected much and hence the correlation is low between the
variables.
3)
The Stolper Samuelson theory is among the very few trade theories which are widely used in
any situations of international trade. The theory explains the trade pattern between two
countries with two different products being produced. It states that an increase in the relative
price of that product of the economy which is labour intensive benefits the labours of the
economy (Chaney, 2018). Similarly, the increase in the relative price of that product which is
tabler-icon-diamond-filled.svg

Secure Best Marks with AI Grader

Need help grading? Try our AI Grader for instant feedback on your assignments.
Document Page
5
capital intensive increases the return of the investors of the market. This theory applies to the
case in hand where two different countries are trade partners of each other.
The data of the two countries agree with the theory of Stolper Samuelson as the impact of
openness influences the income of the skilled and the unskilled labours of the market in a
different way. In the case of Australia which is enriched with high skilled labours experiences
an increased pay gap between skilled and unskilled labours as the economy opens further. As
the economy of Australia opens that means as the foreign investors of the global market start
investing in the markets of Australia, skilled labours get more and more capital to work with.
Therefore their productivity increases with the openness of the economy leading to an
increase in wages. In addition to that, the demand for skilled labours also increases as foreign
investors increase capital infusion into the economy of Australia (Neary, 2016). It needs to be
noted that openness of the economy does not create added opportunities for the low skilled
labours of the market-leading to stagnant productivity and wage. Therefore, the Stolper
Samuelson theory has almost accurately predicted the trade pattern and its impacts on the
industrial pay gap in the case of Australia.
Singapore, on the other hand, shows that the openness of the economy does not influence the
industrial pay gap between the unskilled and skilled labours of the market. Singapore, unlike
that of Australia, is an exporter of both primary and tertiary products. Therefore the openness
has increased the demand for both the goods. For example, with the liberalisation of the
Singaporean economy, it experienced increased demand for both plastic articles and heavy
machinery (Jones and Kierzkowski, 2018). In this case, the wage of both the skilled and the
unskilled labours of the market have increased almost at the same rate. Not only the increased
demand for the export goods of the Singaporean market, but it has also experienced a huge
increase in the FDI inflow in both the types of industry as well. Consequently, the openness
of the economy and the increase in the trade volume failed to widen the gap between the
unskilled and the skilled labours of the economy. The Singaporean economy has exported
products intensive in both skilled and unskilled labours and hence the Stolper Samuelsson
theory also applies in the case of Singapore as well.
Document Page
6
Reference
Backhouse, R.E., 2015. Revisiting Samuelson's Foundations of Economic Analysis. Journal
of Economic Literature, 53(2), pp.326-50.
Boianovsky, M., 2019. Reacting to Samuelson: Early development economics and the factor-
price equalization theorem, pp.14-27.
Chaney, T., 2018. The gravity equation in international trade: An explanation. Journal of
Political Economy, 126(1), pp.150-177.
Guo, B., 2015. Equilibrium Price and Generalized Stolper-Samuelson Theorem and
Generalized Rybczynski Theorem. Available at SSRN 2635216.
Jones, R.W. and Kierzkowski, H., 2018. The role of services in production and international
trade: A theoretical framework. World Scientific Book Chapters, pp.233-253.
Neary, J.P., 2016. International trade in general oligopolistic equilibrium. Review of
International Economics, 24(4), pp.669-698.
Document Page
7
Appendix
1) Calculations of the correlation coefficient
Australia
year Trade Indiustrial pay inequality
1985 32.56161 0.0096499 32045.06
1986 33.08882 0.0108105 32796.67
1987 32.58524 0.0123143 33127.1
1988 32.63433 0.0113606 34459.44
1989 32.13079 0.0113808 35192.2
1990 32.22047 0.012743 35912.73
1991 32.2559 0.0139551 35317.47
1992 33.11081 0.0150564 35035.73
1993 35.46708 0.0146226 36092.62
1994 36.52644 0.0178497 37134.24
1995 37.80155 0.0174405 38095.1
1996 38.33233 0.0157468 39056.18
1997 38.07481 0.0138959 40153.6
1998 40.07043 0.0182591 41555.91
1999 39.13465 0.014316 43168.29
2000 41.02901 0.0141582 44334.39
2001 44.36521 0.0141582 44585.17
2002 41.55728 0.0185706 45806.69
2003 40.29614 0.0175545 46595.9
2004 37.12073 0.0168545 47926.73
2005 39.27118 0.0175324 48813.88
0.646771083
Table 1: The calculations of the coefficient for Australia
tabler-icon-diamond-filled.svg

Paraphrase This Document

Need a fresh take? Get an instant paraphrase of this document with our AI Paraphraser
Document Page
8
Singapore
year Trade Indiustrial pay inequality
1985 304.1448 0.03892372
1986 294.8265 0.04092114
1987 325.0385 0.03965672
1988 359.8672 0.03648368
1989 347.5727 0.036799
1990 344.3322 0.03533104
1991 323.888 0.03513956
1992 311.3123 0.0321253
1993 313.4161 0.03328208
1994 316.2165 0.02850621
1995 345.4593 0.02467537
1996 334.9112 0.02355441
1997 323.8644 0.02552178
1998 312.0793 0.02986358
1999 336.4848 0.0327101
2000 364.3645 0.03202367
2001 349.2921 0.03718963
2002 349.746 0.04006999
2003 377.2186 0.03907326
2004 401.5237 0.03828266
2005 420.4305 0.03450435
0.146758064
Table 2: The calculations of the coefficient for Australia
chevron_up_icon
1 out of 8
circle_padding
hide_on_mobile
zoom_out_icon
logo.png

Your All-in-One AI-Powered Toolkit for Academic Success.

Available 24*7 on WhatsApp / Email

[object Object]