ECON1086 International Trade Analysis: Italy and Sweden Report

Verified

Added on  2022/12/26

|10
|1369
|88
Report
AI Summary
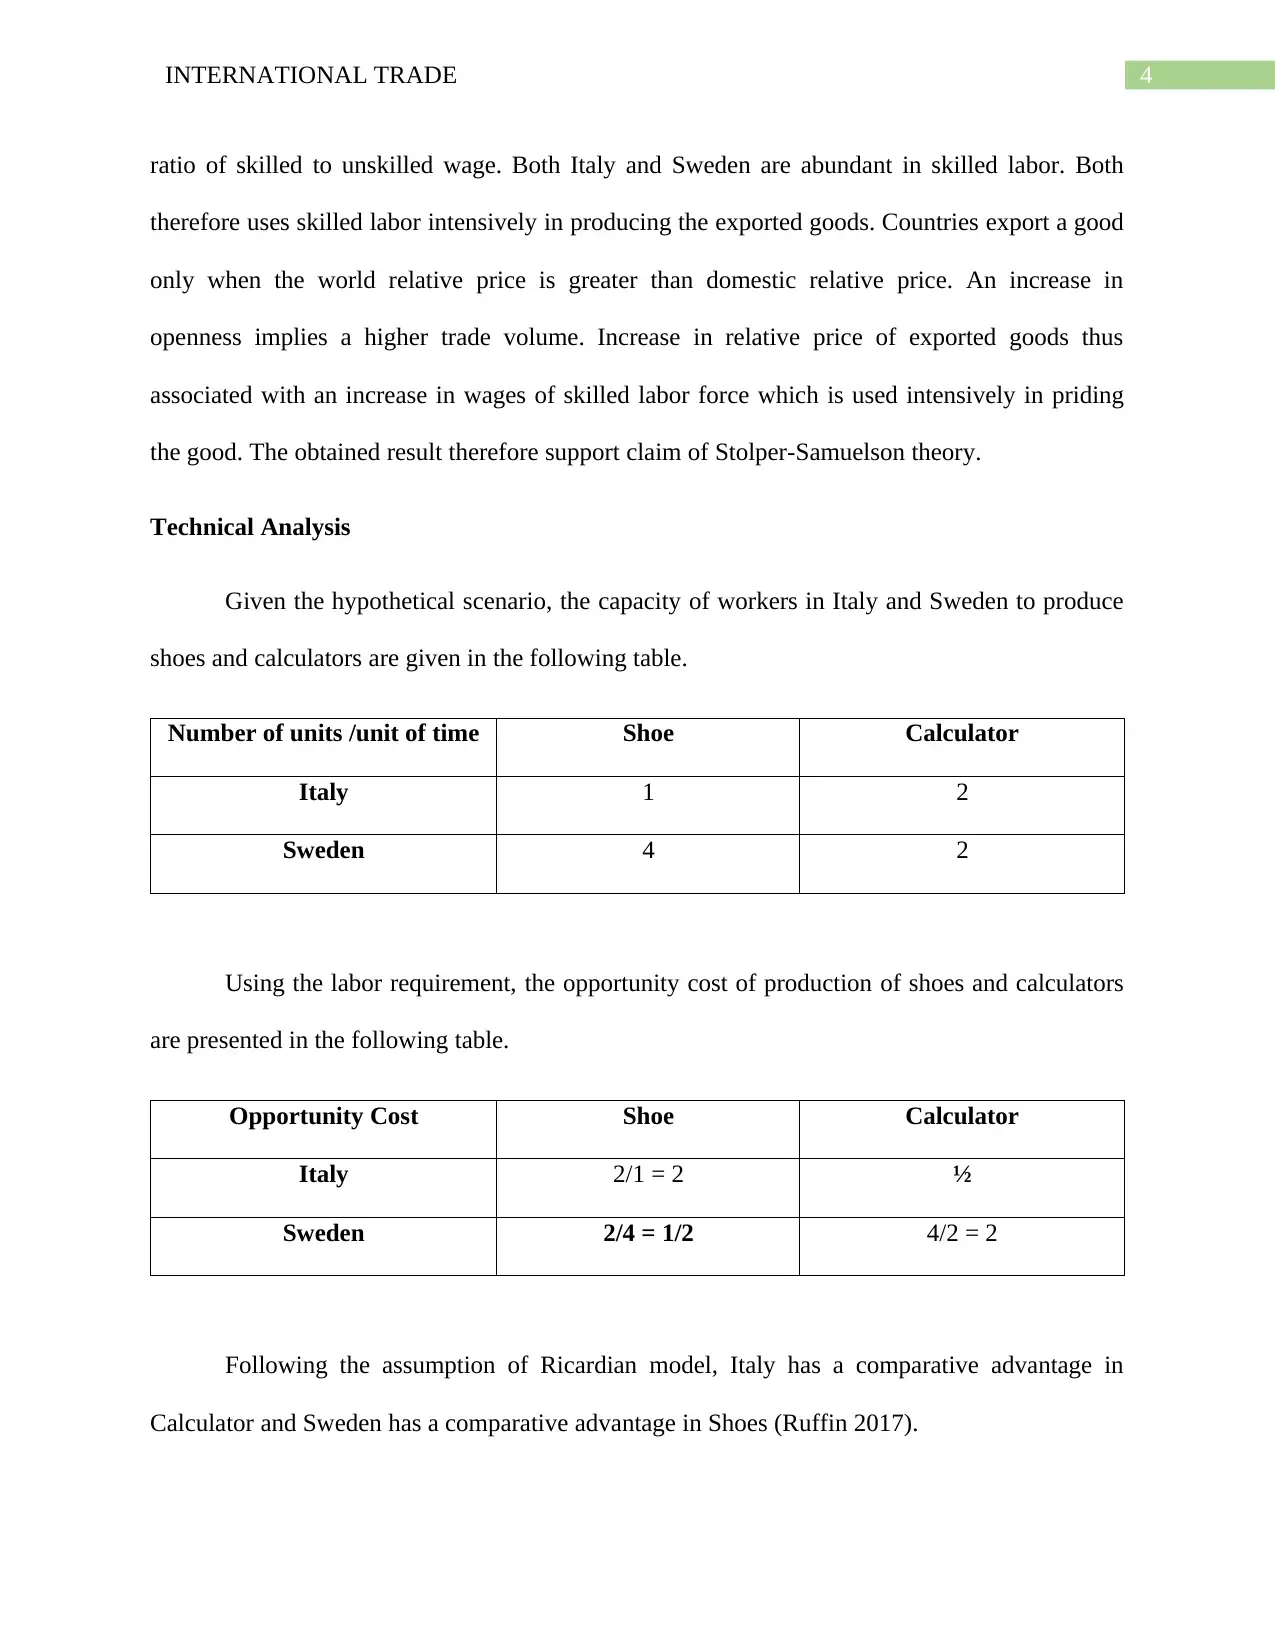
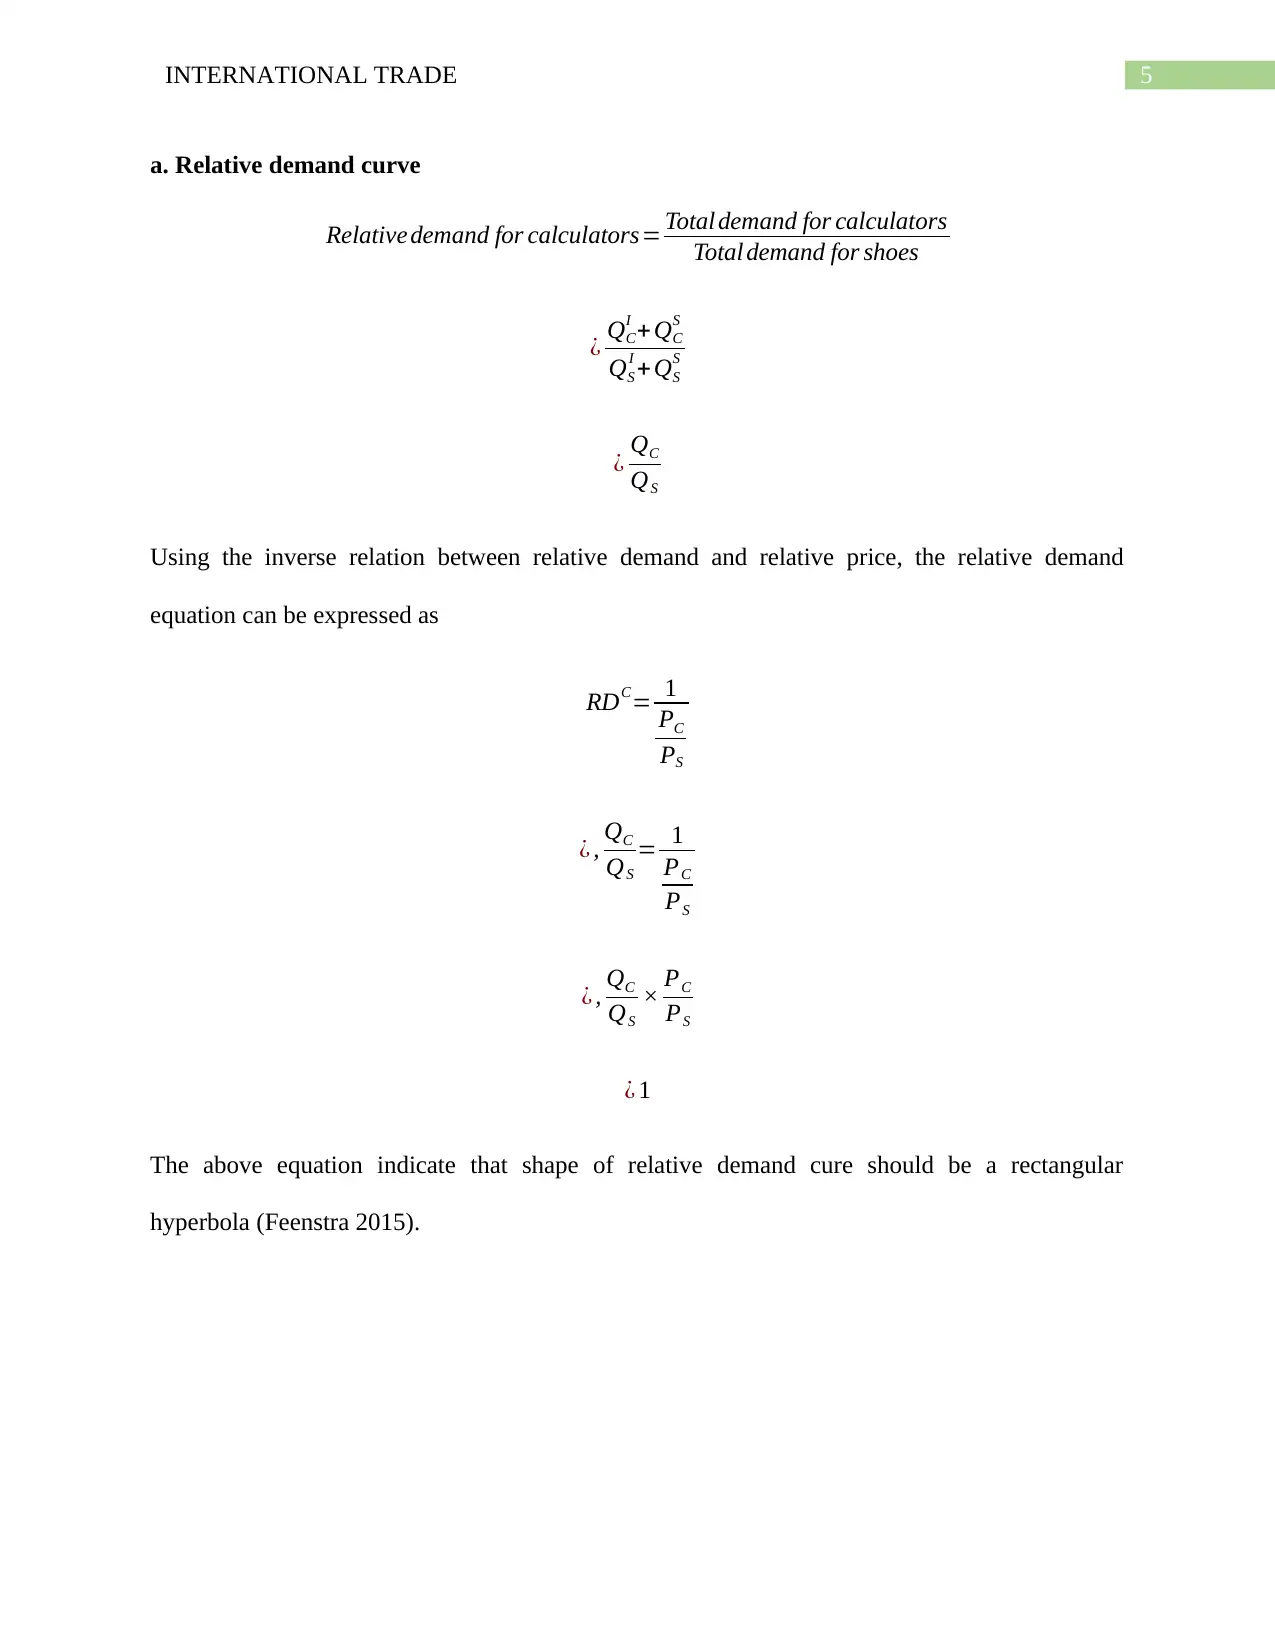
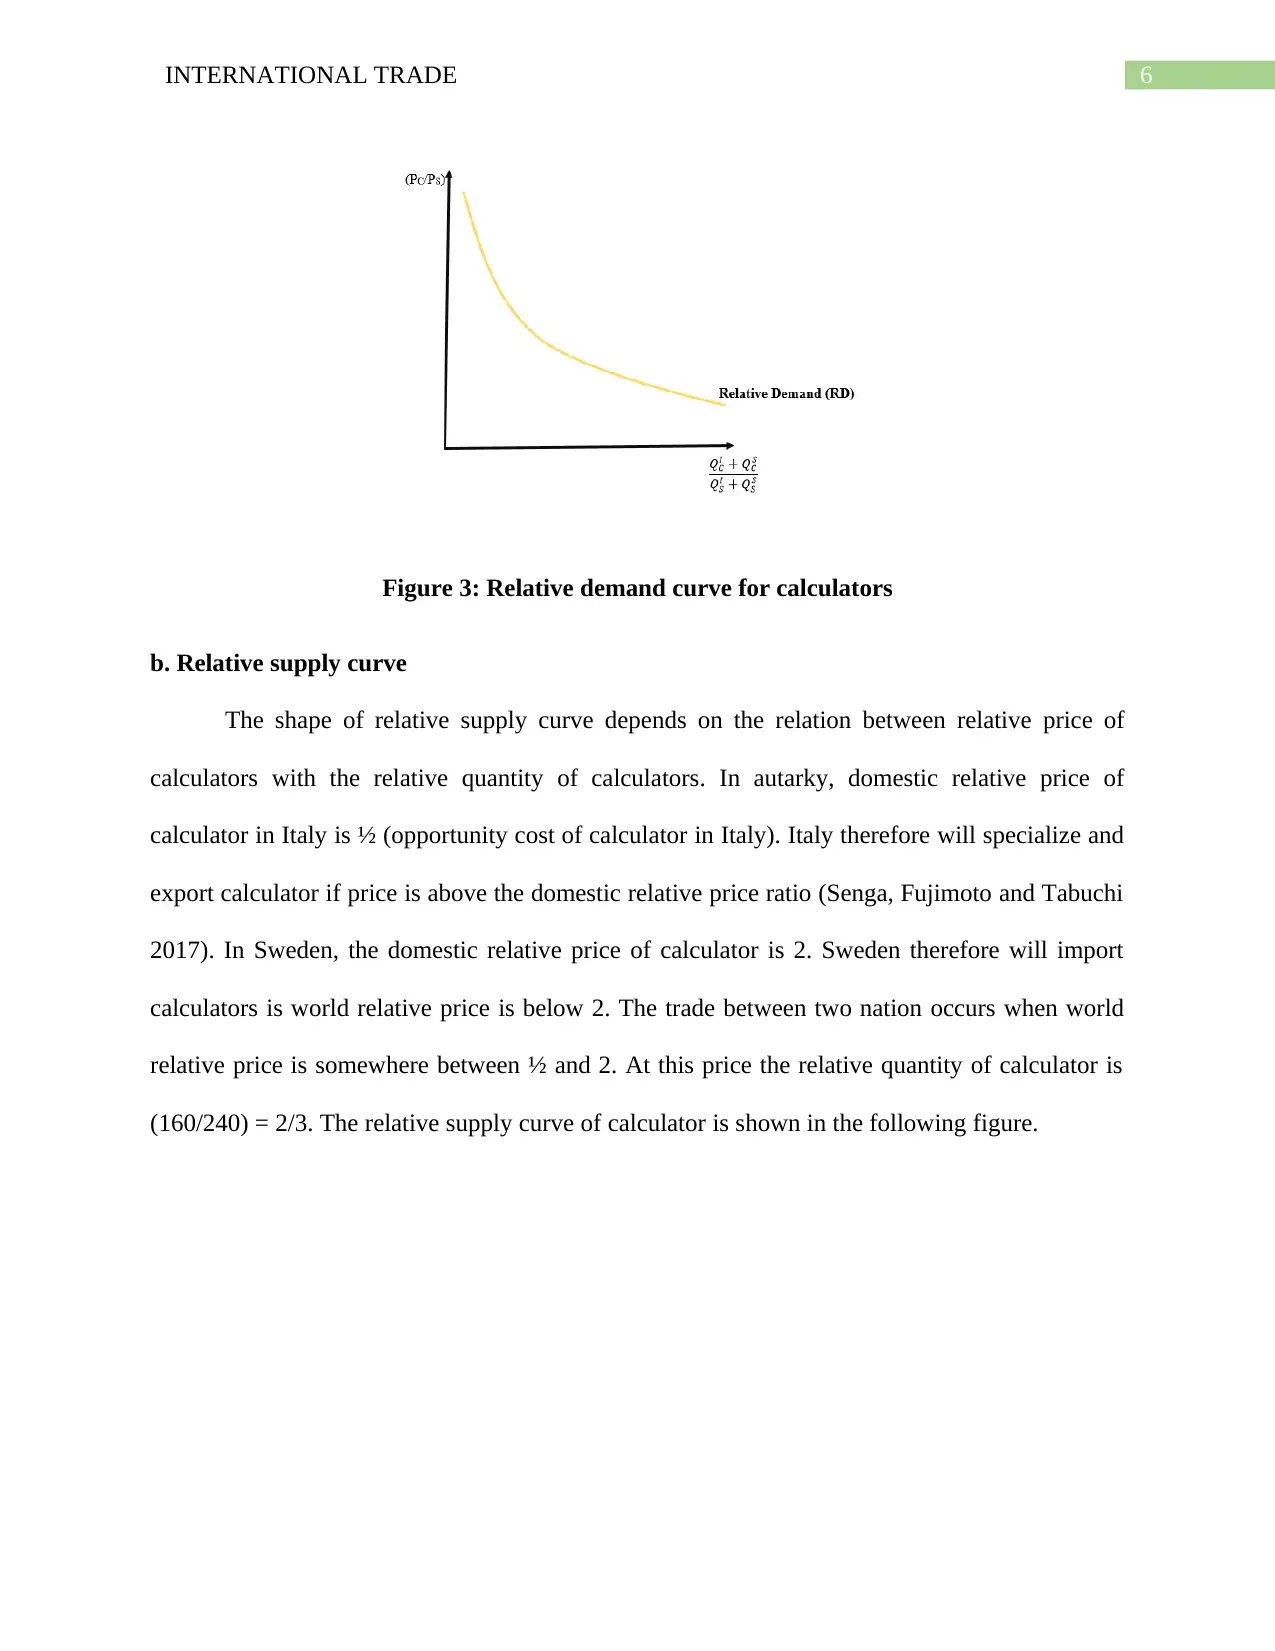
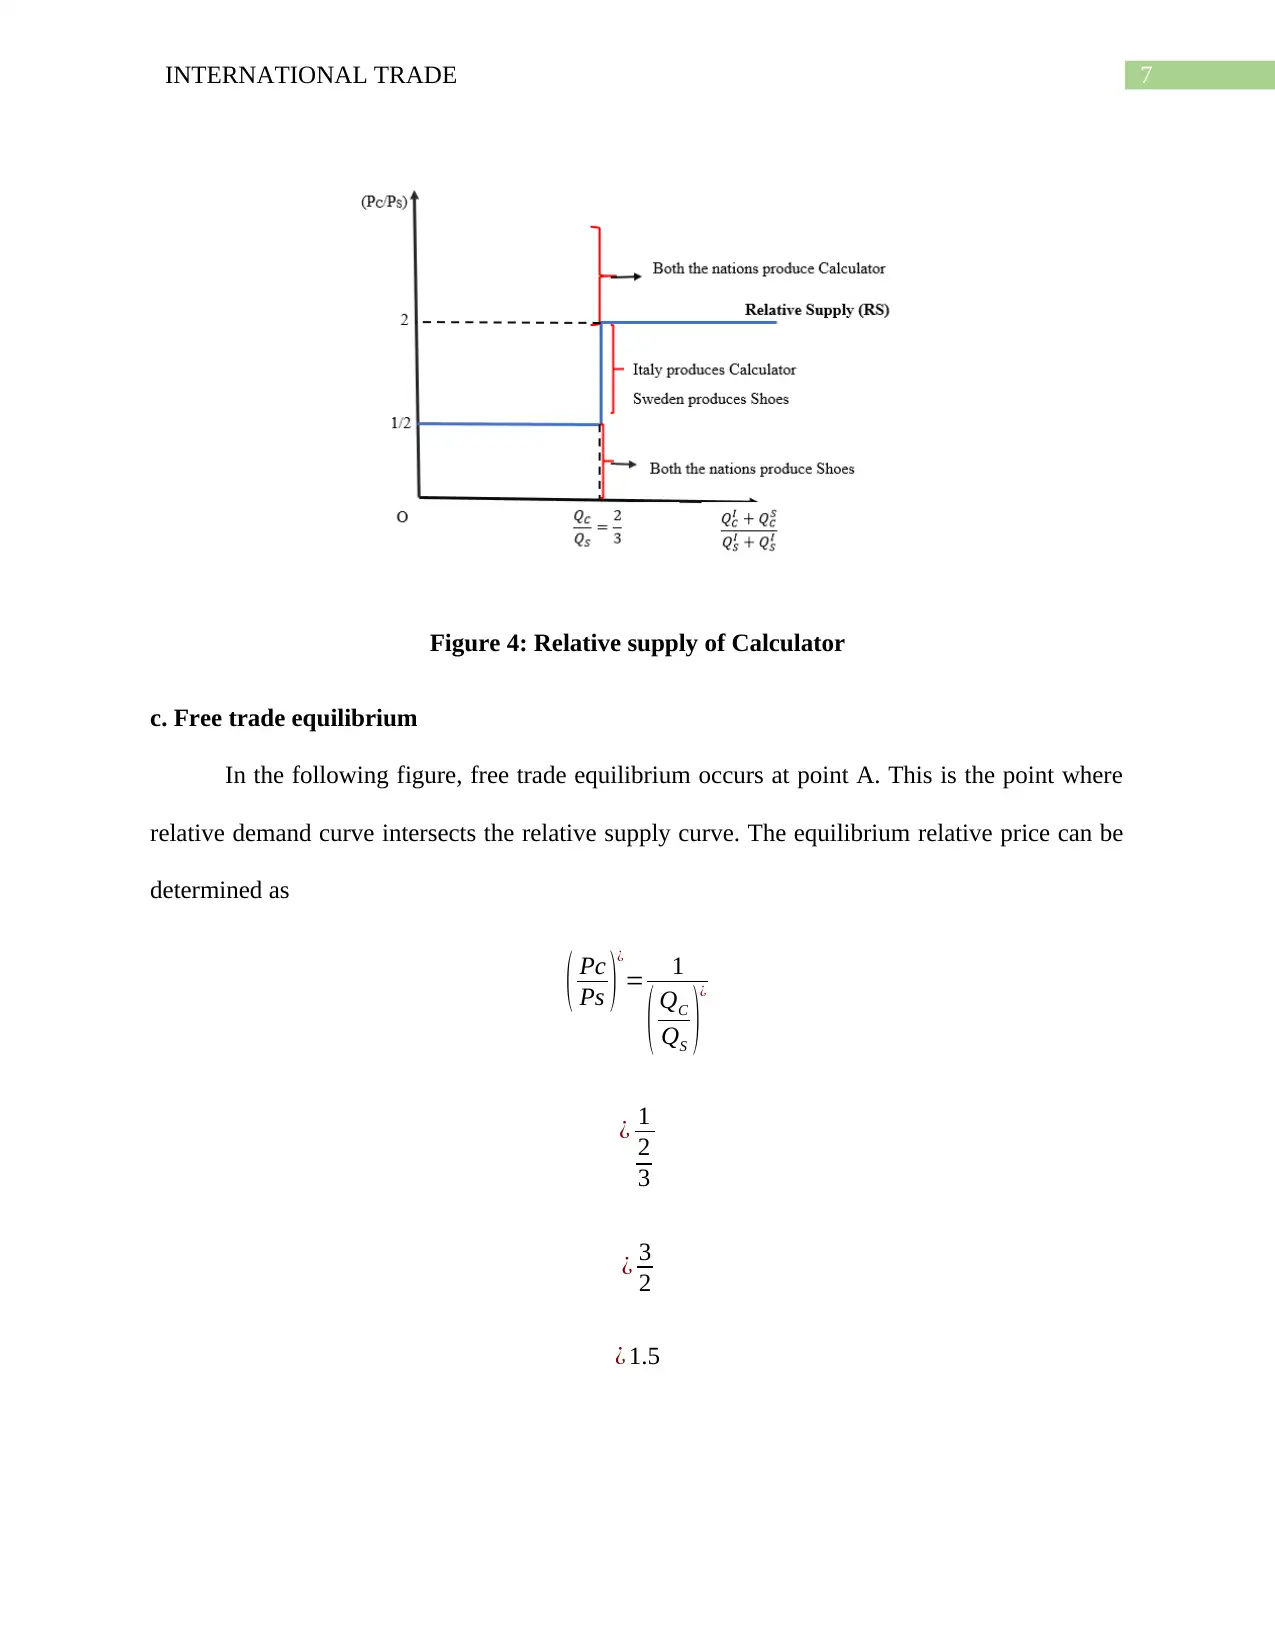
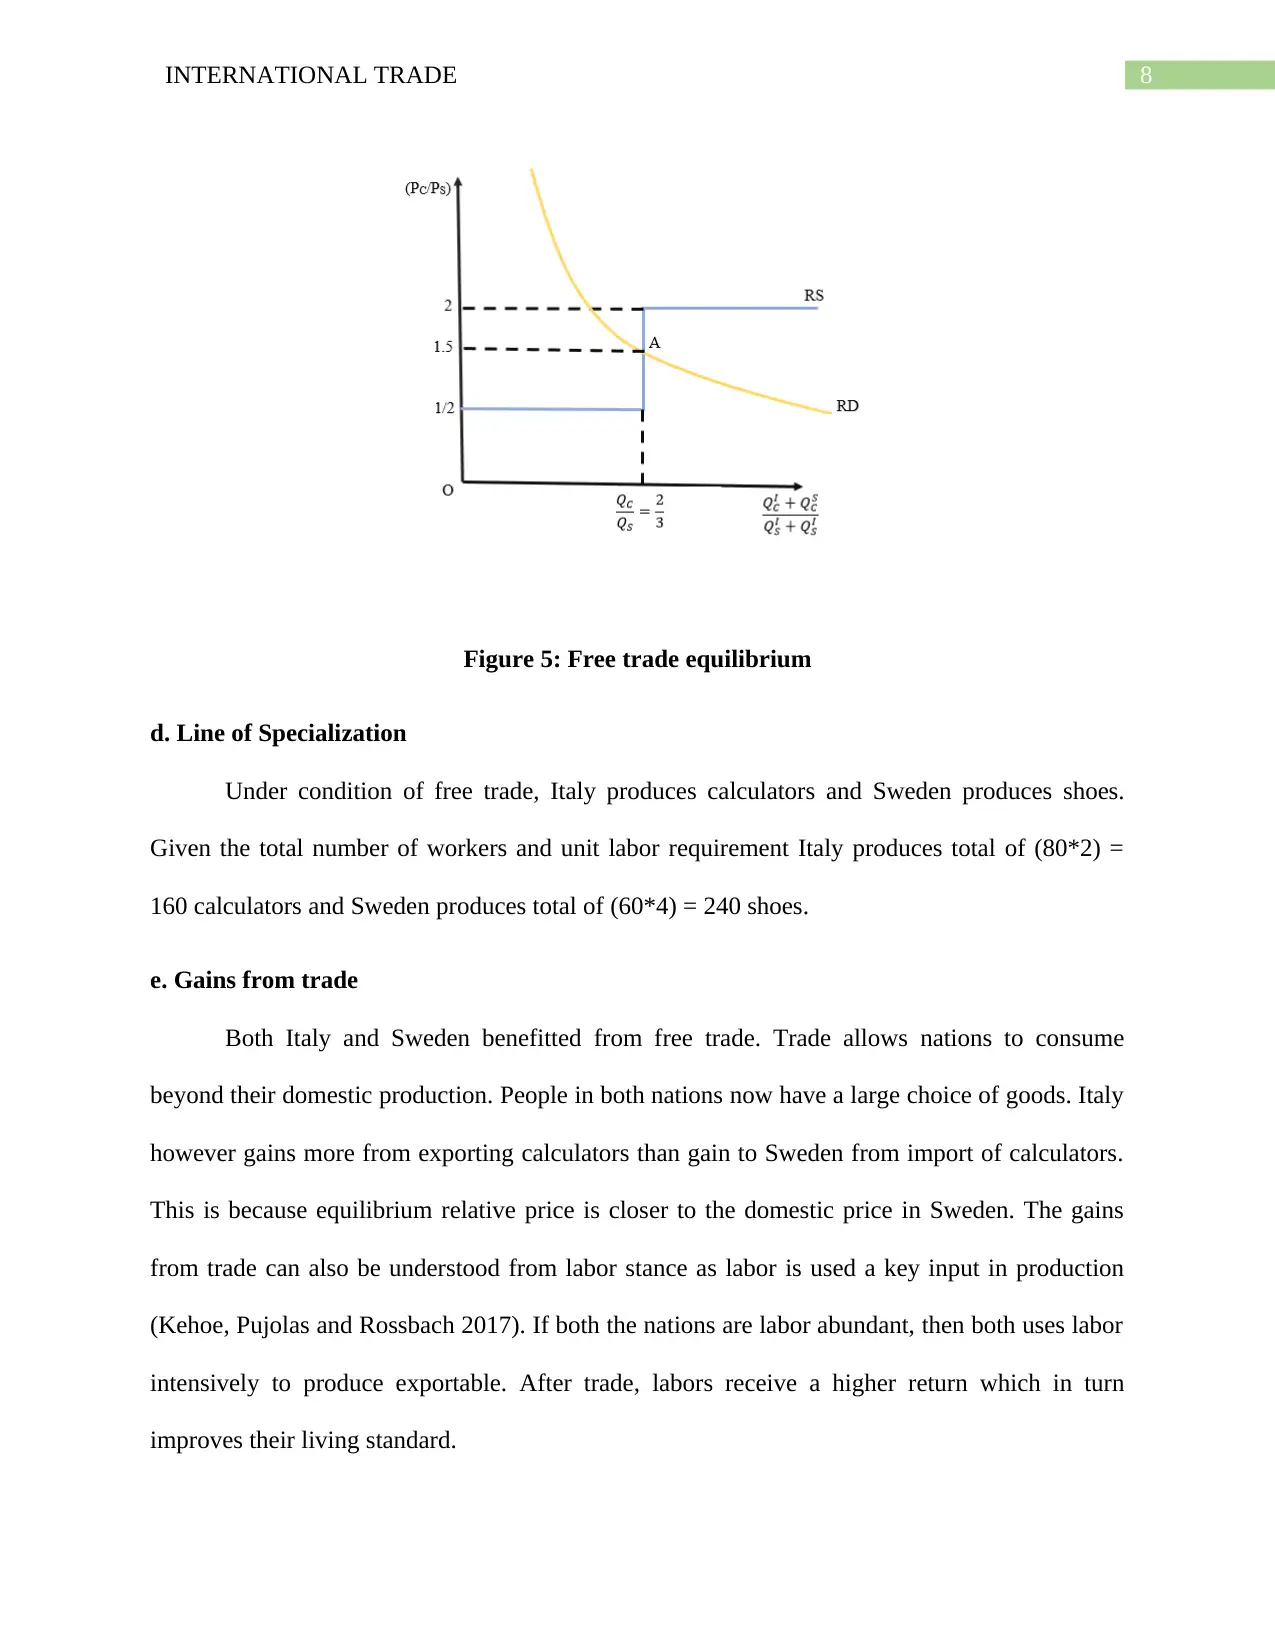
This report presents an in-depth analysis of international trade conditions in Italy and Sweden, focusing on trade openness, the Gini index, and the application of economic models. The analysis includes graphical representations of openness and the Gini index, calculating the correlation coefficient between these variables for both countries. The report validates the Stolper-Samuelson theorem based on the data and provides a technical analysis of the trade scenario, including relative demand and supply curves, free trade equilibrium, and the gains from trade, utilizing the Ricardian model to determine comparative advantages. The report concludes with a discussion of the benefits of free trade for both nations, highlighting the impact on labor and living standards. The assignment adheres to the guidelines provided by the university for ECON1086 International Trade analysis.
tabler-icon-diamond-filled.svg

Contribute Materials

Your contribution can guide someone’s learning journey. Share your documents today.
Document Page
Running head: INTERNATIONAL TRADE
International Trade
Name of the Student
Name of the University
Course ID
Student ID
tabler-icon-diamond-filled.svg

Secure Best Marks with AI Grader

Need help grading? Try our AI Grader for instant feedback on your assignments.
Document Page
1INTERNATIONAL TRADE
Table of Contents
Data analysis....................................................................................................................................2
Graphical representation of openness and Gini index.................................................................2
Correlation coefficient between Openness and Gini Index.........................................................3
Validation of Stolper-Samuelson theorem...................................................................................3
Technical Analysis...........................................................................................................................4
a. Relative demand curve.............................................................................................................5
b. Relative supply curve..............................................................................................................6
c. Free trade equilibrium..............................................................................................................7
d. Line of Specialization..............................................................................................................8
e. Gains from trade......................................................................................................................8
List of references.............................................................................................................................9
Document Page
2INTERNATIONAL TRADE
Data analysis
Graphical representation of openness and Gini index
Italy
32.5 33 33.5 34 34.5 35 35.5 36
40%
42%
44%
46%
48%
50%
52%
54%
56%
58%
Opennes and Gini Index
Gini Index
Openness
Sweden
25 25.5 26 26.5 27 27.5 28 28.5 29 29.5
70%
75%
80%
85%
90%
95%
100%
Opennes and Gini Index
Gini Index
Openness
Document Page
3INTERNATIONAL TRADE
Correlation coefficient between Openness and Gini Index
The correlation coefficient shows association between two variables. Computed
correlation coefficient between Gini Index and openness in Italy is 0.27. The correlation
coefficient is positive having a relatively smaller value. The positive correlation means there is a
positive association between inequality and openness. As openness is measured in terms of
proportion of trade volume in total GDP, positive association implies that with increasing
participation in trade inequality in Italy increases. As Gini index also represents the ratio of
skilled to unskilled wage this can also be interpreted as with increase in openness relative wage
to skilled labor increase as compared to unskilled labor (Grossman and Helpman 2018). The
association however is weak as reflected from a smaller correlation coefficient. The computed
correlation coefficient for Sweden is 0.49. This value of the coefficient implies a moderately
strong positively association between Gini index and openness of Sweden. Like Italy, Sweden
also suffers from the problem of increasing inequality with increase in the degree of openness.
That is skilled workers gain a higher wage than unskilled workers are as the country becomes
more open.
Validation of Stolper-Samuelson theorem
Stopler-Samuelson theorem is one fundamental theorems of Heckscher Ohlin theory of
international trade. Purpose of the theory is to model the relationship between relative price of
good and reward to the factor especially return to capital and real wages. Under specific
assumption such as perfect competition, constant return to scale and equality between number of
factors and number of products, when relative price of a good increase, there is an increase in
return to the factor input that is most intensively used in the production (Kurose and Yoshihara
2015). The correlation estimates indicate a positive association between openness and that of the
tabler-icon-diamond-filled.svg

Secure Best Marks with AI Grader

Need help grading? Try our AI Grader for instant feedback on your assignments.
Document Page
4INTERNATIONAL TRADE
ratio of skilled to unskilled wage. Both Italy and Sweden are abundant in skilled labor. Both
therefore uses skilled labor intensively in producing the exported goods. Countries export a good
only when the world relative price is greater than domestic relative price. An increase in
openness implies a higher trade volume. Increase in relative price of exported goods thus
associated with an increase in wages of skilled labor force which is used intensively in priding
the good. The obtained result therefore support claim of Stolper-Samuelson theory.
Technical Analysis
Given the hypothetical scenario, the capacity of workers in Italy and Sweden to produce
shoes and calculators are given in the following table.
Number of units /unit of time Shoe Calculator
Italy 1 2
Sweden 4 2
Using the labor requirement, the opportunity cost of production of shoes and calculators
are presented in the following table.
Opportunity Cost Shoe Calculator
Italy 2/1 = 2 ½
Sweden 2/4 = 1/2 4/2 = 2
Following the assumption of Ricardian model, Italy has a comparative advantage in
Calculator and Sweden has a comparative advantage in Shoes (Ruffin 2017).
Document Page
5INTERNATIONAL TRADE
a. Relative demand curve
Relative demand for calculators= Total demand for calculators
Total demand for shoes
¿ QC
I + QC
S
QS
I + QS
S
¿ QC
QS
Using the inverse relation between relative demand and relative price, the relative demand
equation can be expressed as
RDC= 1
PC
PS
¿ , QC
QS
= 1
PC
PS
¿ , QC
QS
× PC
PS
¿ 1
The above equation indicate that shape of relative demand cure should be a rectangular
hyperbola (Feenstra 2015).
Document Page
6INTERNATIONAL TRADE
Figure 3: Relative demand curve for calculators
b. Relative supply curve
The shape of relative supply curve depends on the relation between relative price of
calculators with the relative quantity of calculators. In autarky, domestic relative price of
calculator in Italy is ½ (opportunity cost of calculator in Italy). Italy therefore will specialize and
export calculator if price is above the domestic relative price ratio (Senga, Fujimoto and Tabuchi
2017). In Sweden, the domestic relative price of calculator is 2. Sweden therefore will import
calculators is world relative price is below 2. The trade between two nation occurs when world
relative price is somewhere between ½ and 2. At this price the relative quantity of calculator is
(160/240) = 2/3. The relative supply curve of calculator is shown in the following figure.
tabler-icon-diamond-filled.svg

Paraphrase This Document

Need a fresh take? Get an instant paraphrase of this document with our AI Paraphraser
Document Page
7INTERNATIONAL TRADE
Figure 4: Relative supply of Calculator
c. Free trade equilibrium
In the following figure, free trade equilibrium occurs at point A. This is the point where
relative demand curve intersects the relative supply curve. The equilibrium relative price can be
determined as
( Pc
Ps )
¿
= 1
( QC
QS )
¿
¿ 1
2
3
¿ 3
2
¿ 1.5
Document Page
8INTERNATIONAL TRADE
Figure 5: Free trade equilibrium
d. Line of Specialization
Under condition of free trade, Italy produces calculators and Sweden produces shoes.
Given the total number of workers and unit labor requirement Italy produces total of (80*2) =
160 calculators and Sweden produces total of (60*4) = 240 shoes.
e. Gains from trade
Both Italy and Sweden benefitted from free trade. Trade allows nations to consume
beyond their domestic production. People in both nations now have a large choice of goods. Italy
however gains more from exporting calculators than gain to Sweden from import of calculators.
This is because equilibrium relative price is closer to the domestic price in Sweden. The gains
from trade can also be understood from labor stance as labor is used a key input in production
(Kehoe, Pujolas and Rossbach 2017). If both the nations are labor abundant, then both uses labor
intensively to produce exportable. After trade, labors receive a higher return which in turn
improves their living standard.
Document Page
9INTERNATIONAL TRADE
List of references
Feenstra, R.C., 2015. Advanced international trade: theory and evidence. Princeton university
press.
Grossman, G.M. and Helpman, E., 2018. Growth, trade, and inequality. Econometrica, 86(1),
pp.37-83.
Kehoe, T.J., Pujolas, P.S. and Rossbach, J., 2017. Quantitative trade models: developments and
challenges. Annual Review of Economics, 9, pp.295-325.
Kurose, K. and Yoshihara, N., 2015. The Heckscher-Ohlin-Samuelson (HOS) Trade Theory and
Capital Theory. Economic Review, 66(2), pp.169-189.
Ruffin, R.J., 2017. Ricardo and international trade theory. In Ricardo and International
Trade (pp. 20-32). Routledge.
Senga, S., Fujimoto, M. and Tabuchi, T. eds., 2017. Ricardo and International Trade. Taylor &
Francis.
chevron_up_icon
1 out of 10
circle_padding
hide_on_mobile
zoom_out_icon
logo.png

Your All-in-One AI-Powered Toolkit for Academic Success.

Available 24*7 on WhatsApp / Email

[object Object]