International Trade Analysis: Italy and Sweden - Course ID
VerifiedAdded on 2022/12/26
|11
|1546
|1
Homework Assignment
AI Summary
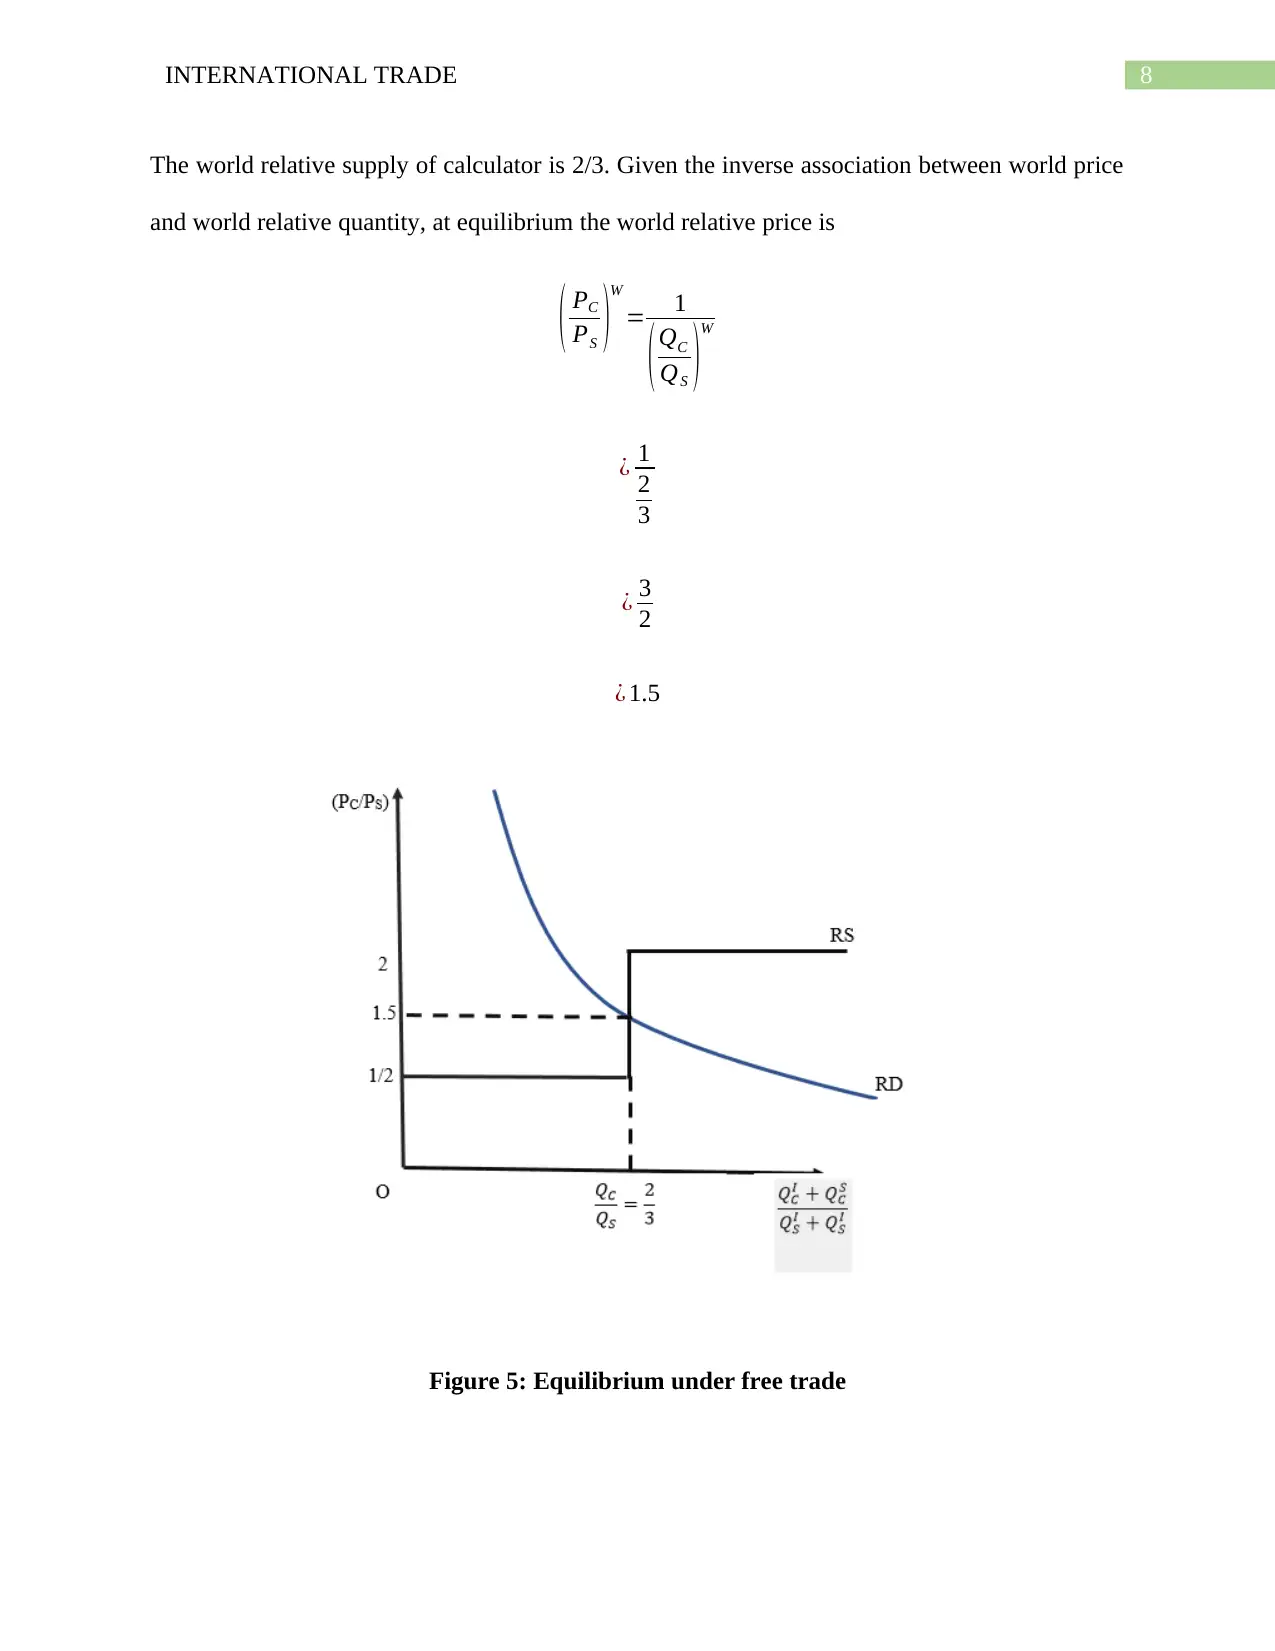
This assignment analyzes international trade dynamics between Italy and Sweden, focusing on data analysis, technical analysis, and theoretical frameworks. The analysis includes the examination of openness and inequality using the Gini Index and correlation analysis, as well as the application of the Stolper-Samuelson theorem to explain factor price relationships. The assignment also explores comparative advantage, relative supply and demand, and the impact of free trade on production, specialization, and welfare in both countries. It provides insights into how countries benefit from international trade, the effects of trade on factor returns, and the determination of equilibrium prices under free trade. The data analysis uses information from the World Bank and applies it to the economic models. The assignment's objective is to assess the student's analytical skills in the context of international economics.

Running head: INTERNATIONAL TRADE
International Trade
Name of the Student
Name of the University
Course ID
International Trade
Name of the Student
Name of the University
Course ID
Paraphrase This Document
Need a fresh take? Get an instant paraphrase of this document with our AI Paraphraser

1INTERNATIONAL TRADE
Table of Contents
Data Analysis...................................................................................................................................2
Visual representation of openness and inequality.......................................................................2
Correlation between openness and Gini Index............................................................................3
Stolper Samuelson theorem.........................................................................................................3
Technical Analysis...........................................................................................................................4
Answer a......................................................................................................................................5
Answer b......................................................................................................................................6
Answer c......................................................................................................................................7
Answer d......................................................................................................................................9
Answer e......................................................................................................................................9
References......................................................................................................................................10

2INTERNATIONAL TRADE
Data Analysis
Visual representation of openness and inequality
32.5 33 33.5 34 34.5 35 35.5 36
40.00%
42.00%
44.00%
46.00%
48.00%
50.00%
52.00%
54.00%
56.00%
58.00%
Italy
Gini Index
Openness
Figure 1: Openness and Gini Index for Italy
25 25.5 26 26.5 27 27.5 28 28.5 29 29.5
70.00%
75.00%
80.00%
85.00%
90.00%
95.00%
Sweden
Gini Index
Openness
Figure 2: Openness and Gini Index for Sweden
⊘ This is a preview!⊘
Do you want full access?
Subscribe today to unlock all pages.

Trusted by 1+ million students worldwide

3INTERNATIONAL TRADE
Correlation between openness and Gini Index
Openness of a nation indicates involvement of a nation in free trade. Sum of export and
import represented as a percent of GDP is one measure of openness. The degree of inequality in
a nation is measured by Gini Index. Gini Index is also used as a proxy measure for skilled to
unskilled labor in the nation. The correlation between openness and Gini index in case of Italy is
0.26. The positive correlation implies a positive association with openness and inequality. That is
inequality increases with increase in openness and vice versa. The value of correlation however
is relatively smaller indicating a week relation between openness and inequality. For Sweden, the
estimated correlation coefficient between openness and Gini Index is 0.49. The positive
correlation indicates the association between openness and inequality is again positive. That
means inequality tends to increase as the country becomes more open (Feenstra 2015). The value
of correlation coefficient in case of Sweden is greater than that for Italy implying a moderate
association between openness and inequality. As Gini index also represents ratio of wage of
skilled to unskilled labor, the positive correlation implies as the country become more and more
open, the ratio of skilled to unskilled wage increases.
Stolper Samuelson theorem
The Stolper-Samuelson theorem is one of the fundamental theory derived from trade
theory as proposed by Heckscher and Ohlin. This theory explains how price of factor inputs is
related with relative price of the goods traded in the international market. According to the
theory with increase in relative price of a good, return to the factor that is intensively used in
producing the good increases. It is given that, Italy and Sweden both are skilled labor intensive
countries. Following Heckscher-Ohlin theory, both the countries therefore should specialize and
export skilled labor intensive goods (Vernon 2017). As the countries participate in international
Paraphrase This Document
Need a fresh take? Get an instant paraphrase of this document with our AI Paraphraser

4INTERNATIONAL TRADE
trade it receives a higher price for the exported goods. For both the nation the correlation
estimate shows a positive association between openness and ratio of skilled to unskilled wage.
That is with increase in openness or increase in relative price of exported good return to the
factor input that is used intensively (wage to skilled labor) increases as well. Intensive factors
thus receive a higher reward when these countries participate in trade. The empirical estimates
from the two nations thus support the stated proposition of the Stolper Samuelson theory that
increase in relative price of a good increases reward to the intensive factor input.
Technical Analysis
Table 1: Unit labor requirement for production of shoe and calculator in Italy and Sweden
Number of units /unit of time Shoe Calculator
Italy 1 2
Sweden 4 2
From the unit labor requirement, the opportunity cost of producing shoe and calculator in Italy
and Sweden can be determined as follows
Table 2: Opportunity cost of production of shoe and calculator
Opportunity Cost Shoe Calculator
Italy 2/1 = 2 ½
Sweden 2/4 = 1/2 4/2 = 2

5INTERNATIONAL TRADE
Italy has a comparative advantage in production of calculator while Sweden has a
comparative advantage in producing shoe.
Answer a
World relative demand of calculator
RD= DC
I +DC
S
DS
I +DS
S =QC
QS
The standard theory of international trade suggests that world relative demand is
inversely proportional to world relative price (Leamer and Stern 2017). Therefore,
RD= 1
PC
PS
¿ , QC
QS
= 1
PC
PS
¿ , QC
QS
× PC
PS
=1
The shape of relative demand curve thus is a rectangular hyperbola (Viner 2016). This is shown
below
⊘ This is a preview!⊘
Do you want full access?
Subscribe today to unlock all pages.

Trusted by 1+ million students worldwide

6INTERNATIONAL TRADE
Figure 3: Relative demand curve for calculator
Answer b
When both the nation specializes in goods in which they have comparative advantage
then, total supply of calculator is (80 * 2) = 160 and total supply of Shoe is (60 * 4) = 240.
Therefore, the relative supply of calculator is
QC
QS
=160
240 = 2
3
Paraphrase This Document
Need a fresh take? Get an instant paraphrase of this document with our AI Paraphraser

7INTERNATIONAL TRADE
Figure 4: World relative supply of calculator
Answer c
In order to make trade possible between the two nation the relative price should lie
between ½ and 2.
If (Pc/Ps) < 1/2, Italy will not specialize in calculator. Both the country then will produce shoes
only.
If (Pc/Ps) > 2, Sweden will not specialize in shoes. Rather it is beneficial for both nations to
produce only calculators.
Countries will specialize in goods having comparative advantage only when world relative price
lies in the intermediary range of domestic relative price ratios (Burstein and Vogel 2017).

8INTERNATIONAL TRADE
The world relative supply of calculator is 2/3. Given the inverse association between world price
and world relative quantity, at equilibrium the world relative price is
( PC
PS )
W
= 1
( QC
QS )
W
¿ 1
2
3
¿ 3
2
¿ 1.5
Figure 5: Equilibrium under free trade
The world relative supply of calculator is 2/3. Given the inverse association between world price
and world relative quantity, at equilibrium the world relative price is
( PC
PS )
W
= 1
( QC
QS )
W
¿ 1
2
3
¿ 3
2
¿ 1.5
Figure 5: Equilibrium under free trade
⊘ This is a preview!⊘
Do you want full access?
Subscribe today to unlock all pages.

Trusted by 1+ million students worldwide

9INTERNATIONAL TRADE
Answer d
Under free trade, Italy will specialize in calculator and produces only calculator. Sweden
on the other hand has comparative advantage in producing shoes, it will specialize in shoes and
will produce only shoes (Edmond, Midrigan and Xu 2015).
Total number of workers in Italy is 80. 1 Italian worker can produce 2 calculators. Therefore,
total number of calculators produced under free trade is (80 * 2) = 160.
Total number of workers in Sweden is 60. 1 Swedish worker can produce 4 shoes. Therefore,
total number of shoes produced under free trade is (60 * 4) = 240.
Answer e
As the countries specializes in goods in which they have comparative advantages both the
nation will be benefitted from free trade. Before trade, countries have to produce both
Calculators and Shoes by themselves (Krugman, Obstfeld and Melitz 2017). In the autarky, Italy
can produce and consume 40 shoes and 80 calculators. Sweden can produce and consume 120
shoes and 60 calculators. In autarky, countries cannot consume beyond its PPF. After trade
however world production of both shoes and calculators increase and countries can consume
beyond their PPF. Italy however gains more than Sweden as world relative price of calculators
far exceed the autarky relative price ratio. In both the nation skilled labor is the abundant factor
and hence, they will use skilled labor intensively in producing both the good (Borkakoti 2017).
The wage of skilled labor then increases while the wage to unskilled labor decreases. The skilled
laborers thus gain at the cost of unskilled laborers.
Paraphrase This Document
Need a fresh take? Get an instant paraphrase of this document with our AI Paraphraser

10INTERNATIONAL TRADE
References
Borkakoti, J., 2017. International trade: causes and consequences. Macmillan International
Higher Education.
Burstein, A. and Vogel, J., 2017. International trade, technology, and the skill premium. Journal
of Political Economy, 125(5), pp.1356-1412.
Edmond, C., Midrigan, V. and Xu, D.Y., 2015. Competition, markups, and the gains from
international trade. American Economic Review, 105(10), pp.3183-3221.
Feenstra, R.C., 2015. Advanced international trade: theory and evidence. Princeton university
press.
Krugman, P., Obstfeld, M. and Melitz, M., 2017. International Economics: Theory and Policy,
the latest edition. Addison-Wesley.
Leamer, E.E. and Stern, R.M., 2017. Quantitative international economics. Routledge.
Vernon, R., 2017. International investment and international trade in the product cycle.
In International Business (pp. 99-116). Routledge.
Viner, J., 2016. Studies in the theory of international trade. Routledge.
1 out of 11
Related Documents

Your All-in-One AI-Powered Toolkit for Academic Success.
+13062052269
info@desklib.com
Available 24*7 on WhatsApp / Email
Unlock your academic potential
Copyright © 2020–2025 A2Z Services. All Rights Reserved. Developed and managed by ZUCOL.