La Trobe University ECO3ITR Semester 2: International Trade Assignment

Verified

Added on  2023/03/30

|12
|1234
|335
Homework Assignment
AI Summary
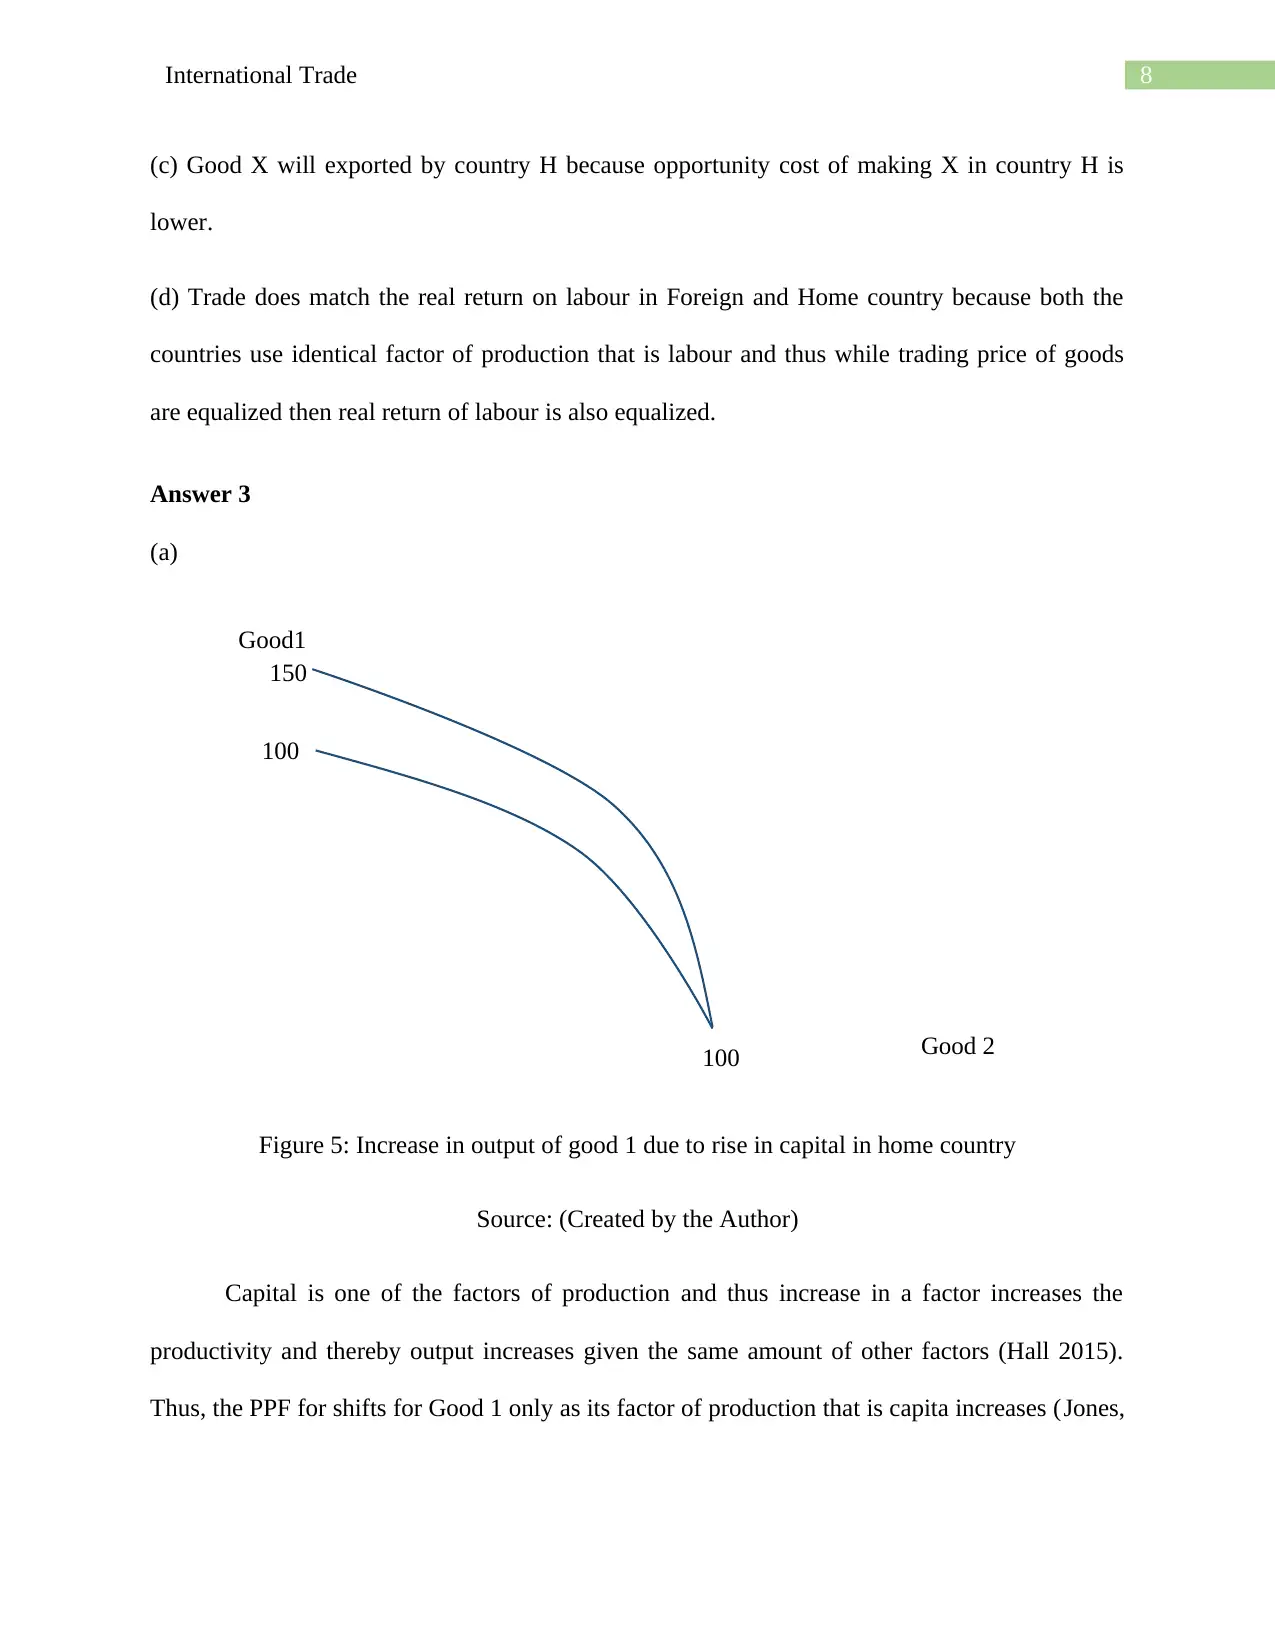
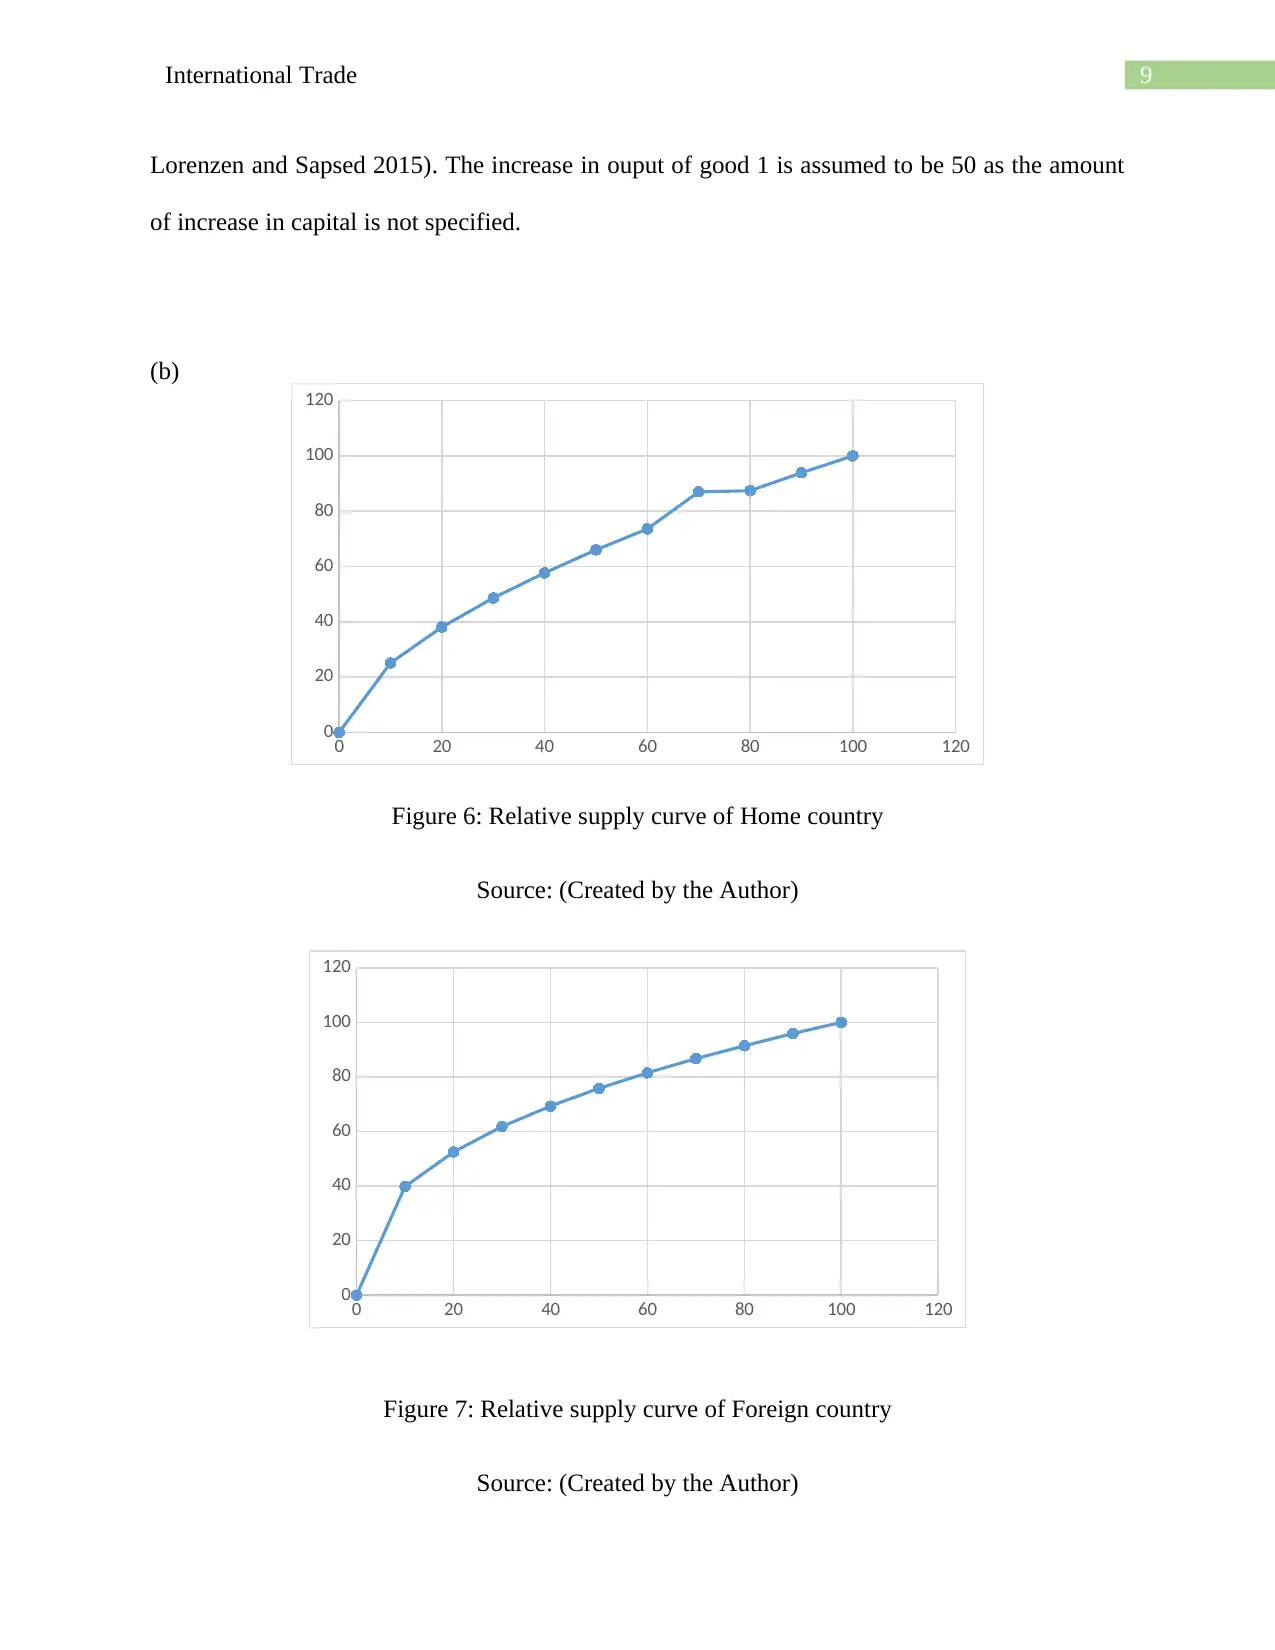
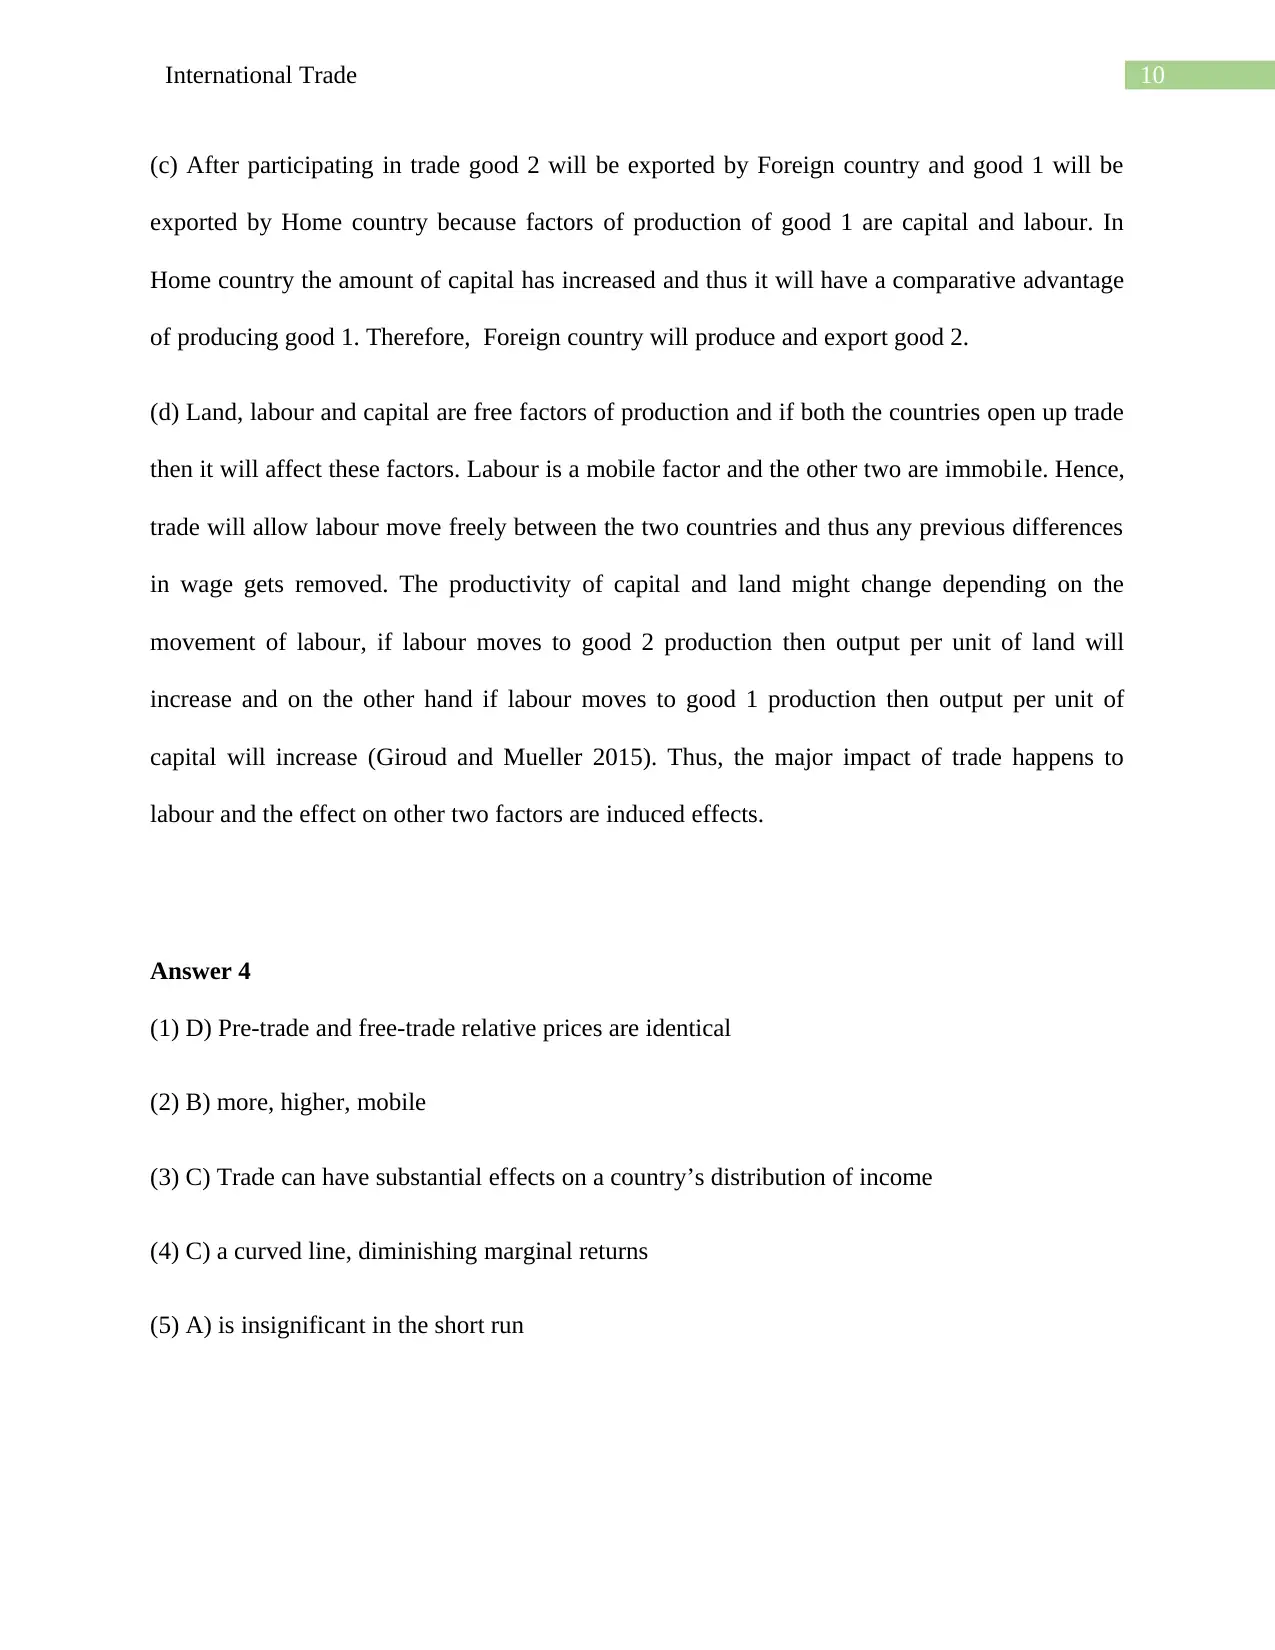
This assignment solution addresses key concepts in international trade, including production possibility curves, absolute and comparative advantage, and opportunity cost calculations using the Ricardian model. It analyzes trade scenarios between two countries, examining production possibilities and autarky equilibrium. The assignment further explores the impact of increased capital on production possibilities and relative supply curves, and the effects of trade on factor mobility. Finally, it provides answers to multiple-choice questions on trade and income distribution, covering topics like the Heckscher-Ohlin model and factor price equalization. The solution includes detailed explanations, calculations, and graphical representations to illustrate the concepts.
tabler-icon-diamond-filled.svg

Contribute Materials

Your contribution can guide someone’s learning journey. Share your documents today.
Document Page
Running head: International Trade
International Trade
Name of the Student
Name of the University
Student ID
tabler-icon-diamond-filled.svg

Secure Best Marks with AI Grader

Need help grading? Try our AI Grader for instant feedback on your assignments.
Document Page
1International Trade
Table of Contents
Answer 1..........................................................................................................................................2
Answer 2..........................................................................................................................................4
Answer 3..........................................................................................................................................8
Answer 4........................................................................................................................................10
References......................................................................................................................................11
Document Page
2International Trade
10
3
Hamburger
T Shirt
7
4
Hamburger
T Shirt
Answer 1
(a)
Figure 1: Mike’s production possibility curve
Source: (Created by the Author)
Figure 2: Johnson’s production possibility curve
Document Page
3International Trade
Source: (Created by the Author)
(b)
Mike can produce either 10 hamburgers or 3 T-shirts in a day and Johnson can produce 7
hamburgers or 4 T-shirts. Thus, in case of hamburgers Mike produces more than Johnson using
same amount of resources while Johnson produces more T-shirts than Mike. Thus, both of them
have comparative advantage of producing a particular good but none of them have any absolute
advantage of producing both the good.
(c)
Mike’s opportunity cost of making T-shirts:
Opportunit cost of makingT shirts= No .of hamburgers not produced
No .of T shirts produced
Opportunity cost of making T shirts= 10
3
Opportunity cost of making T shirts=3.33
Johnson’s opportunity cost of making T-shirts:
Opportunity cost of making T shirts= No. of hamburgers not produced
No. of T shirts produced
Opportunity cost of making T shirts= 7
4
Opportunity cost of making T shirts=1.75
Therefore, from the above calculation is can be said that Mike has higher opportunity cost of
making T-shirts.
tabler-icon-diamond-filled.svg

Secure Best Marks with AI Grader

Need help grading? Try our AI Grader for instant feedback on your assignments.
Document Page
4International Trade
(d)
Mike’s opportunity cost of producing hamburgers:
Opportunity cost of producing hamburgers= No. of T shirts produced
No. of hamburgers not produced
Opportunity cost of producing hamburgers= 3
10
Opportunity cost of producing hamburgers=0.3
Johnson’s opportunity cost of producing hamburgers:
Opportunity cost of producing hamburgers= No. of T shirts produced
No. of hamburgers not produced
Opportunity cost of producing hamburgers= 4
7
Opportunity cost of producing hamburgers=0.57
From the above calculation of opportunity cost of manufacturing hamburgers it is found that
Johnson has higher opportunity cost of manufacturing hamburgers than that of Mike. Thus, Mike
has comparative advantage in producing hamburgers.
Answer 2
Country H has 2400 units of labour and to make produce a single unit of good X and
good Y it uses 6 units and 12 units of labour respectively. Therefore, if the country uses entire
labour in production of X, then it will produce 2400/6 or 400 units of X. On the other hand, if the
entire labour is used in production of Y, then the country will produce 2400/12 or 200 units of Y.
Document Page
5International Trade
200
400
Y
X
Similarly, country F has 1800 units of labour and to make produce a single unit of good
X and good Y it uses 4 units and 2 units of labour respectively. Therefore, if the country uses
entire labour in production of X, then it will produce 1800/4 or 450 units of X. On the other
hand, if the entire labour is used in production of Y, then the country will produce 1800/2 or 900
units of Y.
(a)
Figure 3:
Production possibility frontier of H
Source: (Created by the Author)
Document Page
6International Trade
900
450
Y
X
Figure 4: Production possibility frontier of F
Source: (Created by the Author)
Autarky equilibrium price ratiocountry H = Px
Py
¿ , Autarky equilibrium price ratiocountry H= 400
200
¿ , Autarky equilibrium price ratiocountry H=2
Autarky equilibrium price ratiocountry F= Px
Py
¿ , Autarky equilibrium price ratiocountry F= 450
900
¿ , Autarky equilibrium price ratiocountry F=0.5
tabler-icon-diamond-filled.svg

Paraphrase This Document

Need a fresh take? Get an instant paraphrase of this document with our AI Paraphraser
Document Page
7International Trade
(b)
H' s opportunity cost of producing X= 200
400
¿ , H' s opportunity cost of producing X=0.5
H' s opportunity cost of producing Y = 400
200
¿ , H' s opportunity cost of producingY =2
F' s opportunity cost of producing X= 900
450
¿ , F' s opportunity cost of producing X =2
F' s opportunity cost of producing Y = 450
900
¿ , F' s opportunity cost of producing Y =0.5
Therefore,
World price ratio for X= 0.5
2
¿ , World price ratio for X =0.25
World price ratio for Y = 2
0.5
¿ , World price ratio for Y =4
Range of feasible equilibrium world price ratios are 0.5 to 4
Document Page
8International Trade
150
Good1
Good 2
100
100
(c) Good X will exported by country H because opportunity cost of making X in country H is
lower.
(d) Trade does match the real return on labour in Foreign and Home country because both the
countries use identical factor of production that is labour and thus while trading price of goods
are equalized then real return of labour is also equalized.
Answer 3
(a)
Figure 5: Increase in output of good 1 due to rise in capital in home country
Source: (Created by the Author)
Capital is one of the factors of production and thus increase in a factor increases the
productivity and thereby output increases given the same amount of other factors (Hall 2015).
Thus, the PPF for shifts for Good 1 only as its factor of production that is capita increases (Jones,
Document Page
9International Trade
Lorenzen and Sapsed 2015). The increase in ouput of good 1 is assumed to be 50 as the amount
of increase in capital is not specified.
(b)
Figure 6: Relative supply curve of Home country
Source: (Created by the Author)
Figure 7: Relative supply curve of Foreign country
Source: (Created by the Author)
0 20 40 60 80 100 120
0
20
40
60
80
100
120
0 20 40 60 80 100 120
0
20
40
60
80
100
120
tabler-icon-diamond-filled.svg

Secure Best Marks with AI Grader

Need help grading? Try our AI Grader for instant feedback on your assignments.
Document Page
10International Trade
(c) After participating in trade good 2 will be exported by Foreign country and good 1 will be
exported by Home country because factors of production of good 1 are capital and labour. In
Home country the amount of capital has increased and thus it will have a comparative advantage
of producing good 1. Therefore, Foreign country will produce and export good 2.
(d) Land, labour and capital are free factors of production and if both the countries open up trade
then it will affect these factors. Labour is a mobile factor and the other two are immobile. Hence,
trade will allow labour move freely between the two countries and thus any previous differences
in wage gets removed. The productivity of capital and land might change depending on the
movement of labour, if labour moves to good 2 production then output per unit of land will
increase and on the other hand if labour moves to good 1 production then output per unit of
capital will increase (Giroud and Mueller 2015). Thus, the major impact of trade happens to
labour and the effect on other two factors are induced effects.
Answer 4
(1) D) Pre-trade and free-trade relative prices are identical
(2) B) more, higher, mobile
(3) C) Trade can have substantial effects on a country’s distribution of income
(4) C) a curved line, diminishing marginal returns
(5) A) is insignificant in the short run
Document Page
11International Trade
References
Giroud, X. and Mueller, H.M., 2015. Capital and labor reallocation within firms. The Journal of
Finance, 70(4), pp.1767-1804.
Hall, P.A., 2015. Varieties of capitalism. Emerging Trends in the Social and Behavioral
Sciences: An Interdisciplinary, Searchable, and Linkable Resource, pp.1-15.
Jones, C., Lorenzen, M. and Sapsed, J. eds., 2015. The Oxford handbook of creative industries.
Oxford University Press.
chevron_up_icon
1 out of 12
circle_padding
hide_on_mobile
zoom_out_icon
logo.png

Your All-in-One AI-Powered Toolkit for Academic Success.

Available 24*7 on WhatsApp / Email

[object Object]