Report: Factors Impacting Internet Usage and Social Media
VerifiedAdded on 2020/05/11
|14
|2442
|67
Report
AI Summary
This report presents the findings of a survey conducted to investigate the factors influencing internet usage among 20 participants. The research utilized a questionnaire with open and closed-ended questions, analyzed using Excel to generate tables and graphs. Key findings include a higher proportion of male internet users, though the study didn't establish the reasons. The report also highlights that a majority of users are unemployed and the most popular social media platform is Facebook. Further analysis explores the impact of education, marital status, and occupation on internet usage patterns, concluding with recommendations for future research. The study examines hours spent online, main purposes for internet use (study, communication, online shopping, and job searching), and the social media platforms used by respondents. The data reveals the relationships between these factors, offering insights into online behavior and preferences.

Internet usage 1
Internet usage report
Name:
Student number:
Tutor:
1
Internet usage report
Name:
Student number:
Tutor:
1
Paraphrase This Document
Need a fresh take? Get an instant paraphrase of this document with our AI Paraphraser
Internet usage 2
Executive Summary
This research focussed on finding the factors that play around internet usage. The number of
participants who took part in the survey was 20. This sample was chosen through purposive
sampling method to ensure that the participants included all have used internet services. The
tool that was used to collect this first-hand information was the questionnaire. The use of a
questionnaire was apt in this research survey as it enabled the participants give out their
opinions without restrictions. The questionnaire contained 10 questions with were both open
and closed ended. Data was analysed using excel and results summarized in form of tables
and graphs to give various comparisons. Some of the findings included; there are many male
internet users than females. The study however was not able to establish the reasons behind
this big variance when it came to internet usage between the males and the females. To add
on, research found that most of the internet users are unemployed. This can be explained by
the fact that they could afford more time as they are not engaged in any meaningful time
consuming jobs.
2
Internet usage 3
Contents
Executive Summary...............................................................................................................................2
Introduction..........................................................................................................................................4
Method of data collection......................................................................................................................4
Summary of the data set........................................................................................................................5
COMPARISON OF INTERNET USAGE BY GENDER.................................................................5
COMPARISON OF INTERNET USAGE BY EDUCATION LEVEL.............................................6
COMPARISON OF INTERNET USAGE BY MARITAL STATUS...............................................7
COMPARISON OF INTERNET USAGE BY OCCUPATION.......................................................................8
HOURS SPENT ACTIVELY ON INTERNET DAILY...................................................................................9
MAIN PURPOSE FOR USING INTERNET..................................................................................10
SOCIAL MEDIA ACCOUNTS USED.....................................................................................................12
Conclusion and recommendations.......................................................................................................12
References...........................................................................................................................................14
3
⊘ This is a preview!⊘
Do you want full access?
Subscribe today to unlock all pages.
Trusted by 1+ million students worldwide
Internet usage 4
Introduction
The advent of internet has led to revolution of so many aspects of human life globally. To be
specific, the human life aspect which has been adversely affected is communication. The
internet tool that has been responsible for this is the presence of social media platforms that
have been facilitated by the availability of internet connectivity. Such social media platforms
include facebook, twitter, instagram, linkedin and youtube just to mention but a few
(Kalpidou, Costin, & Morris, 2011). The media platforms have been appreciated worldwide
for turning the world into a global village (Bansal, Lamba, & Alavi, 2014). However it is
believed that there are some factors that have led to the rapid usage of internet and social
media platforms across the globe (Baer, 2013). Some of these factors include level of income
of individuals, education standard, free time that an individual is able to afford and whether
one is in a relationship or not. The level of income influence the usage of social media
directly in that one has to purchase the data that enables him or her to get connected. So the
lesser the income the lesser the amount dedicated to purchase the data. The converse is also
true. The free time that one can afford also matters a lot. This is because social media
platforms are mostly regarded as a leisure space where people interact. Education level which
is also considered the most important thing when it comes to the use of social media platform
matters a lot. The contents in various social media platforms require some level of literacy so
that an individual can understand and communicate with others easily (Gerlich & Browning,
2010). This research report was carried out focussing on the various factors that play around
internet usage.
Method of data collection
To have data for this research report, first hand technique of data collection better known as
primary method of data collection was used. This was to ensure that data collected is first
hand. The tool that was used to collect this first-hand information was the questionnaire. The
4
Paraphrase This Document
Need a fresh take? Get an instant paraphrase of this document with our AI Paraphraser
Internet usage 5
use of a questionnaire was apt in this research survey as it enabled the participants give out
their opinions without restrictions. The questionnaire contained 10 questions with were both
open and closed ended. The number of participants who took part in the survey was 20. This
sample was chosen through purposive sampling method to ensure that the participants
included all have used internet services in one way or the other.
Summary of the data set
From the outlook of the research tool which is the questionnaire, various variables have been
able to come out. These variables are both categorical variables and numerical variables.
Numerical variables are those variables that can be quantified such as age and income levels.
Categorical variables are variables that cannot be quantified in terms of numerals. They are
only qualitative. In this research they included gender, marital status, occupation, education
level, social media platforms used by respondents just to mention but a few. The variable,
gender, enabled the research to compare the extent of usage of internet between the males and
females. It sought to establish whether there were significant differences in the usage of
internet and social media platforms between the two genders. The research also sought to
determine the whether the educational levels had an impact on usage of social media. The
same applied to amount of income that individuals earned.
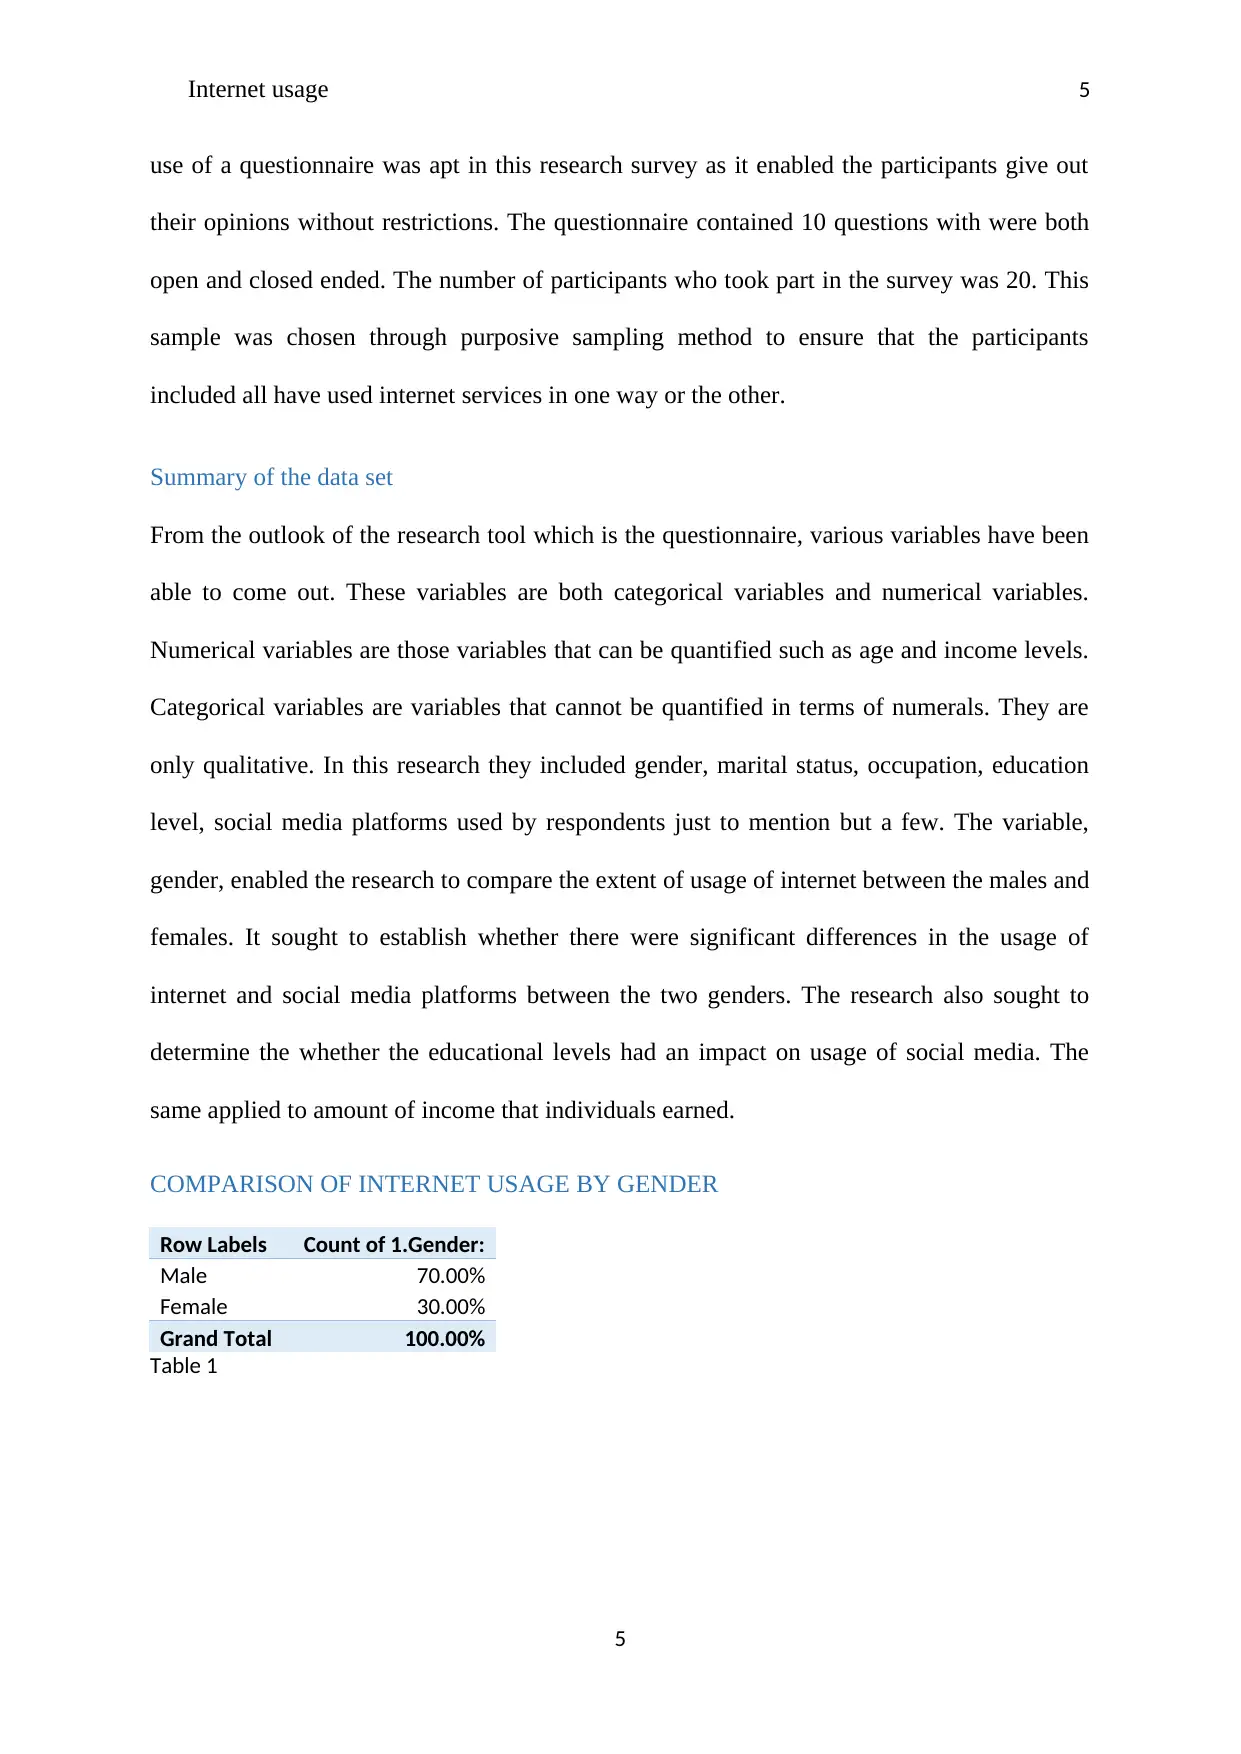
COMPARISON OF INTERNET USAGE BY GENDER
Row Labels Count of 1.Gender:
Male 70.00%
Female 30.00%
Grand Total 100.00%
Table 1
5
use of a questionnaire was apt in this research survey as it enabled the participants give out
their opinions without restrictions. The questionnaire contained 10 questions with were both
open and closed ended. The number of participants who took part in the survey was 20. This
sample was chosen through purposive sampling method to ensure that the participants
included all have used internet services in one way or the other.
Summary of the data set
From the outlook of the research tool which is the questionnaire, various variables have been
able to come out. These variables are both categorical variables and numerical variables.
Numerical variables are those variables that can be quantified such as age and income levels.
Categorical variables are variables that cannot be quantified in terms of numerals. They are
only qualitative. In this research they included gender, marital status, occupation, education
level, social media platforms used by respondents just to mention but a few. The variable,
gender, enabled the research to compare the extent of usage of internet between the males and
females. It sought to establish whether there were significant differences in the usage of
internet and social media platforms between the two genders. The research also sought to
determine the whether the educational levels had an impact on usage of social media. The
same applied to amount of income that individuals earned.
COMPARISON OF INTERNET USAGE BY GENDER
Row Labels Count of 1.Gender:
Male 70.00%
Female 30.00%
Grand Total 100.00%
Table 1
5
Internet usage 6
Male Female
0
2
4
6
8
10
12
14
14
6
Comparison of Internet users by
gender
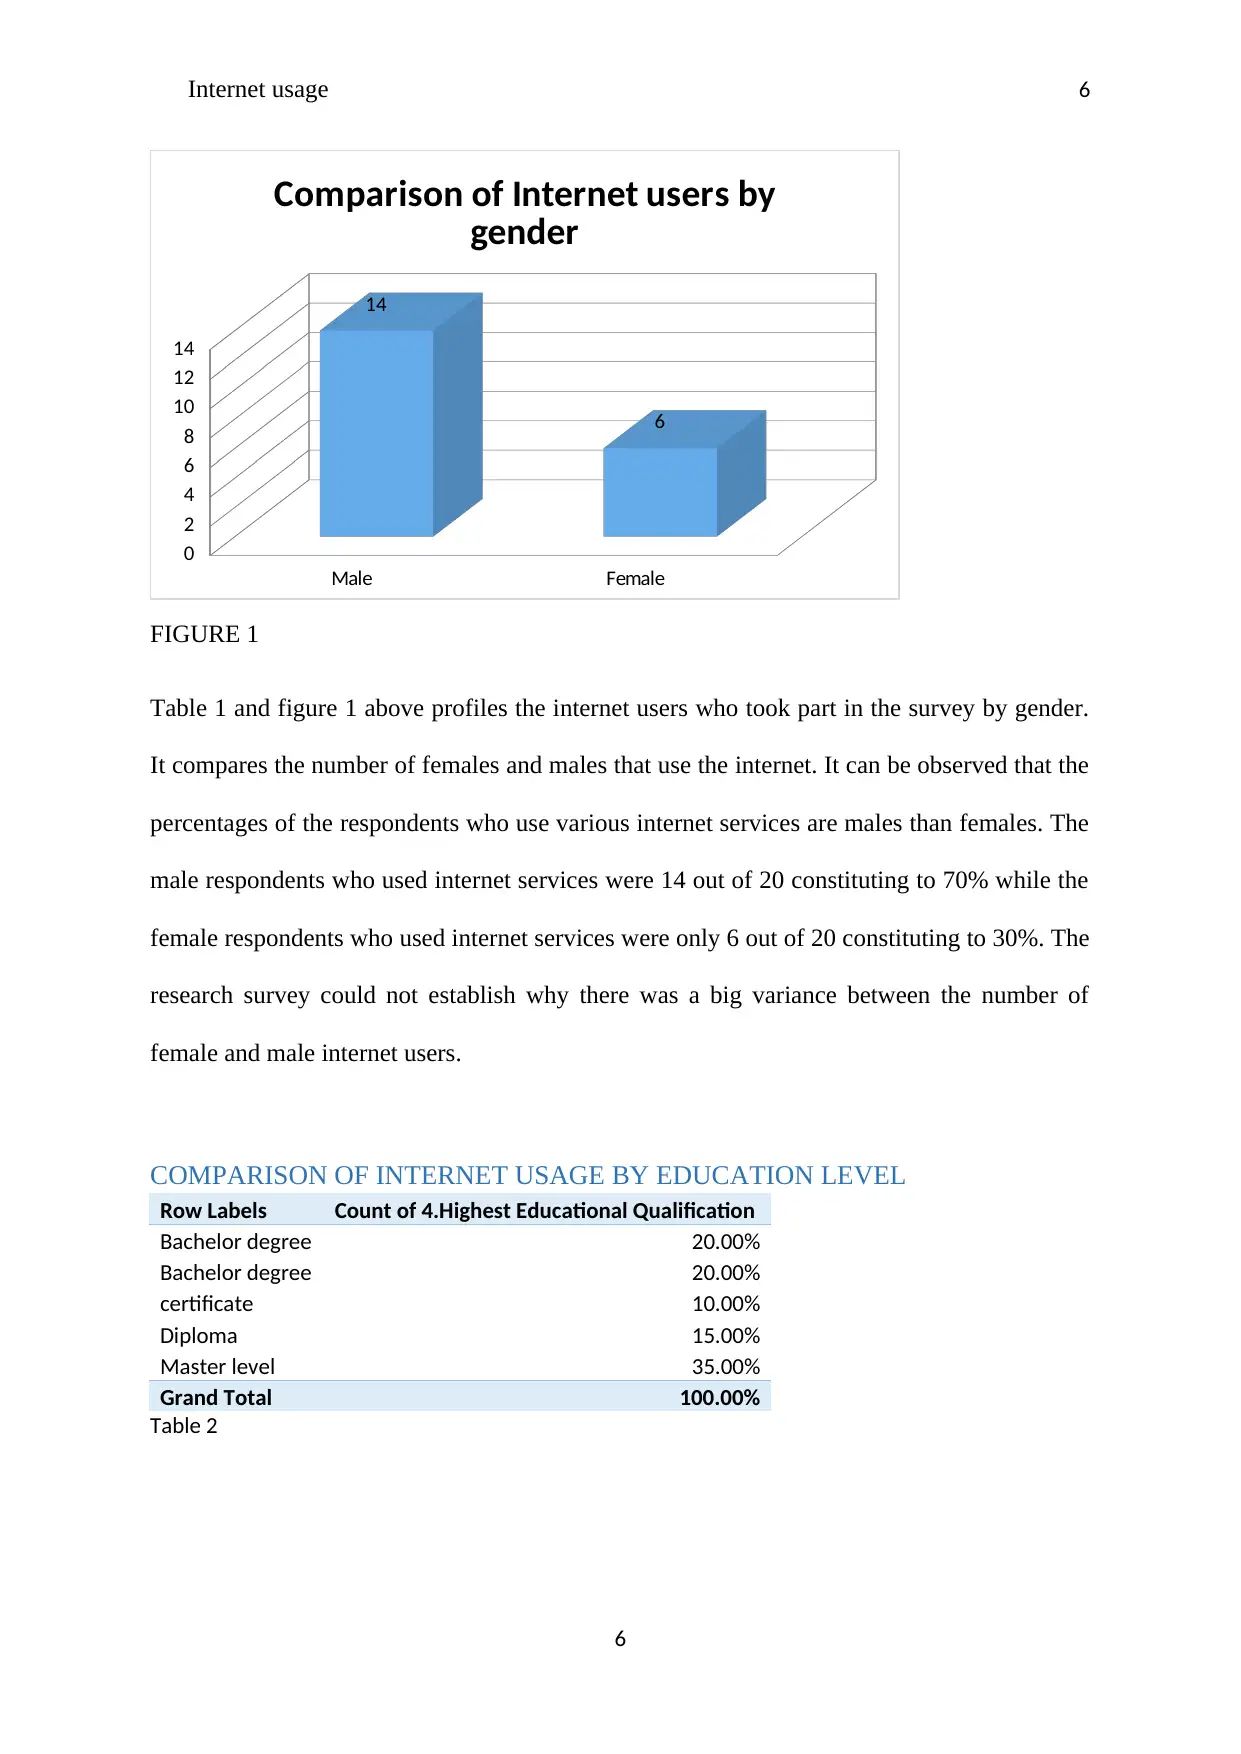
FIGURE 1
Table 1 and figure 1 above profiles the internet users who took part in the survey by gender.
It compares the number of females and males that use the internet. It can be observed that the
percentages of the respondents who use various internet services are males than females. The
male respondents who used internet services were 14 out of 20 constituting to 70% while the
female respondents who used internet services were only 6 out of 20 constituting to 30%. The
research survey could not establish why there was a big variance between the number of
female and male internet users.
COMPARISON OF INTERNET USAGE BY EDUCATION LEVEL
Row Labels Count of 4.Highest Educational Qualification
Bachelor degree 20.00%
Bachelor degree 20.00%
certificate 10.00%
Diploma 15.00%
Master level 35.00%
Grand Total 100.00%
Table 2
6
Male Female
0
2
4
6
8
10
12
14
14
6
Comparison of Internet users by
gender
FIGURE 1
Table 1 and figure 1 above profiles the internet users who took part in the survey by gender.
It compares the number of females and males that use the internet. It can be observed that the
percentages of the respondents who use various internet services are males than females. The
male respondents who used internet services were 14 out of 20 constituting to 70% while the
female respondents who used internet services were only 6 out of 20 constituting to 30%. The
research survey could not establish why there was a big variance between the number of
female and male internet users.
COMPARISON OF INTERNET USAGE BY EDUCATION LEVEL
Row Labels Count of 4.Highest Educational Qualification
Bachelor degree 20.00%
Bachelor degree 20.00%
certificate 10.00%
Diploma 15.00%
Master level 35.00%
Grand Total 100.00%
Table 2
6
⊘ This is a preview!⊘
Do you want full access?
Subscribe today to unlock all pages.
Trusted by 1+ million students worldwide
Internet usage 7
Bachelor
degree Bachelor
degree certificate Diploma Master level
0
1
2
3
4
5
6
7
4 4
2
3
7
Internet users by education level
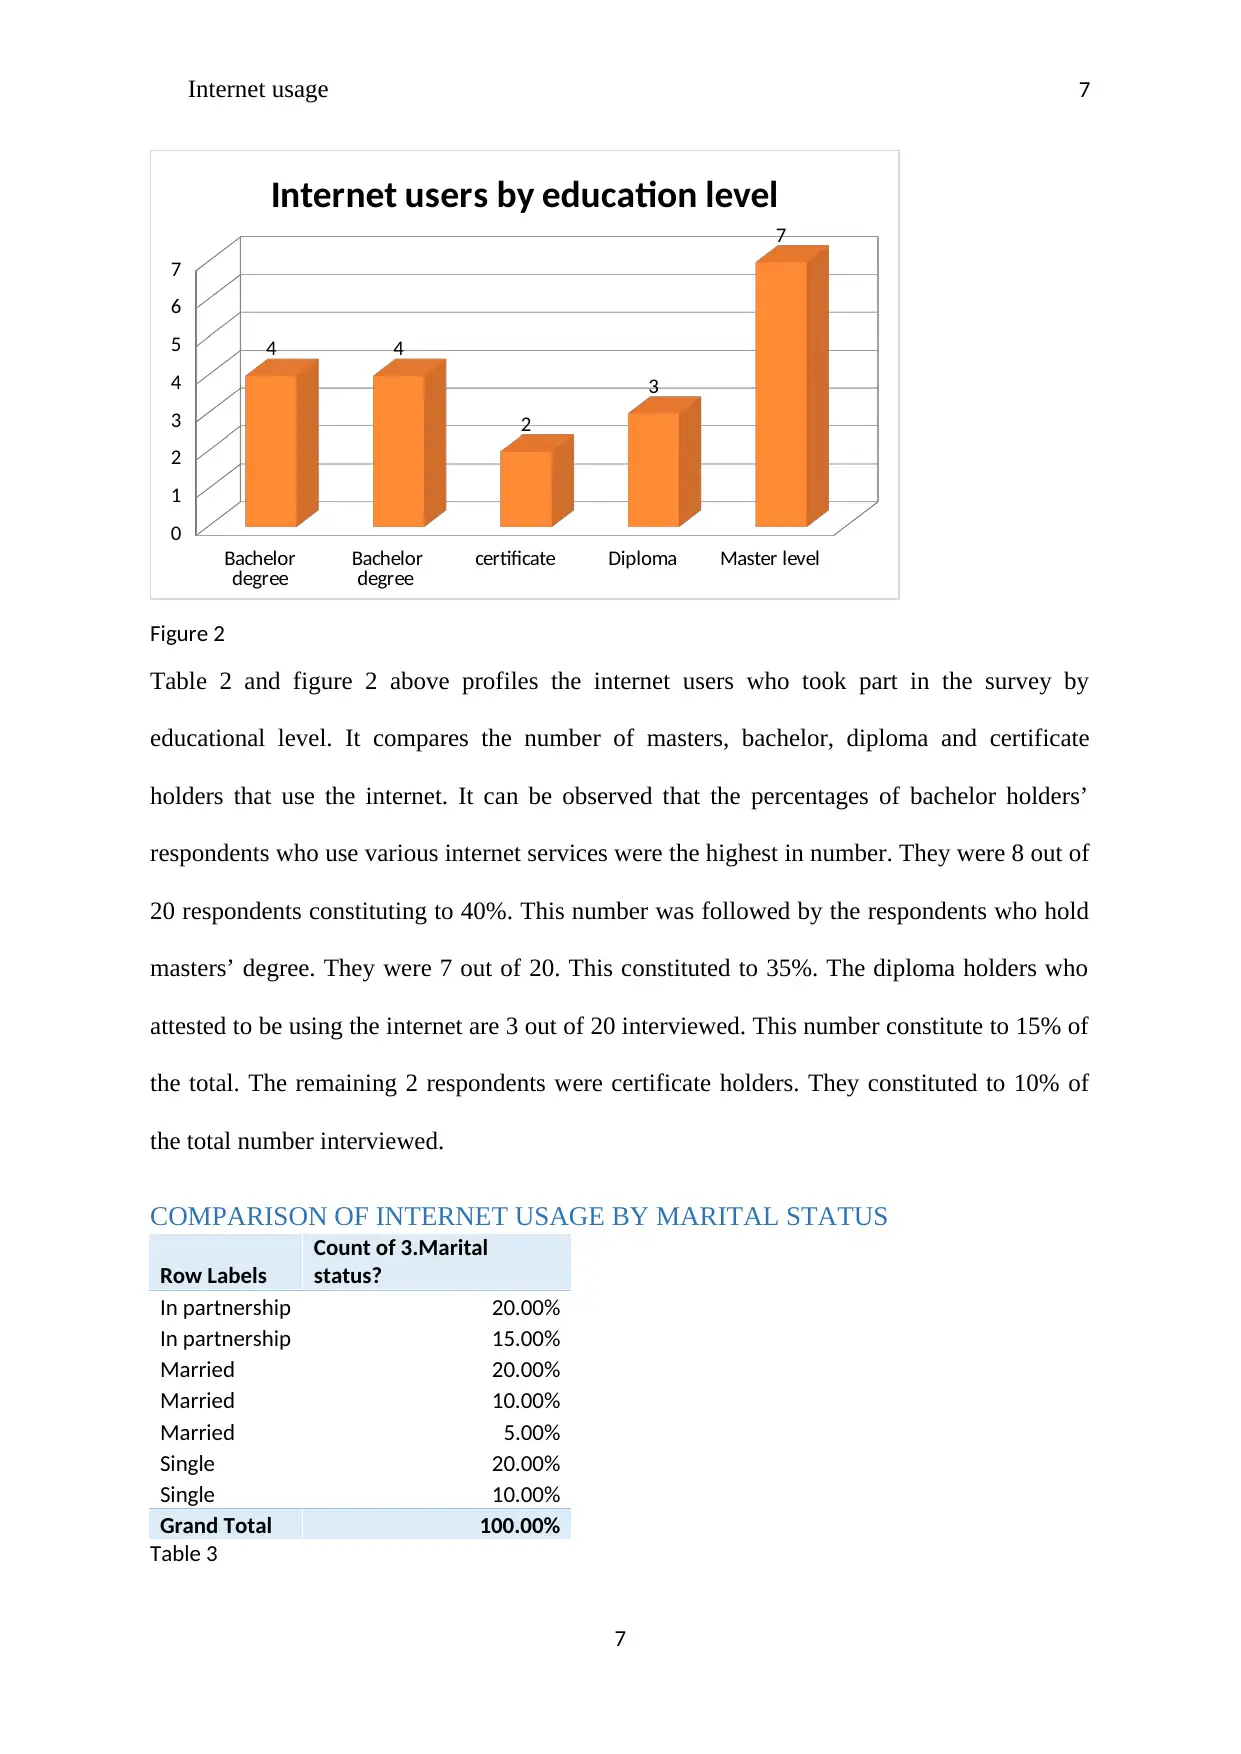
Figure 2
Table 2 and figure 2 above profiles the internet users who took part in the survey by
educational level. It compares the number of masters, bachelor, diploma and certificate
holders that use the internet. It can be observed that the percentages of bachelor holders’
respondents who use various internet services were the highest in number. They were 8 out of
20 respondents constituting to 40%. This number was followed by the respondents who hold
masters’ degree. They were 7 out of 20. This constituted to 35%. The diploma holders who
attested to be using the internet are 3 out of 20 interviewed. This number constitute to 15% of
the total. The remaining 2 respondents were certificate holders. They constituted to 10% of
the total number interviewed.
COMPARISON OF INTERNET USAGE BY MARITAL STATUS
Row Labels
Count of 3.Marital
status?
In partnership 20.00%
In partnership 15.00%
Married 20.00%
Married 10.00%
Married 5.00%
Single 20.00%
Single 10.00%
Grand Total 100.00%
Table 3
7
Bachelor
degree Bachelor
degree certificate Diploma Master level
0
1
2
3
4
5
6
7
4 4
2
3
7
Internet users by education level
Figure 2
Table 2 and figure 2 above profiles the internet users who took part in the survey by
educational level. It compares the number of masters, bachelor, diploma and certificate
holders that use the internet. It can be observed that the percentages of bachelor holders’
respondents who use various internet services were the highest in number. They were 8 out of
20 respondents constituting to 40%. This number was followed by the respondents who hold
masters’ degree. They were 7 out of 20. This constituted to 35%. The diploma holders who
attested to be using the internet are 3 out of 20 interviewed. This number constitute to 15% of
the total. The remaining 2 respondents were certificate holders. They constituted to 10% of
the total number interviewed.
COMPARISON OF INTERNET USAGE BY MARITAL STATUS
Row Labels
Count of 3.Marital
status?
In partnership 20.00%
In partnership 15.00%
Married 20.00%
Married 10.00%
Married 5.00%
Single 20.00%
Single 10.00%
Grand Total 100.00%
Table 3
7
Paraphrase This Document
Need a fresh take? Get an instant paraphrase of this document with our AI Paraphraser
Internet usage 8
In partnership
In partnership
Married
Married
Married
Single
Single
0
0.5
1
1.5
2
2.5
3
3.5
4
4
3
4
2
1
4
2
Internet users by marital status
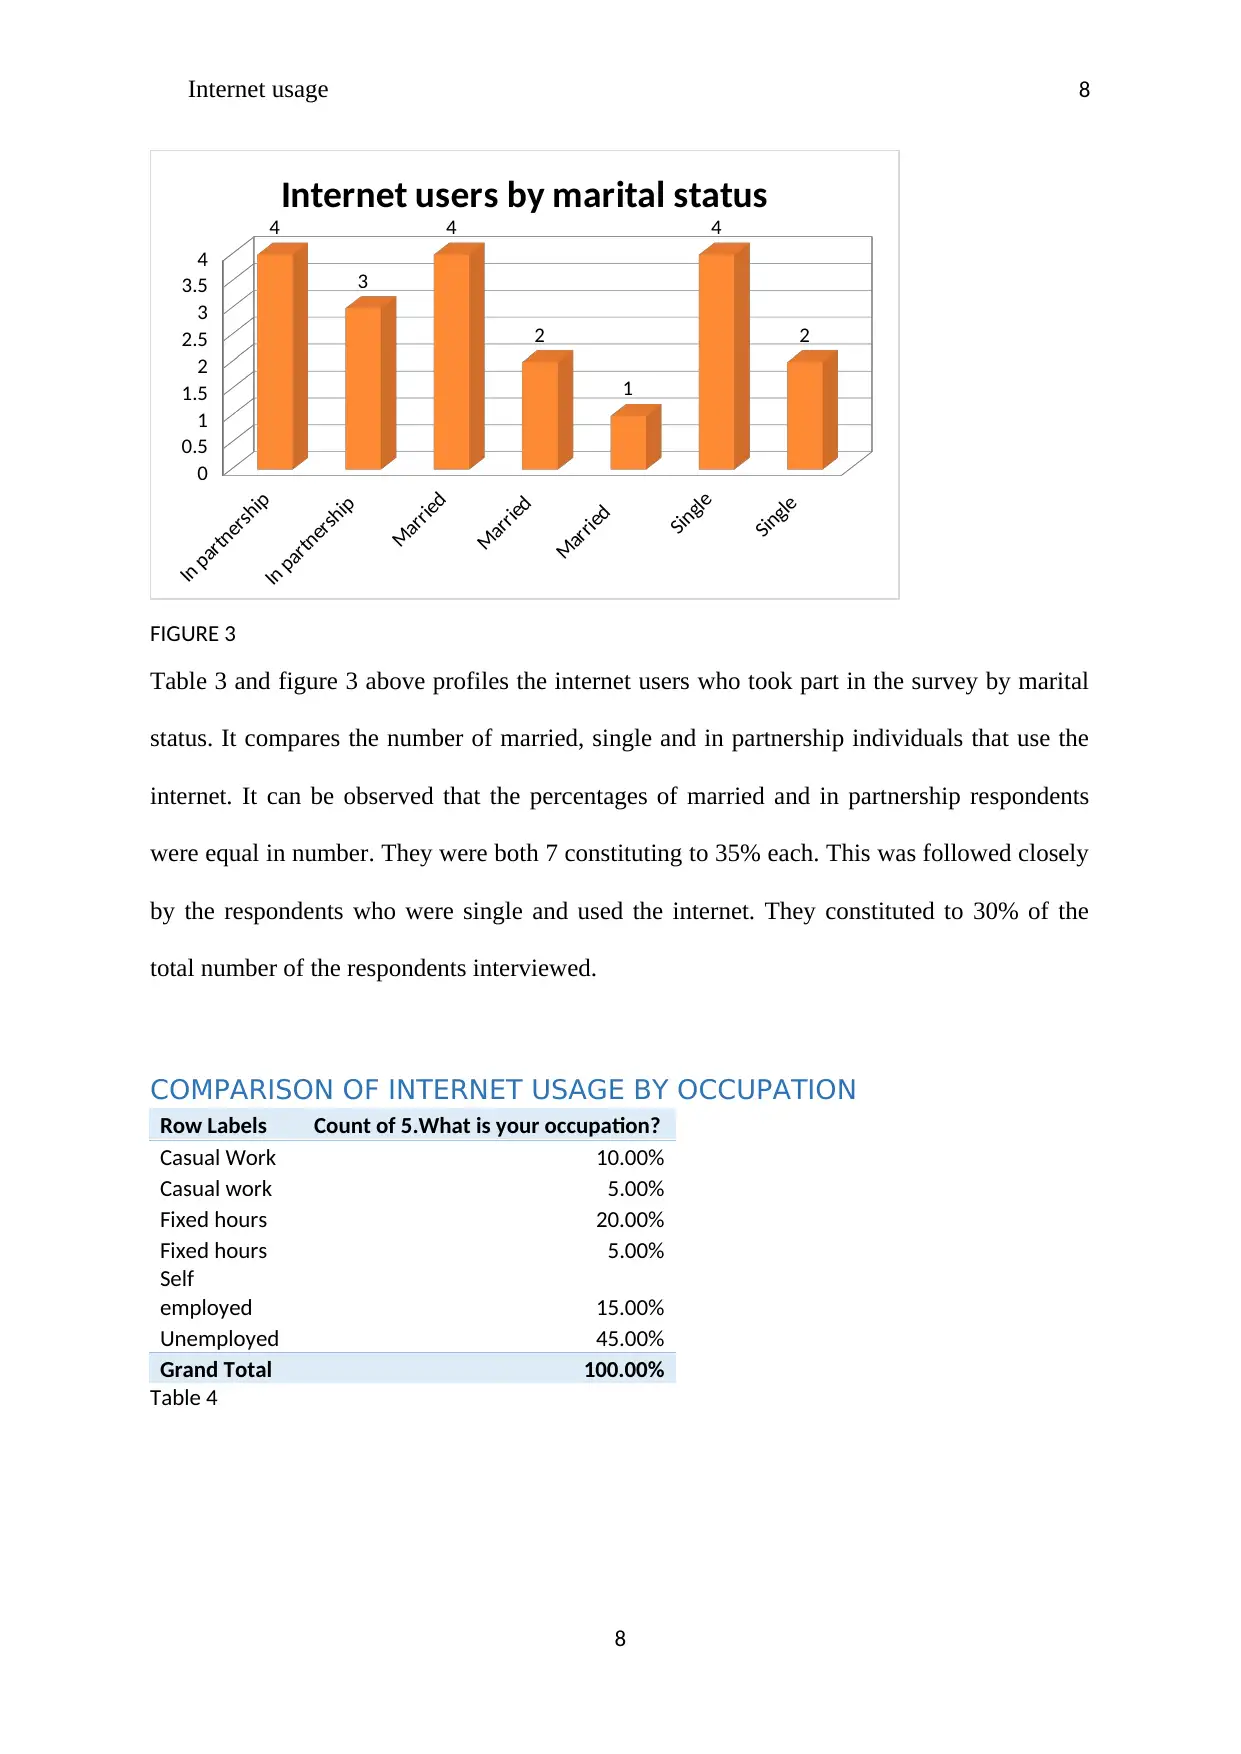
FIGURE 3
Table 3 and figure 3 above profiles the internet users who took part in the survey by marital
status. It compares the number of married, single and in partnership individuals that use the
internet. It can be observed that the percentages of married and in partnership respondents
were equal in number. They were both 7 constituting to 35% each. This was followed closely
by the respondents who were single and used the internet. They constituted to 30% of the
total number of the respondents interviewed.
COMPARISON OF INTERNET USAGE BY OCCUPATION
Row Labels Count of 5.What is your occupation?
Casual Work 10.00%
Casual work 5.00%
Fixed hours 20.00%
Fixed hours 5.00%
Self
employed 15.00%
Unemployed 45.00%
Grand Total 100.00%
Table 4
8
In partnership
In partnership
Married
Married
Married
Single
Single
0
0.5
1
1.5
2
2.5
3
3.5
4
4
3
4
2
1
4
2
Internet users by marital status
FIGURE 3
Table 3 and figure 3 above profiles the internet users who took part in the survey by marital
status. It compares the number of married, single and in partnership individuals that use the
internet. It can be observed that the percentages of married and in partnership respondents
were equal in number. They were both 7 constituting to 35% each. This was followed closely
by the respondents who were single and used the internet. They constituted to 30% of the
total number of the respondents interviewed.
COMPARISON OF INTERNET USAGE BY OCCUPATION
Row Labels Count of 5.What is your occupation?
Casual Work 10.00%
Casual work 5.00%
Fixed hours 20.00%
Fixed hours 5.00%
Self
employed 15.00%
Unemployed 45.00%
Grand Total 100.00%
Table 4
8
Internet usage 9
Casual Work
Casual work
Fixed hours
Fixed hours
Self employed
Unemployed
0
1
2
3
4
5
6
7
8
9
2
1
4
1
3
9
Internet users by occupation
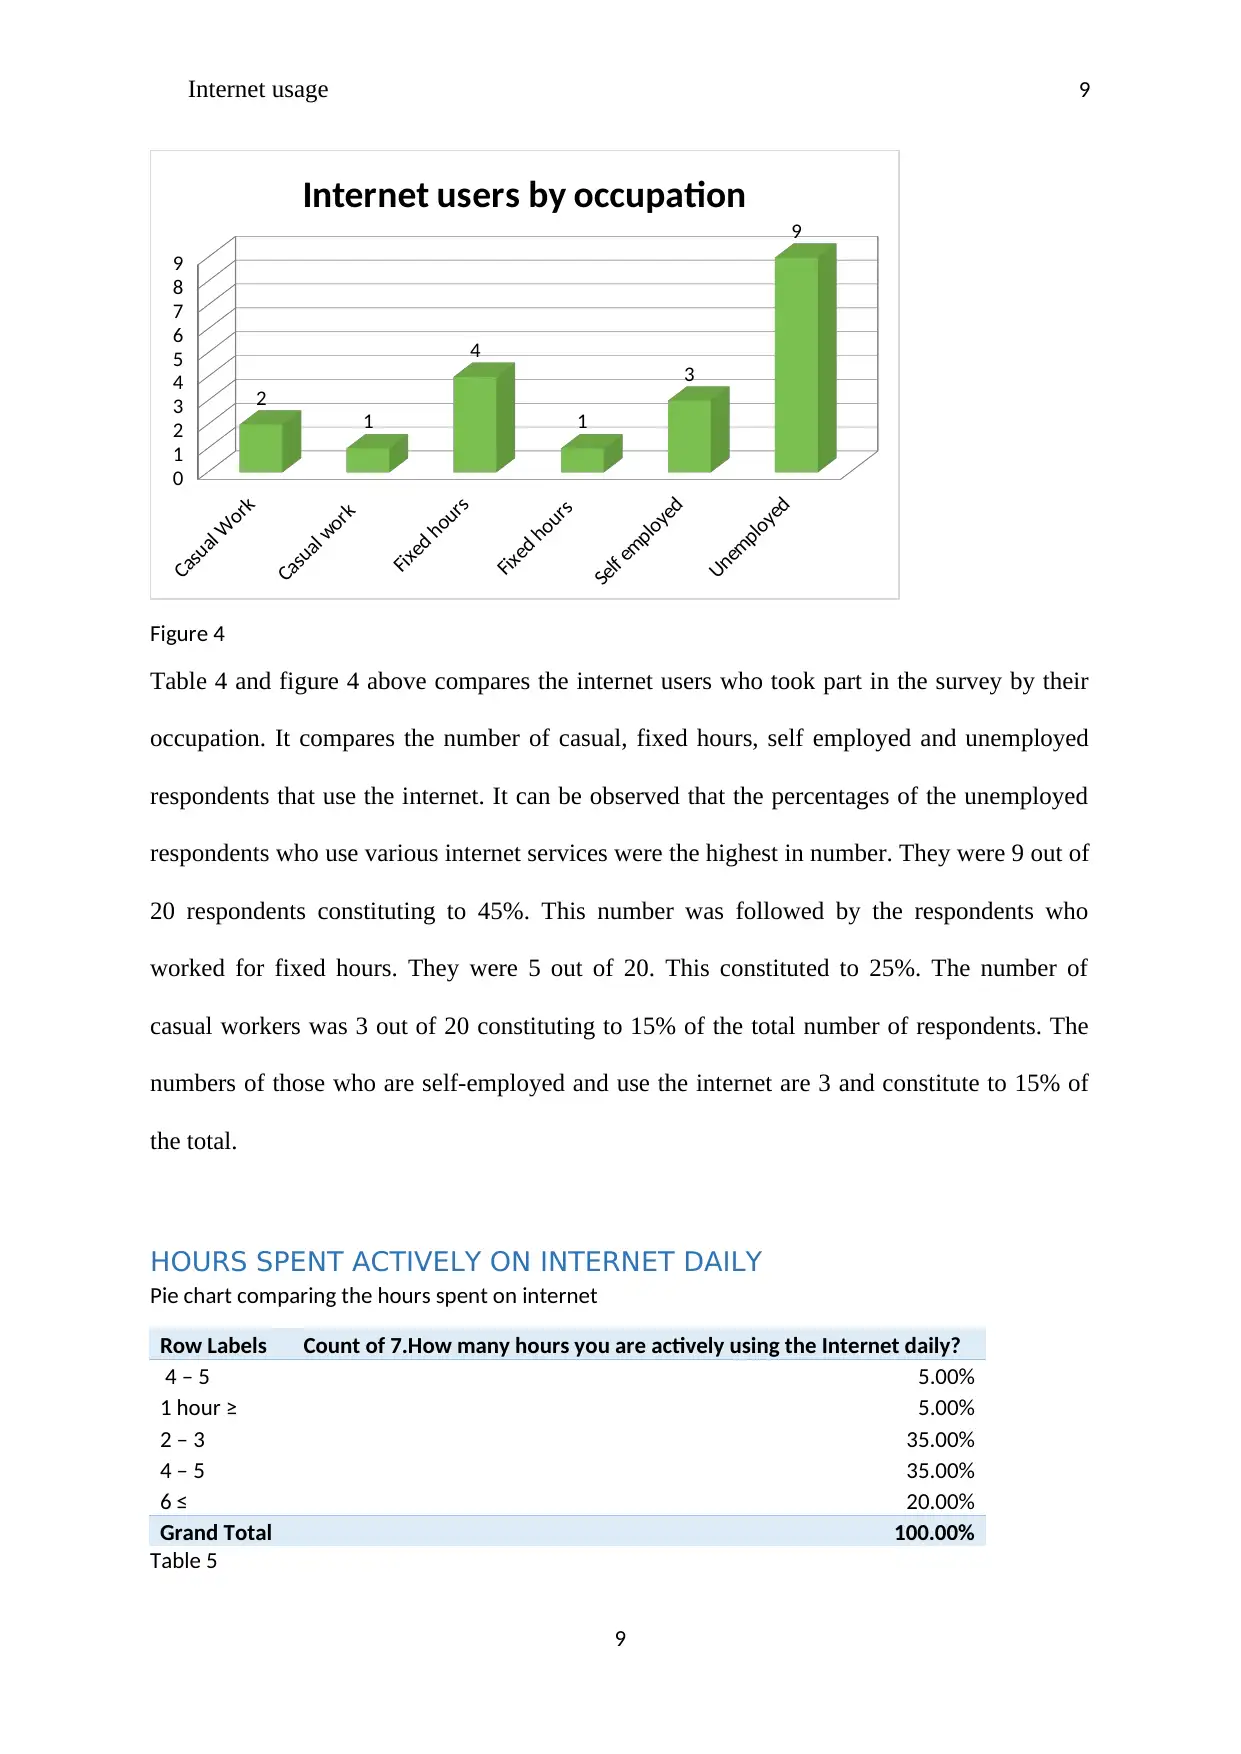
Figure 4
Table 4 and figure 4 above compares the internet users who took part in the survey by their
occupation. It compares the number of casual, fixed hours, self employed and unemployed
respondents that use the internet. It can be observed that the percentages of the unemployed
respondents who use various internet services were the highest in number. They were 9 out of
20 respondents constituting to 45%. This number was followed by the respondents who
worked for fixed hours. They were 5 out of 20. This constituted to 25%. The number of
casual workers was 3 out of 20 constituting to 15% of the total number of respondents. The
numbers of those who are self-employed and use the internet are 3 and constitute to 15% of
the total.
HOURS SPENT ACTIVELY ON INTERNET DAILY
Pie chart comparing the hours spent on internet
Row Labels Count of 7.How many hours you are actively using the Internet daily?
4 – 5 5.00%
1 hour ≥ 5.00%
2 – 3 35.00%
4 – 5 35.00%
6 ≤ 20.00%
Grand Total 100.00%
Table 5
9
Casual Work
Casual work
Fixed hours
Fixed hours
Self employed
Unemployed
0
1
2
3
4
5
6
7
8
9
2
1
4
1
3
9
Internet users by occupation
Figure 4
Table 4 and figure 4 above compares the internet users who took part in the survey by their
occupation. It compares the number of casual, fixed hours, self employed and unemployed
respondents that use the internet. It can be observed that the percentages of the unemployed
respondents who use various internet services were the highest in number. They were 9 out of
20 respondents constituting to 45%. This number was followed by the respondents who
worked for fixed hours. They were 5 out of 20. This constituted to 25%. The number of
casual workers was 3 out of 20 constituting to 15% of the total number of respondents. The
numbers of those who are self-employed and use the internet are 3 and constitute to 15% of
the total.
HOURS SPENT ACTIVELY ON INTERNET DAILY
Pie chart comparing the hours spent on internet
Row Labels Count of 7.How many hours you are actively using the Internet daily?
4 – 5 5.00%
1 hour ≥ 5.00%
2 – 3 35.00%
4 – 5 35.00%
6 ≤ 20.00%
Grand Total 100.00%
Table 5
9
⊘ This is a preview!⊘
Do you want full access?
Subscribe today to unlock all pages.
Trusted by 1+ million students worldwide
Internet usage 10
4 – 5 1 hour
≥
2 – 3
4 – 5
6 ≤
Total
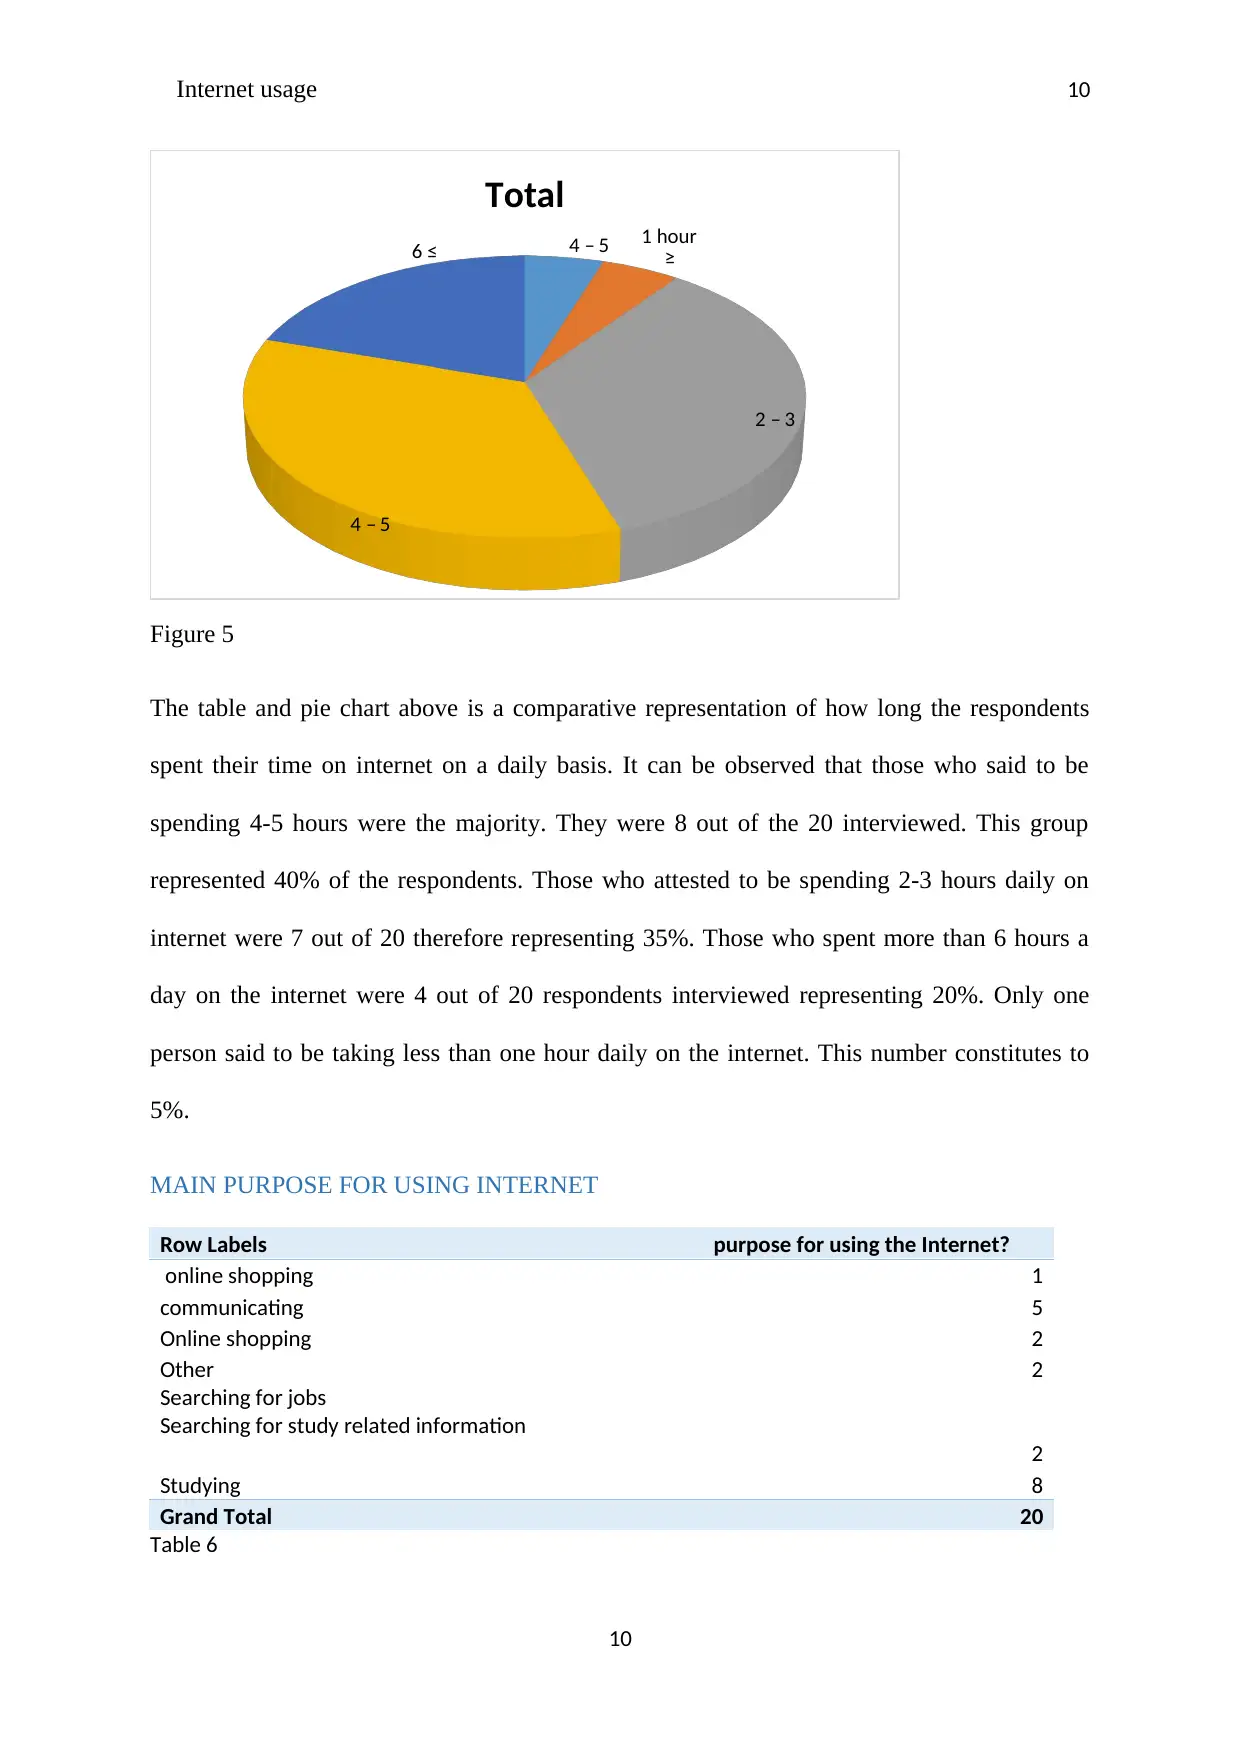
Figure 5
The table and pie chart above is a comparative representation of how long the respondents
spent their time on internet on a daily basis. It can be observed that those who said to be
spending 4-5 hours were the majority. They were 8 out of the 20 interviewed. This group
represented 40% of the respondents. Those who attested to be spending 2-3 hours daily on
internet were 7 out of 20 therefore representing 35%. Those who spent more than 6 hours a
day on the internet were 4 out of 20 respondents interviewed representing 20%. Only one
person said to be taking less than one hour daily on the internet. This number constitutes to
5%.
MAIN PURPOSE FOR USING INTERNET
Row Labels purpose for using the Internet?
online shopping 1
communicating 5
Online shopping 2
Other 2
Searching for jobs
Searching for study related information
2
Studying 8
Grand Total 20
Table 6
10
4 – 5 1 hour
≥
2 – 3
4 – 5
6 ≤
Total
Figure 5
The table and pie chart above is a comparative representation of how long the respondents
spent their time on internet on a daily basis. It can be observed that those who said to be
spending 4-5 hours were the majority. They were 8 out of the 20 interviewed. This group
represented 40% of the respondents. Those who attested to be spending 2-3 hours daily on
internet were 7 out of 20 therefore representing 35%. Those who spent more than 6 hours a
day on the internet were 4 out of 20 respondents interviewed representing 20%. Only one
person said to be taking less than one hour daily on the internet. This number constitutes to
5%.
MAIN PURPOSE FOR USING INTERNET
Row Labels purpose for using the Internet?
online shopping 1
communicating 5
Online shopping 2
Other 2
Searching for jobs
Searching for study related information
2
Studying 8
Grand Total 20
Table 6
10
Paraphrase This Document
Need a fresh take? Get an instant paraphrase of this document with our AI Paraphraser
Internet usage 11
online shopping
5%
communicating
25%
Online shopping
10%
Other
10%
Searching for jobs
oSearching for study
related information
oGo to my social media
account (Face book,
LinkedIn ect.)
10%
Studying
40%
Total
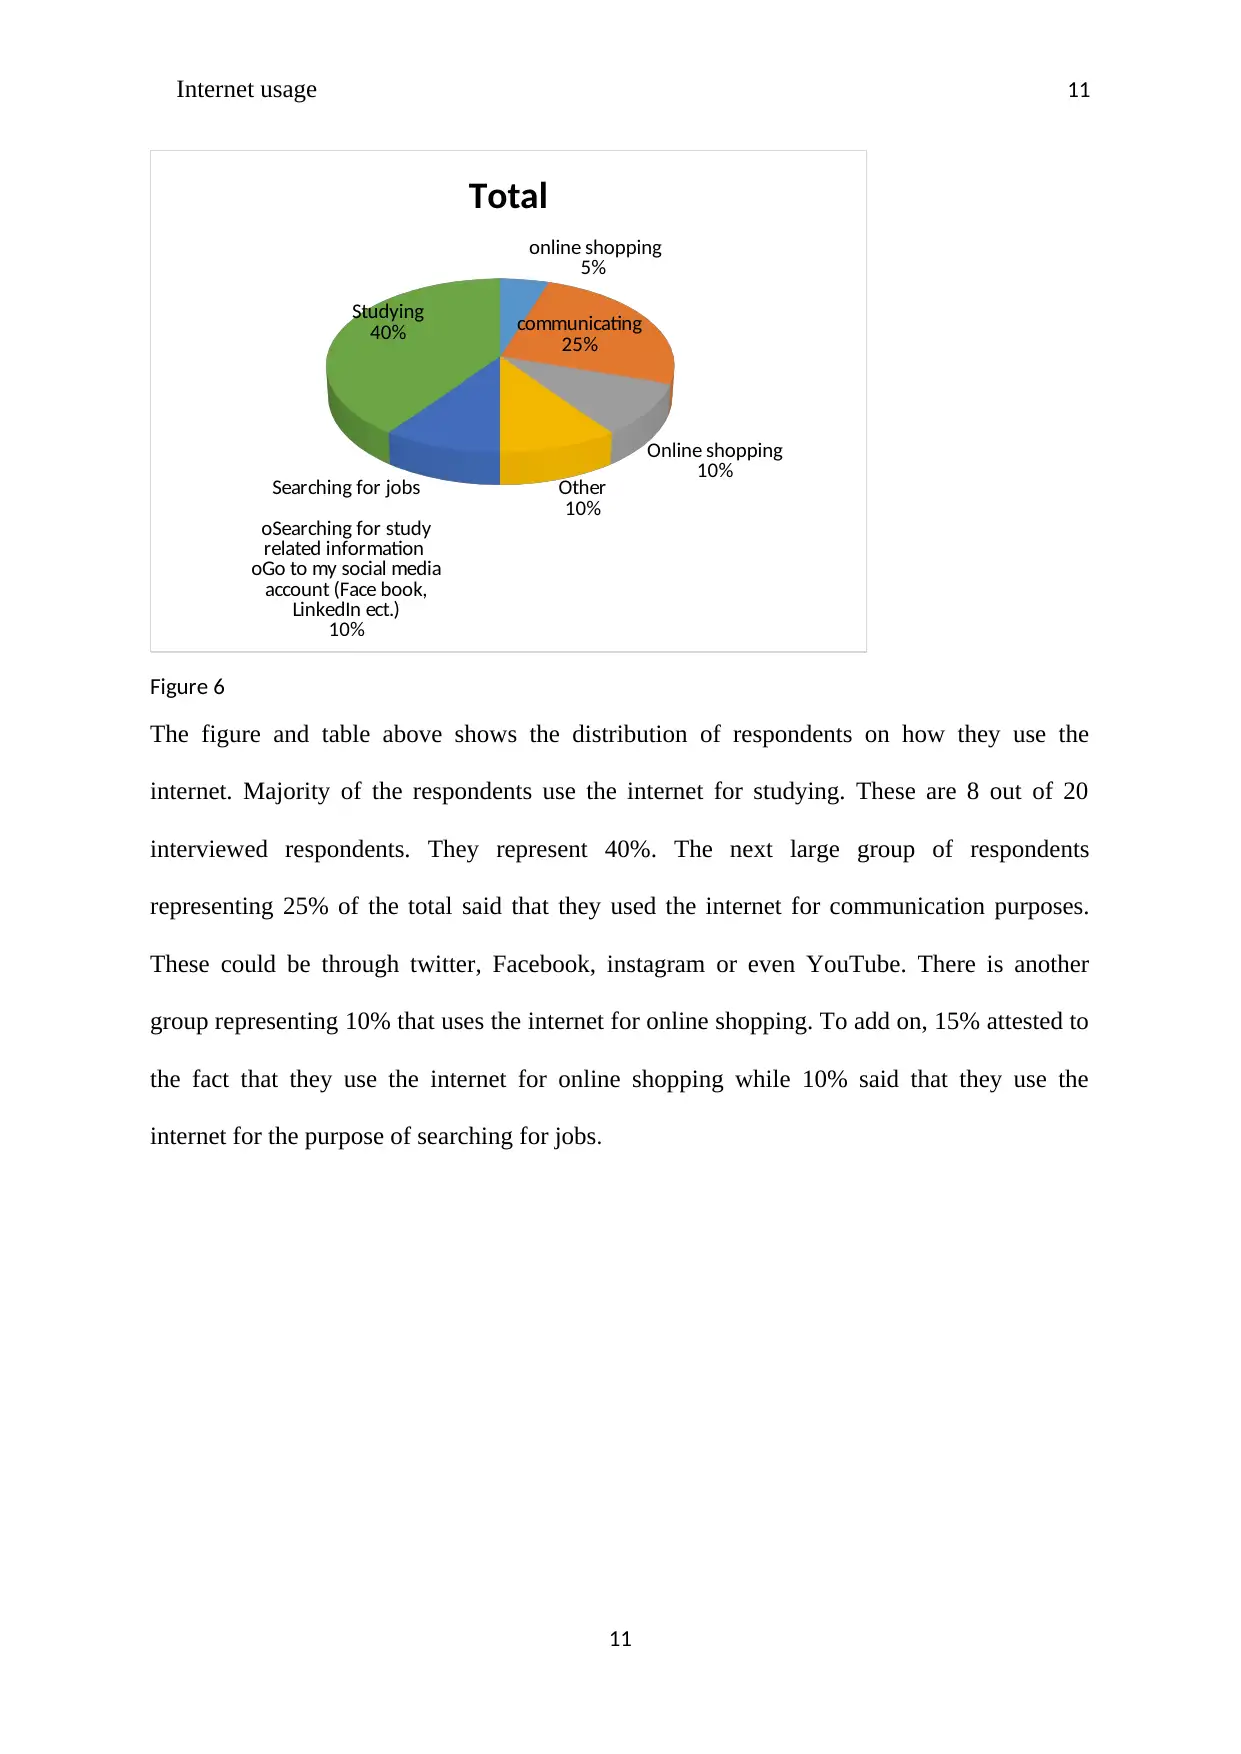
Figure 6
The figure and table above shows the distribution of respondents on how they use the
internet. Majority of the respondents use the internet for studying. These are 8 out of 20
interviewed respondents. They represent 40%. The next large group of respondents
representing 25% of the total said that they used the internet for communication purposes.
These could be through twitter, Facebook, instagram or even YouTube. There is another
group representing 10% that uses the internet for online shopping. To add on, 15% attested to
the fact that they use the internet for online shopping while 10% said that they use the
internet for the purpose of searching for jobs.
11
online shopping
5%
communicating
25%
Online shopping
10%
Other
10%
Searching for jobs
oSearching for study
related information
oGo to my social media
account (Face book,
LinkedIn ect.)
10%
Studying
40%
Total
Figure 6
The figure and table above shows the distribution of respondents on how they use the
internet. Majority of the respondents use the internet for studying. These are 8 out of 20
interviewed respondents. They represent 40%. The next large group of respondents
representing 25% of the total said that they used the internet for communication purposes.
These could be through twitter, Facebook, instagram or even YouTube. There is another
group representing 10% that uses the internet for online shopping. To add on, 15% attested to
the fact that they use the internet for online shopping while 10% said that they use the
internet for the purpose of searching for jobs.
11
Internet usage 12
SOCIAL MEDIA ACCOUNTS USED
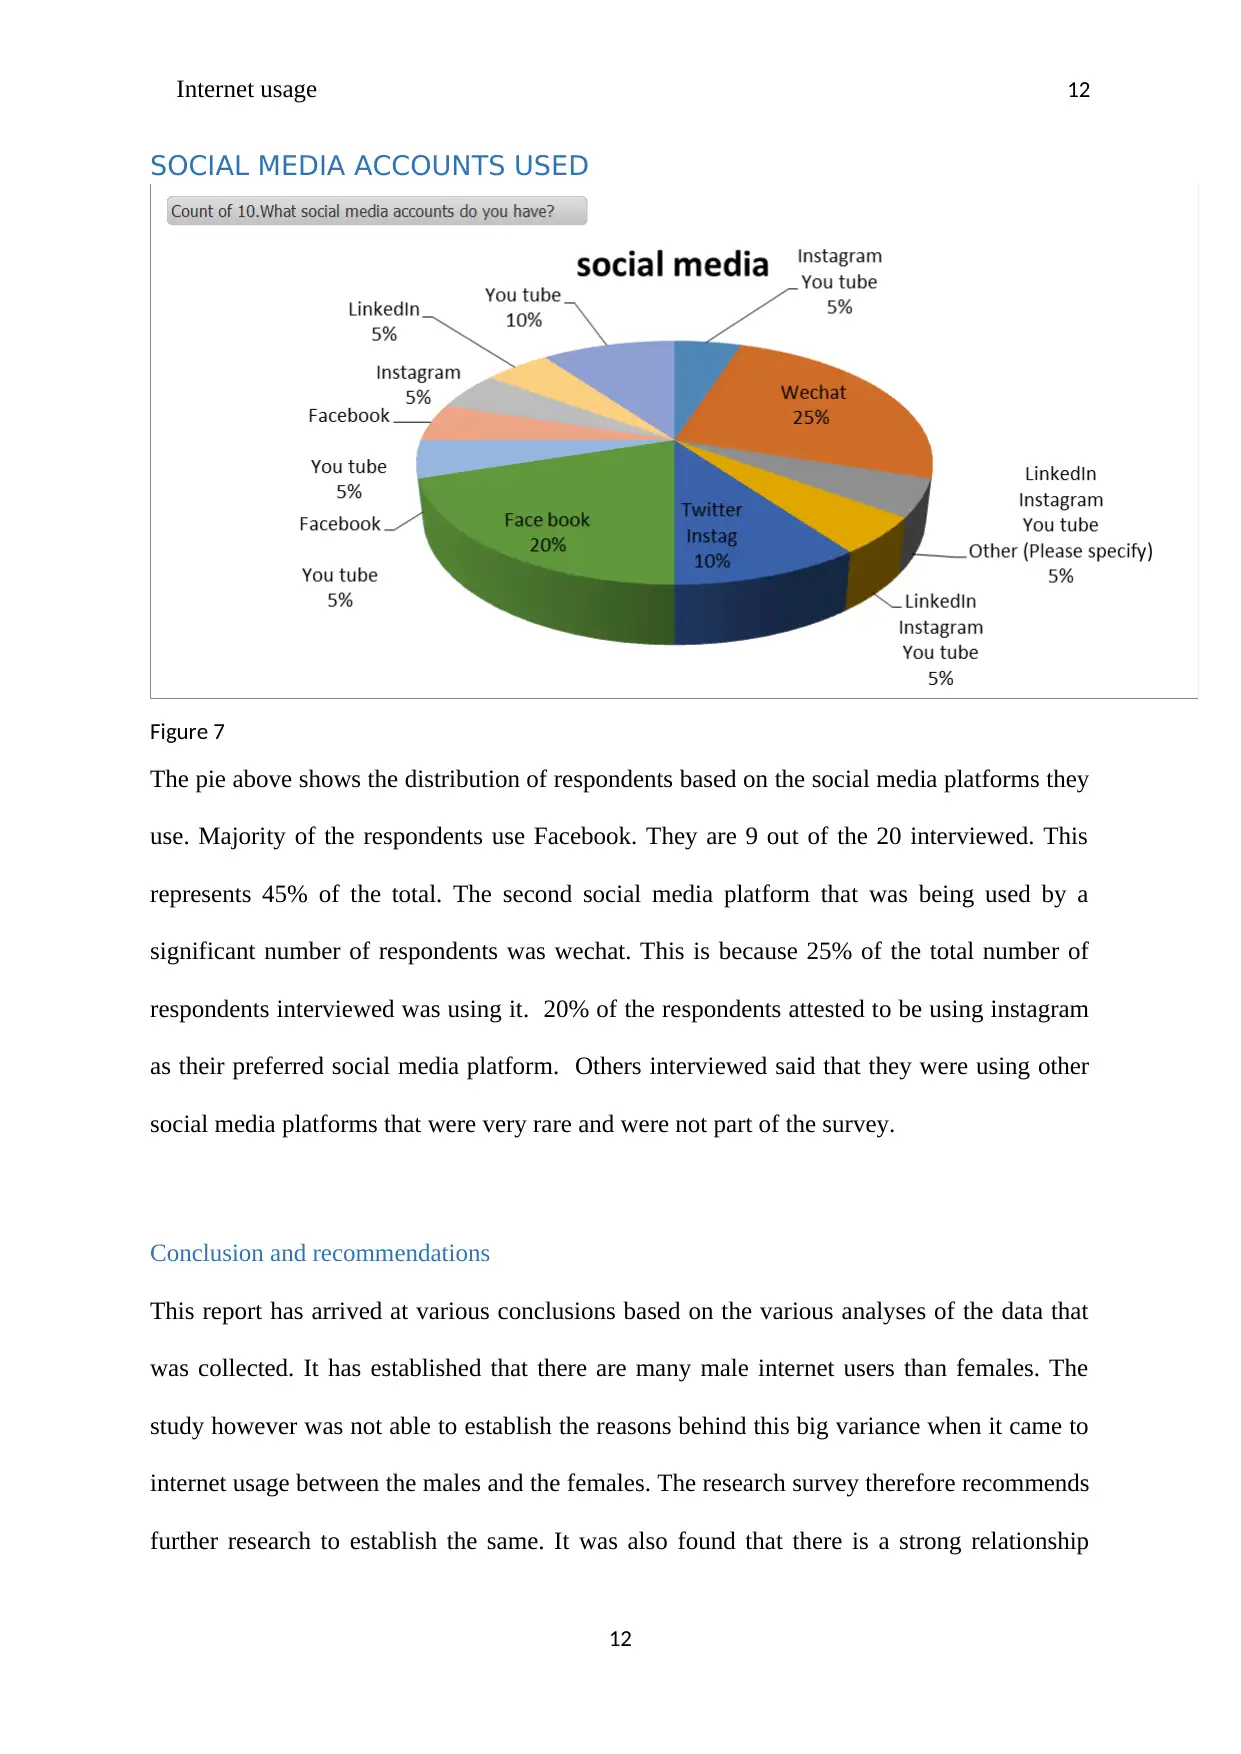
Figure 7
The pie above shows the distribution of respondents based on the social media platforms they
use. Majority of the respondents use Facebook. They are 9 out of the 20 interviewed. This
represents 45% of the total. The second social media platform that was being used by a
significant number of respondents was wechat. This is because 25% of the total number of
respondents interviewed was using it. 20% of the respondents attested to be using instagram
as their preferred social media platform. Others interviewed said that they were using other
social media platforms that were very rare and were not part of the survey.
Conclusion and recommendations
This report has arrived at various conclusions based on the various analyses of the data that
was collected. It has established that there are many male internet users than females. The
study however was not able to establish the reasons behind this big variance when it came to
internet usage between the males and the females. The research survey therefore recommends
further research to establish the same. It was also found that there is a strong relationship
12
SOCIAL MEDIA ACCOUNTS USED
Figure 7
The pie above shows the distribution of respondents based on the social media platforms they
use. Majority of the respondents use Facebook. They are 9 out of the 20 interviewed. This
represents 45% of the total. The second social media platform that was being used by a
significant number of respondents was wechat. This is because 25% of the total number of
respondents interviewed was using it. 20% of the respondents attested to be using instagram
as their preferred social media platform. Others interviewed said that they were using other
social media platforms that were very rare and were not part of the survey.
Conclusion and recommendations
This report has arrived at various conclusions based on the various analyses of the data that
was collected. It has established that there are many male internet users than females. The
study however was not able to establish the reasons behind this big variance when it came to
internet usage between the males and the females. The research survey therefore recommends
further research to establish the same. It was also found that there is a strong relationship
12
⊘ This is a preview!⊘
Do you want full access?
Subscribe today to unlock all pages.
Trusted by 1+ million students worldwide
1 out of 14
Related Documents


Your All-in-One AI-Powered Toolkit for Academic Success.
+13062052269
info@desklib.com
Available 24*7 on WhatsApp / Email
![[object Object]](/_next/static/media/star-bottom.7253800d.svg)
Unlock your academic potential
Copyright © 2020–2026 A2Z Services. All Rights Reserved. Developed and managed by ZUCOL.