STAT6000 Assignment: Analyzing Statistical Methods in Research Papers
VerifiedAdded on 2022/10/14
|11
|2567
|230
Homework Assignment
AI Summary
This assignment involves a detailed analysis of two research articles, focusing on the application and interpretation of statistical methods. The first paper explores the use of alcohol and drugs among adolescents, examining hypothesis testing, variables, sampling methods (convenience sampling), demographic characteristics, and inferential statistics like the Wilcoxon signed rank test and logistic regression, along with the calculation of odds ratios. The second paper investigates the prevalence of diabetes mellitus, also delving into demographics, inferential statistics (multivariate and logistic regression models), findings related to age, gender, income, and the calculation and interpretation of odds ratios. The assignment requires an understanding of inferential statistics, hypothesis generation, and the limitations of sampling techniques, ultimately assessing the student's ability to interpret and evaluate statistical data presented in research contexts. Both papers used inferential statistics to draw conclusions about the population based on sample data. The assignment requires a deep understanding of statistical concepts and their practical application.
Running header: Statistics 1
Identifying and Interpreting Statistics in Research Articles
Name:
Institution:
Identifying and Interpreting Statistics in Research Articles
Name:
Institution:
Paraphrase This Document
Need a fresh take? Get an instant paraphrase of this document with our AI Paraphraser
Statistics 2
Paper 1
Question 1: State the two hypothesis and the explain the variables
Notably, the hypothesis of a study is derived from the aim and objectives of the research,
thus primal objective of the study is to the difference in the level of alcohol and other drugs
usage among the adolescents that attend the teenage celebratory events and the end of school
celebration (Lam, Liang, Chikritzhs, & Allsop, 2013). On the other hand, the study seeks to
exhibit the relationship between harmful experiences among the adolescents during the events
due to the use of alcohol and other drugs, and the adoption of harm-minimization strategies. As a
result, two hypotheses are generated from the objectives, which include
1. Null Hypothesis: The use of alcohol and other drugs among adolescent in the teenage
celebratory events does not differ from the end of school celebration.
Alternative Hypothesis: The consumption of alcohol and other drugs among
adolescent at teenage celebratory events differs from the end of school celebration.
The response variable associated with the above hypothesis is the quantity or amount of
alcohol or drug consumed whereas the explanatory variable is the events, which include end of
school celebration and teenage celebratory events.
2. Null hypothesis: There is no association between the harmful experiences due to the
consumption of alcohol and other drugs, and the intervention of harm-reduction
methods.
Alternative hypothesis: Presence of association between the harmful experiences due
to the consumption of alcohol and other drugs, and the intervention of harm-
minimization strategies.
Statistics 3
Explanatory variables linked to the above hypothesis include the protective behavior
strategy, mean use of alcohol and other drugs, and accommodation whereas response variables
include regrettable sexual encounters, vandalism, hangover, accidents or injury, and emotional
outburst among others.
Question 2: Sampling method used, its advantages and disadvantages
The study used the convenience sampling strategy, whereby the sample is drawn from the
population on the basis of opportunity. Notably, this is a non-probabilistic technique that
depends on subjects conveniently available for the research (Özdemir, Louis, & Topbaş, 2011).
There are various advantages associated with this method, which include high flexibility, less
costly, and applicable in a limited time schedule (Clark, et al., 2014). Moreover, the method aids
in providing efficient qualitative information. On the other hand, there are numerous
disadvantages linked to this technique, which include biasness, generalization of the entire
population, and inability to access precision and reliability of the data (Kivunja, 2015). Besides,
the subjectivity of the methods inhibits the measurement of changes with time (Hedt & Pagano,
2011).
Question3: Demographic Characteristics of the Sample
Demographics are attributes of a given sample, which include ethnicity, gender, age,
race, geographical area, educational attainment, and income level, among others (NM-IBIS,
2018). Therefore, the demographics exhibited in the study include age whereby 91% of the
respondents were aged 17 whereas 9% were aged 18 years; moreover, gender was incorporated
in the research, whereby 56% were female and 46% were males (Lam, Liang, Chikritzhs, &
Allsop, 2013). Besides, it is evident that the daily mean of Australian SDs linked to males and
females was 18.44 and 13.24 respectively. Notably, the study factored both education attainment
⊘ This is a preview!⊘
Do you want full access?
Subscribe today to unlock all pages.
Trusted by 1+ million students worldwide
Statistics 4
and geographical area whereby the participants planned or attended the 2009 school leavers’
celebrations on Rottnest Island.
Question 4: Inferential Statistics
Inferential statistics is a component of statistics that uses the characteristics of the sample
to draw or make conclusions about the population, particularly when the population is
inaccessible or too big (Stephanie, 2014). There are two particulars of inferential statistics, which
include hypothesis testing and parameter estimation. As evident, the study used the Wilcoxon
signed rank test to compare use of alcohol and other drugs between end of teenage celebratory
events and the end of school celebration (paired sample). Notably, Wilcoxon signed rank test is a
non-parametric test that uses the average of two response variables to explore any significant
difference (McDonald, 2014). Moreover, the test is an alternative technique for other tests, which
include t-test for dependent sample, paired students’ t-test or a matched paired t-test in cases
whereby the population is asymmetric (McDonald, 2014). Furthermore, the test is applicable
when the data is transformed to assume a normal distribution.
Consequently, the study incorporated a logistic regression model that exhibited the
effects of the six factors on the likelihood linked to the seventeen harmful experiences. The
above regression model is applicable in cases whereby the response variable is categorical;
moreover, the technique is effective when the research incorporates more than two explanatory
variables (Swaminathan, 2018).
Question 5: Odds Ratio
Odds ratio is a measure exhibiting the level of association between an outcome or event
and exposure. The measure represents the odds that an outcome will occur at a given condition
compared to the odds of the event in the absence of the condition (Szumilas, 2010). Notably,
Paraphrase This Document
Need a fresh take? Get an instant paraphrase of this document with our AI Paraphraser
Statistics 5
case control studies tend to use this method. Therefore, the OR of having unprotected sex
compared to those having in safety strategy with the highest occurence is 10.92. The odds exhibit
that respondents with high scores are 10.92 times likely to have unprotected sex than people with
low scores. Moreover, the model controlled various variables, which include consumption of
other drugs was none, safety strategy was applicable to females, the alcohol consumption was 0-
6DSs, and online use of survey modality.
Question 6: Sample representative of the Population
As evident, one of the disadvantages of convenience sampling is the biasness thus not a
good representative of the population. For instance, the respondent may not have provided the
accurate response when examining the harmful impacts and management strategies of alcohol
consumption and use of other drugs. However, the study curbs this challenge through repeated
tests thus the sample represents the general population of schoolers.
Statistics 6
Paper 2
Question 1: Aim and hypothesis of the Study
Notably, the hypothesis of a study is derived from the aim and objectives of the research,
thus primal objective of the research is to expose the prevalence of self-reported cases of
diabetes mellitus in a given time schedule (2001 to 2008) and exhibit the risk factors associated
with the disease (Wong, Leung, Tsang, Lo, & Griffiths, 2013). Moreover, the study seeks to
exhibit if the territory distribution of the disease represents the general population of Hong Kong.
As a result, the following hypothesis are generated from the objective.
Null hypothesis: Absence of relationship between the prevalence of self-reported cases of
diabetes mellitus and the risk factors associated with the disease.
Alternative hypothesis: There is a relationship between the prevalence of self-reported
cases of diabetes mellitus and the risk factors associated with the disease.
Question 2: Demographic characteristics
Demographics are attributes of a given sample, which include ethnicity, gender, age,
race, geographical area, educational attainment, and income level, among others (NM-IBIS,
2018). Therefore, the demographics exhibited in the study include gender whereby 60,064 male
and 61,831 respondents were incorporated in the study. Furthermore, the mean age of the
121,895 participants is 38.2 years; besides, the 103,367 respondents were adults of age 15 year
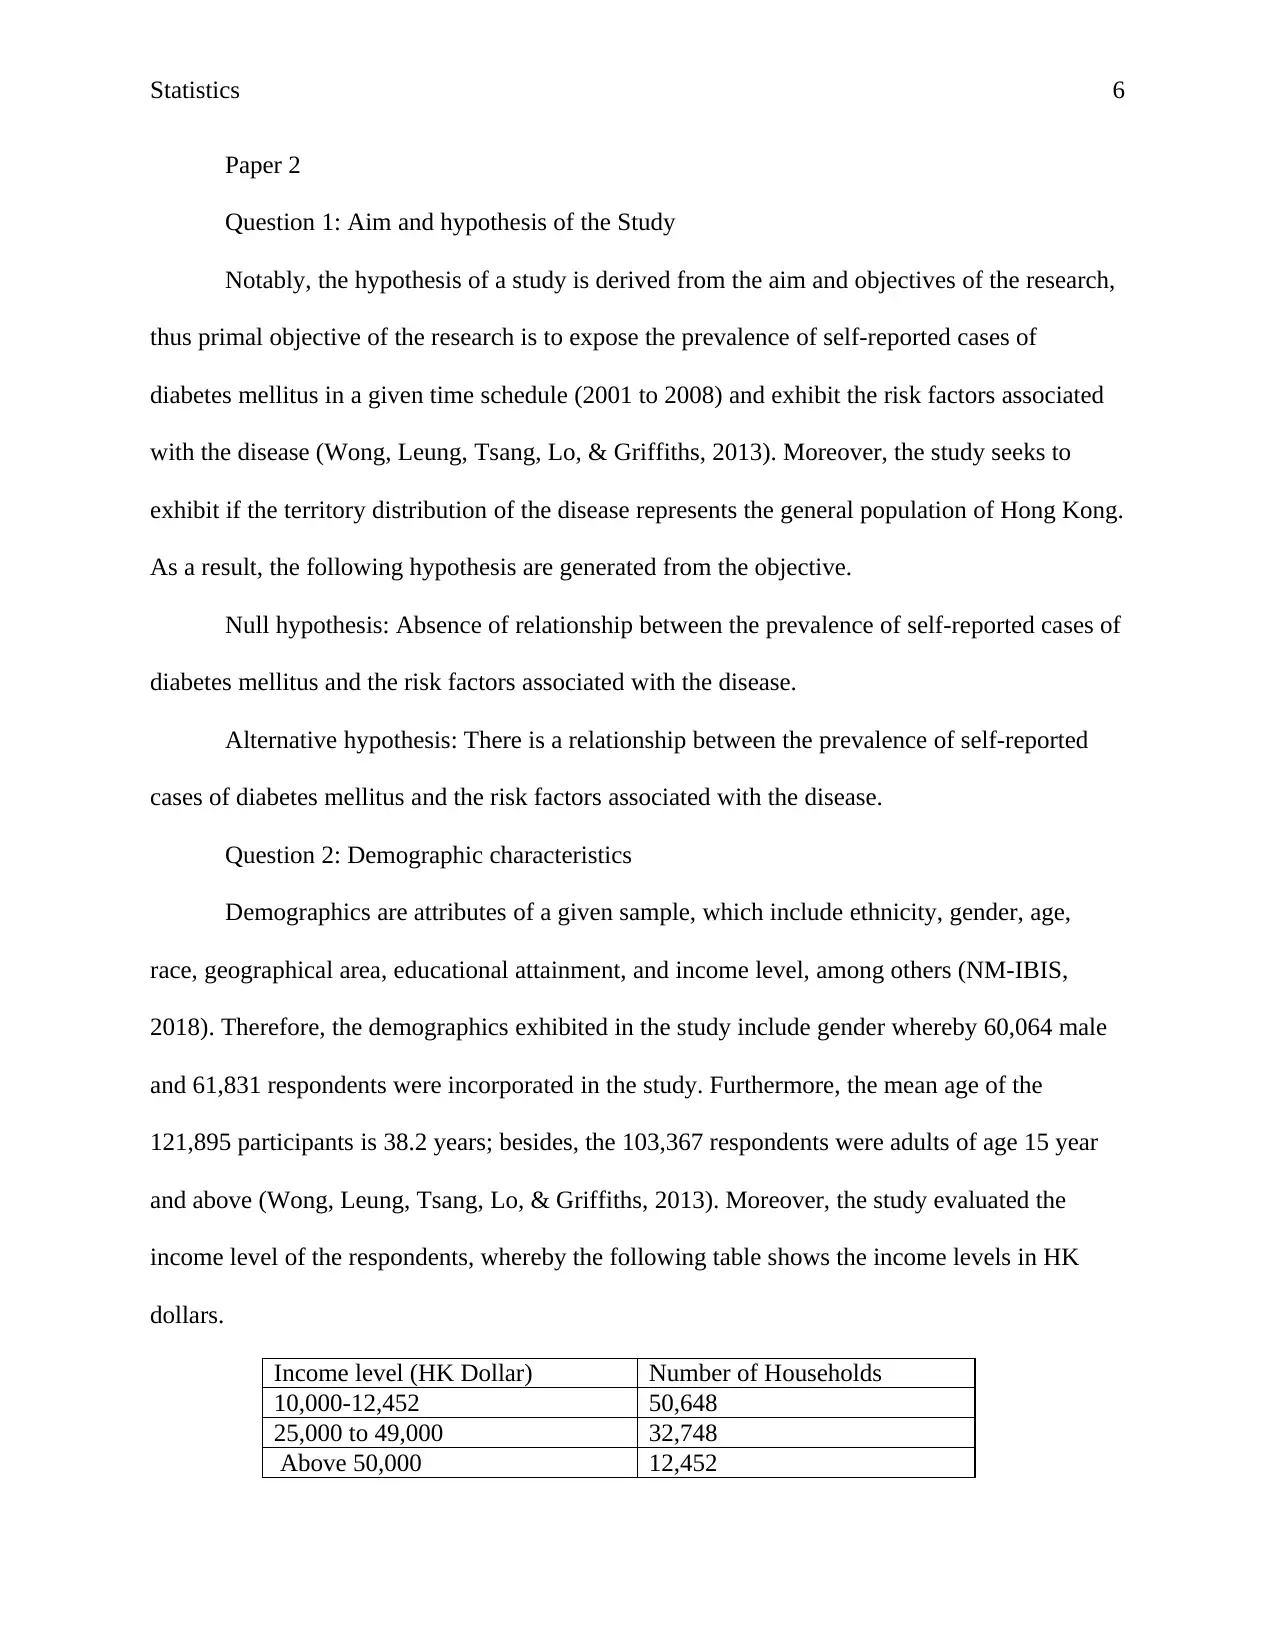
and above (Wong, Leung, Tsang, Lo, & Griffiths, 2013). Moreover, the study evaluated the
income level of the respondents, whereby the following table shows the income levels in HK
dollars.
Income level (HK Dollar) Number of Households
10,000-12,452 50,648
25,000 to 49,000 32,748
Above 50,000 12,452
Paper 2
Question 1: Aim and hypothesis of the Study
Notably, the hypothesis of a study is derived from the aim and objectives of the research,
thus primal objective of the research is to expose the prevalence of self-reported cases of
diabetes mellitus in a given time schedule (2001 to 2008) and exhibit the risk factors associated
with the disease (Wong, Leung, Tsang, Lo, & Griffiths, 2013). Moreover, the study seeks to
exhibit if the territory distribution of the disease represents the general population of Hong Kong.
As a result, the following hypothesis are generated from the objective.
Null hypothesis: Absence of relationship between the prevalence of self-reported cases of
diabetes mellitus and the risk factors associated with the disease.
Alternative hypothesis: There is a relationship between the prevalence of self-reported
cases of diabetes mellitus and the risk factors associated with the disease.
Question 2: Demographic characteristics
Demographics are attributes of a given sample, which include ethnicity, gender, age,
race, geographical area, educational attainment, and income level, among others (NM-IBIS,
2018). Therefore, the demographics exhibited in the study include gender whereby 60,064 male
and 61,831 respondents were incorporated in the study. Furthermore, the mean age of the
121,895 participants is 38.2 years; besides, the 103,367 respondents were adults of age 15 year
and above (Wong, Leung, Tsang, Lo, & Griffiths, 2013). Moreover, the study evaluated the
income level of the respondents, whereby the following table shows the income levels in HK
dollars.
Income level (HK Dollar) Number of Households
10,000-12,452 50,648
25,000 to 49,000 32,748
Above 50,000 12,452
⊘ This is a preview!⊘
Do you want full access?
Subscribe today to unlock all pages.
Trusted by 1+ million students worldwide
Statistics 7
Question 3: Inferential Statistics
Inferential statistics is a component of statistics that uses the characteristics of the sample
to draw or make conclusions about the population, particularly when the population is
inaccessible or too big (Stephanie, 2014). Consequently, there are two components of inferential
statistics, which include hypothesis testing and parameter estimation. As exhibited, the study
used both the multivariate and logistic regression model, whereby the dependent variable was the
prevalence of the diabetes mellitus whereas the independent variables include gender, age, and
monthly household income. The logistic regression model is applicable in cases whereby the
response variable is categorical; moreover, the technique is effective when the research
incorporates more than two explanatory variables (Swaminathan, 2018). On the other hand,
multivariate model applicable in cases whereby there is more than one response variables.
Notably, the predictor variables did not exhibit multicollinearity.
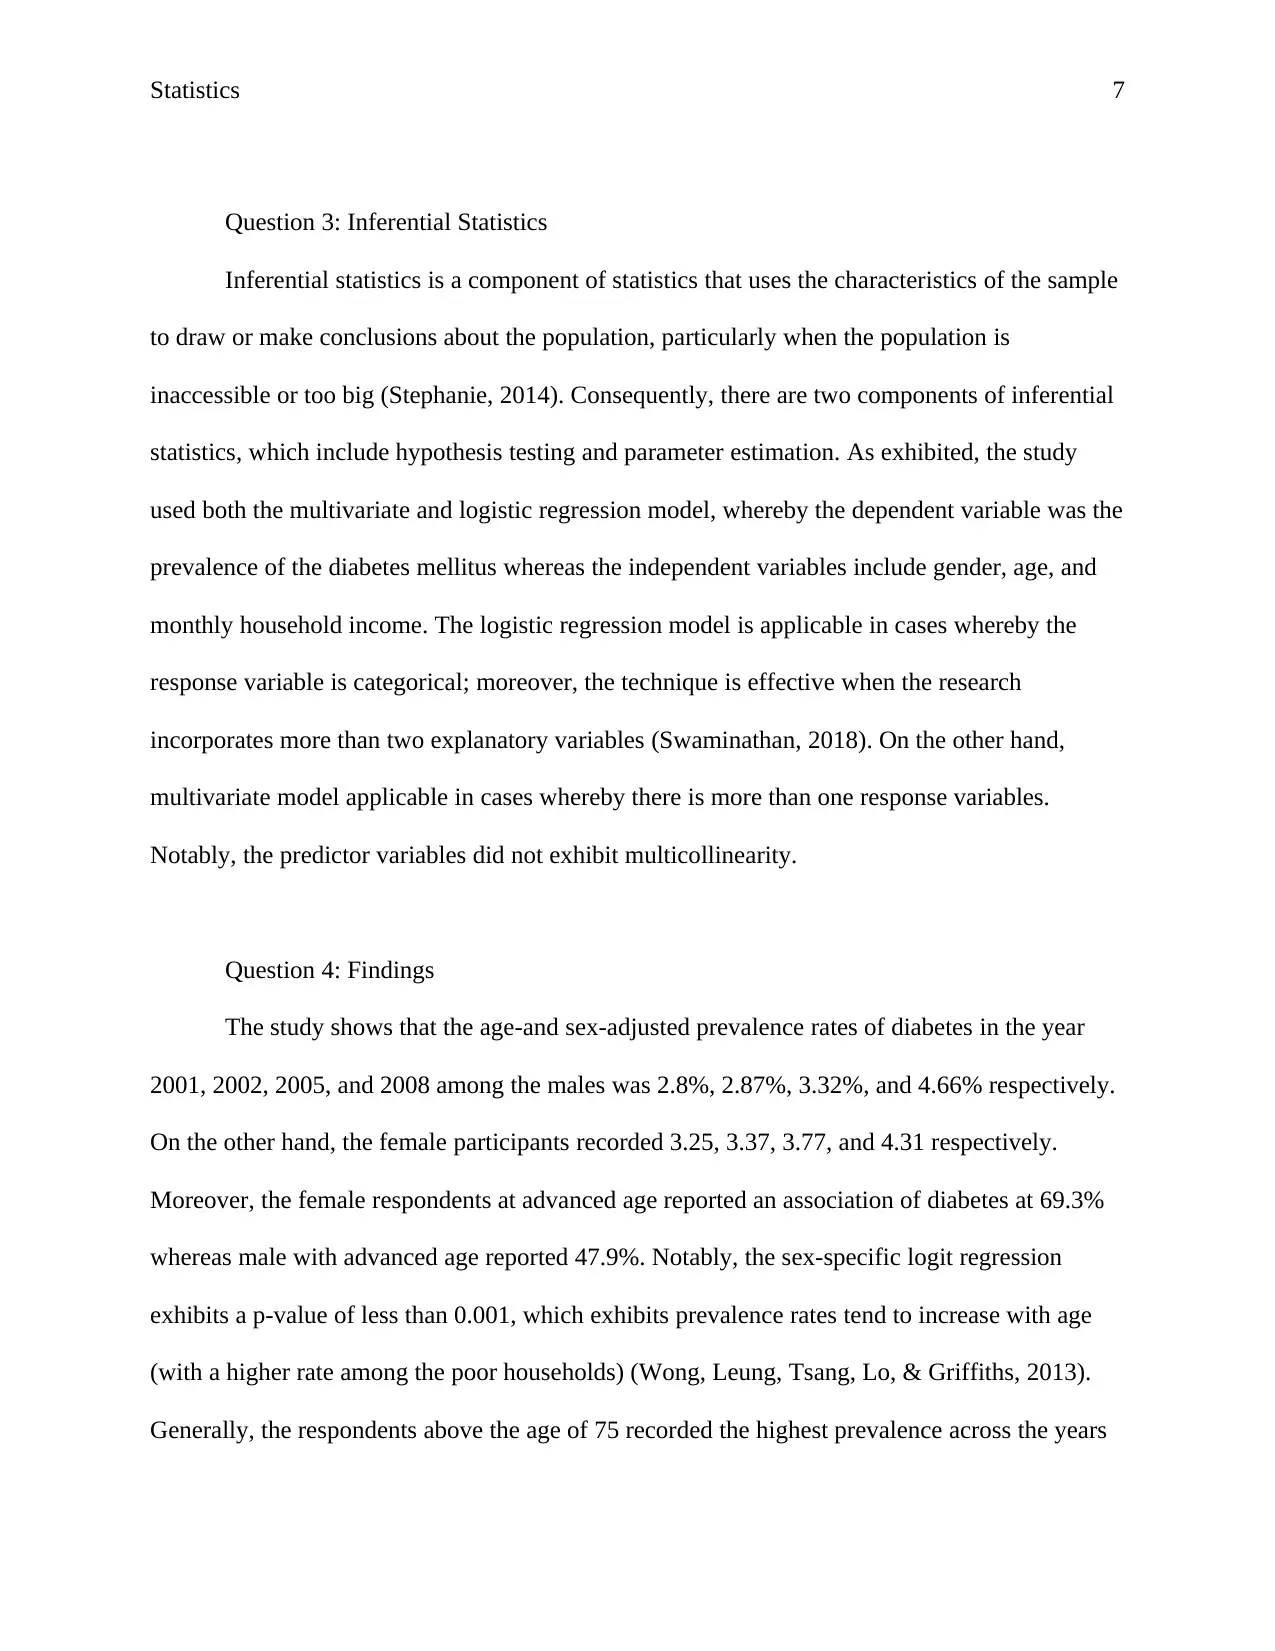
Question 4: Findings
The study shows that the age-and sex-adjusted prevalence rates of diabetes in the year
2001, 2002, 2005, and 2008 among the males was 2.8%, 2.87%, 3.32%, and 4.66% respectively.
On the other hand, the female participants recorded 3.25, 3.37, 3.77, and 4.31 respectively.
Moreover, the female respondents at advanced age reported an association of diabetes at 69.3%
whereas male with advanced age reported 47.9%. Notably, the sex-specific logit regression
exhibits a p-value of less than 0.001, which exhibits prevalence rates tend to increase with age
(with a higher rate among the poor households) (Wong, Leung, Tsang, Lo, & Griffiths, 2013).
Generally, the respondents above the age of 75 recorded the highest prevalence across the years
Question 3: Inferential Statistics
Inferential statistics is a component of statistics that uses the characteristics of the sample
to draw or make conclusions about the population, particularly when the population is
inaccessible or too big (Stephanie, 2014). Consequently, there are two components of inferential
statistics, which include hypothesis testing and parameter estimation. As exhibited, the study
used both the multivariate and logistic regression model, whereby the dependent variable was the
prevalence of the diabetes mellitus whereas the independent variables include gender, age, and
monthly household income. The logistic regression model is applicable in cases whereby the
response variable is categorical; moreover, the technique is effective when the research
incorporates more than two explanatory variables (Swaminathan, 2018). On the other hand,
multivariate model applicable in cases whereby there is more than one response variables.
Notably, the predictor variables did not exhibit multicollinearity.
Question 4: Findings
The study shows that the age-and sex-adjusted prevalence rates of diabetes in the year
2001, 2002, 2005, and 2008 among the males was 2.8%, 2.87%, 3.32%, and 4.66% respectively.
On the other hand, the female participants recorded 3.25, 3.37, 3.77, and 4.31 respectively.
Moreover, the female respondents at advanced age reported an association of diabetes at 69.3%
whereas male with advanced age reported 47.9%. Notably, the sex-specific logit regression
exhibits a p-value of less than 0.001, which exhibits prevalence rates tend to increase with age
(with a higher rate among the poor households) (Wong, Leung, Tsang, Lo, & Griffiths, 2013).
Generally, the respondents above the age of 75 recorded the highest prevalence across the years
Paraphrase This Document
Need a fresh take? Get an instant paraphrase of this document with our AI Paraphraser
Statistics 8
(2001 to 2008) and male participants recorded lower prevalence compared to female participants.
Moreover, the binary logistic regression shows that age and monthly income are significantly
associated with the prevalence rates of diabetes.
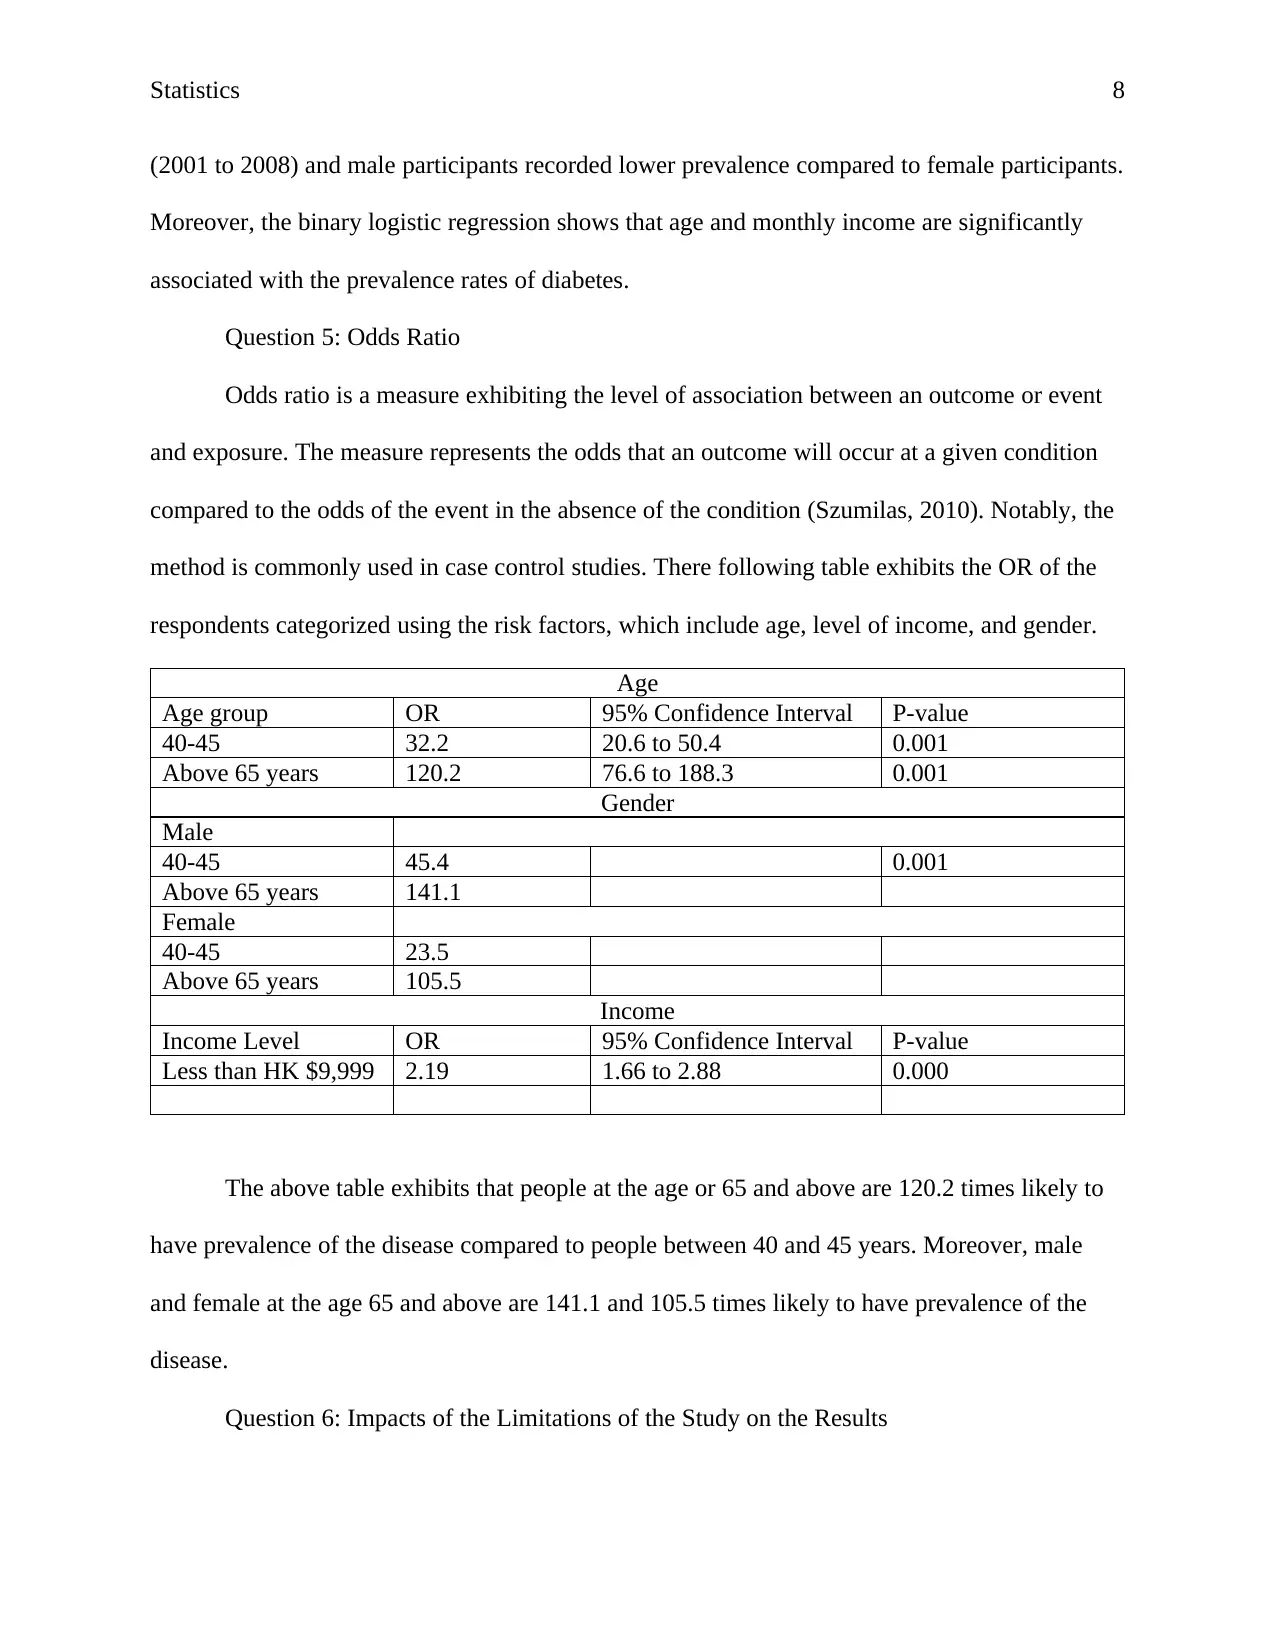
Question 5: Odds Ratio
Odds ratio is a measure exhibiting the level of association between an outcome or event
and exposure. The measure represents the odds that an outcome will occur at a given condition
compared to the odds of the event in the absence of the condition (Szumilas, 2010). Notably, the
method is commonly used in case control studies. There following table exhibits the OR of the
respondents categorized using the risk factors, which include age, level of income, and gender.
Age
Age group OR 95% Confidence Interval P-value
40-45 32.2 20.6 to 50.4 0.001
Above 65 years 120.2 76.6 to 188.3 0.001
Gender
Male
40-45 45.4 0.001
Above 65 years 141.1
Female
40-45 23.5
Above 65 years 105.5
Income
Income Level OR 95% Confidence Interval P-value
Less than HK $9,999 2.19 1.66 to 2.88 0.000
The above table exhibits that people at the age or 65 and above are 120.2 times likely to
have prevalence of the disease compared to people between 40 and 45 years. Moreover, male
and female at the age 65 and above are 141.1 and 105.5 times likely to have prevalence of the
disease.
Question 6: Impacts of the Limitations of the Study on the Results
(2001 to 2008) and male participants recorded lower prevalence compared to female participants.
Moreover, the binary logistic regression shows that age and monthly income are significantly
associated with the prevalence rates of diabetes.
Question 5: Odds Ratio
Odds ratio is a measure exhibiting the level of association between an outcome or event
and exposure. The measure represents the odds that an outcome will occur at a given condition
compared to the odds of the event in the absence of the condition (Szumilas, 2010). Notably, the
method is commonly used in case control studies. There following table exhibits the OR of the
respondents categorized using the risk factors, which include age, level of income, and gender.
Age
Age group OR 95% Confidence Interval P-value
40-45 32.2 20.6 to 50.4 0.001
Above 65 years 120.2 76.6 to 188.3 0.001
Gender
Male
40-45 45.4 0.001
Above 65 years 141.1
Female
40-45 23.5
Above 65 years 105.5
Income
Income Level OR 95% Confidence Interval P-value
Less than HK $9,999 2.19 1.66 to 2.88 0.000
The above table exhibits that people at the age or 65 and above are 120.2 times likely to
have prevalence of the disease compared to people between 40 and 45 years. Moreover, male
and female at the age 65 and above are 141.1 and 105.5 times likely to have prevalence of the
disease.
Question 6: Impacts of the Limitations of the Study on the Results
Statistics 9
As evident, the study used stratified random sampling, whereby the strata comprised of
addresses of permanent quarters recorded in the database. Moreover, each unit in the strata was
uniquely identified using various identifiers, which include building name, flat number, and
street name. Notably, the study incorporated approximately 96% of the total Hong Kong
population. Moreover, there are various advantages, associated with this method of sampling,
such as the researcher not only estimate the population parameter but also compares results
between stratum thus ensures consistency thus reduces the errors linked to random sampling.
Therefore, despite the limitation of the study the results are efficient and can be trusted.
⊘ This is a preview!⊘
Do you want full access?
Subscribe today to unlock all pages.
Trusted by 1+ million students worldwide
Statistics 10
References
Clark, J. L., Konda, K. A., Silva-Santisteban, A., Peinado, J., Lama, J. R., Kusunoki, L., &
Suarez-Ognio, L. (2014). Sampling methodologies for epidemiologic surveillance of men
who have sex with men and transgender women in Latin America: an empiric
comparison of convenience sampling, time space sampling, and respondent driven
sampling. AIDS and behavior. 12(18), 2338-2348.
Hedt, B. L., & Pagano, M. (2011). Health indicators: eliminating bias from convenience
sampling estimators.Statistics in medicine. Internation Health Journal, 5(30), 560-568.
Kivunja, C. (2015). Innovative methodologies for 21st century learning, teaching and
assessment: A convenience sampling investigation into the use of social media
technologies in higher education. International Journal of Higher Education, 2(4), 1.
Lam, L., Liang, W., Chikritzhs, T., & Allsop, S. (2013). Alcohol and other drug use at school
leavers’ celebrations. Journal of Public Health, 3(36), 408-416.
McDonald, J. H. (2014). Handbook of Biological Statistics. Baltimore: Sparky House Publishing.
NM-IBIS. (2018, November 5). Demographic Characteristics. Retrieved from New Mexico's
Indicator-Based Information System Website:
https://ibis.health.state.nm.us/topic/population/demographics/Characteristics.html
Özdemir, R. S., Louis, K. O., & Topbaş, S. (2011). Public attitudes toward stuttering in Turkey:
Probability versus convenience sampling., 262-267. Journal of Fluency Disorders, 4(36),
262-267.
Stephanie, L. (2014, December 15). Inferential Statistics. Retrieved from Statistics How To:
https://www.statisticshowto.datasciencecentral.com/inferential-statistics/
Paraphrase This Document
Need a fresh take? Get an instant paraphrase of this document with our AI Paraphraser
Statistics 11
Swaminathan, S. (2018, March 15). Logistic Regression. Retrieved from Towards Data Science
Website: https://towardsdatascience.com/logistic-regression-detailed-overview-
46c4da4303bc
Szumilas, M. (2010). Explaining Odds Ratios. Journal of the Canadian Academy of Child and
Adolescent Psychiatry, 227-229.
Wong, M. C., Leung, M. C., Tsang, C. S., Lo, S. V., & Griffiths, S. M. (2013). The rising tide of
diabetes mellitus in a Chinese population: a population-based household survey on
121,895 persons. Internaional Journal of Public Health, 2(58), 269-276. Retrieved from
http://dx.doi.org.ezproxy.laureate.net.au/10.1007/s00038-012-0364-y
1 out of 11
Related Documents


Your All-in-One AI-Powered Toolkit for Academic Success.
+13062052269
info@desklib.com
Available 24*7 on WhatsApp / Email
![[object Object]](/_next/static/media/star-bottom.7253800d.svg)
Unlock your academic potential
Copyright © 2020–2026 A2Z Services. All Rights Reserved. Developed and managed by ZUCOL.