Detailed Analysis of Accounting and Finance in Business Operations
VerifiedAdded on 2020/11/12
|16
|3936
|166
Report
AI Summary
This report provides a comprehensive overview of accounting and finance, beginning with an introduction to the subject and a table of contents. It includes the preparation of income statements and balance sheets for Gravepals Plc. The report also conducts a break-even analysis for Cornpeace Ltd, calculating the break-even point in units and GBP, along with the margin of safety. Furthermore, it applies investment appraisal techniques (NPV, ARR, and payback period) for Dane Jones Ltd, offering investment recommendations. The analysis extends to discussing the merits and demerits of budgets and investment appraisal techniques. The report also analyzes Clarkenpark Ltd's strategy, explaining the underpinning assumptions of the break-even model and providing recommendations based on the financial data. The report concludes with a detailed discussion of various financial concepts and techniques, providing a well-rounded understanding of accounting and finance principles.

INTRODUCTION OF
ACCOUNTING AND FINANCE
ACCOUNTING AND FINANCE
Paraphrase This Document
Need a fresh take? Get an instant paraphrase of this document with our AI Paraphraser
Table of Contents
INTRODUCTION...........................................................................................................................1
QUESTION 1...................................................................................................................................1
Income statement........................................................................................................................1
Balance sheet...............................................................................................................................1
QUESTION 2...................................................................................................................................2
A. Calculation of contribution per unit ......................................................................................2
b. Calculating BEP and margin of safety....................................................................................3
c. Calculating profit on 48000 tables..........................................................................................4
D. Analysing the strategy for Clarkenpark Ltd...........................................................................5
E. Explaining underpinning assumptions of break-even model..................................................6
QUESTION 3...................................................................................................................................7
a. Recommendations...................................................................................................................7
b. Explaining and analysing key merits and demerits of various investment appraisal
techniques....................................................................................................................................9
c. Representing budget with its benefits and limitations as tool for strategic planning............12
CONCLUSION..............................................................................................................................13
REFERENCES..............................................................................................................................15
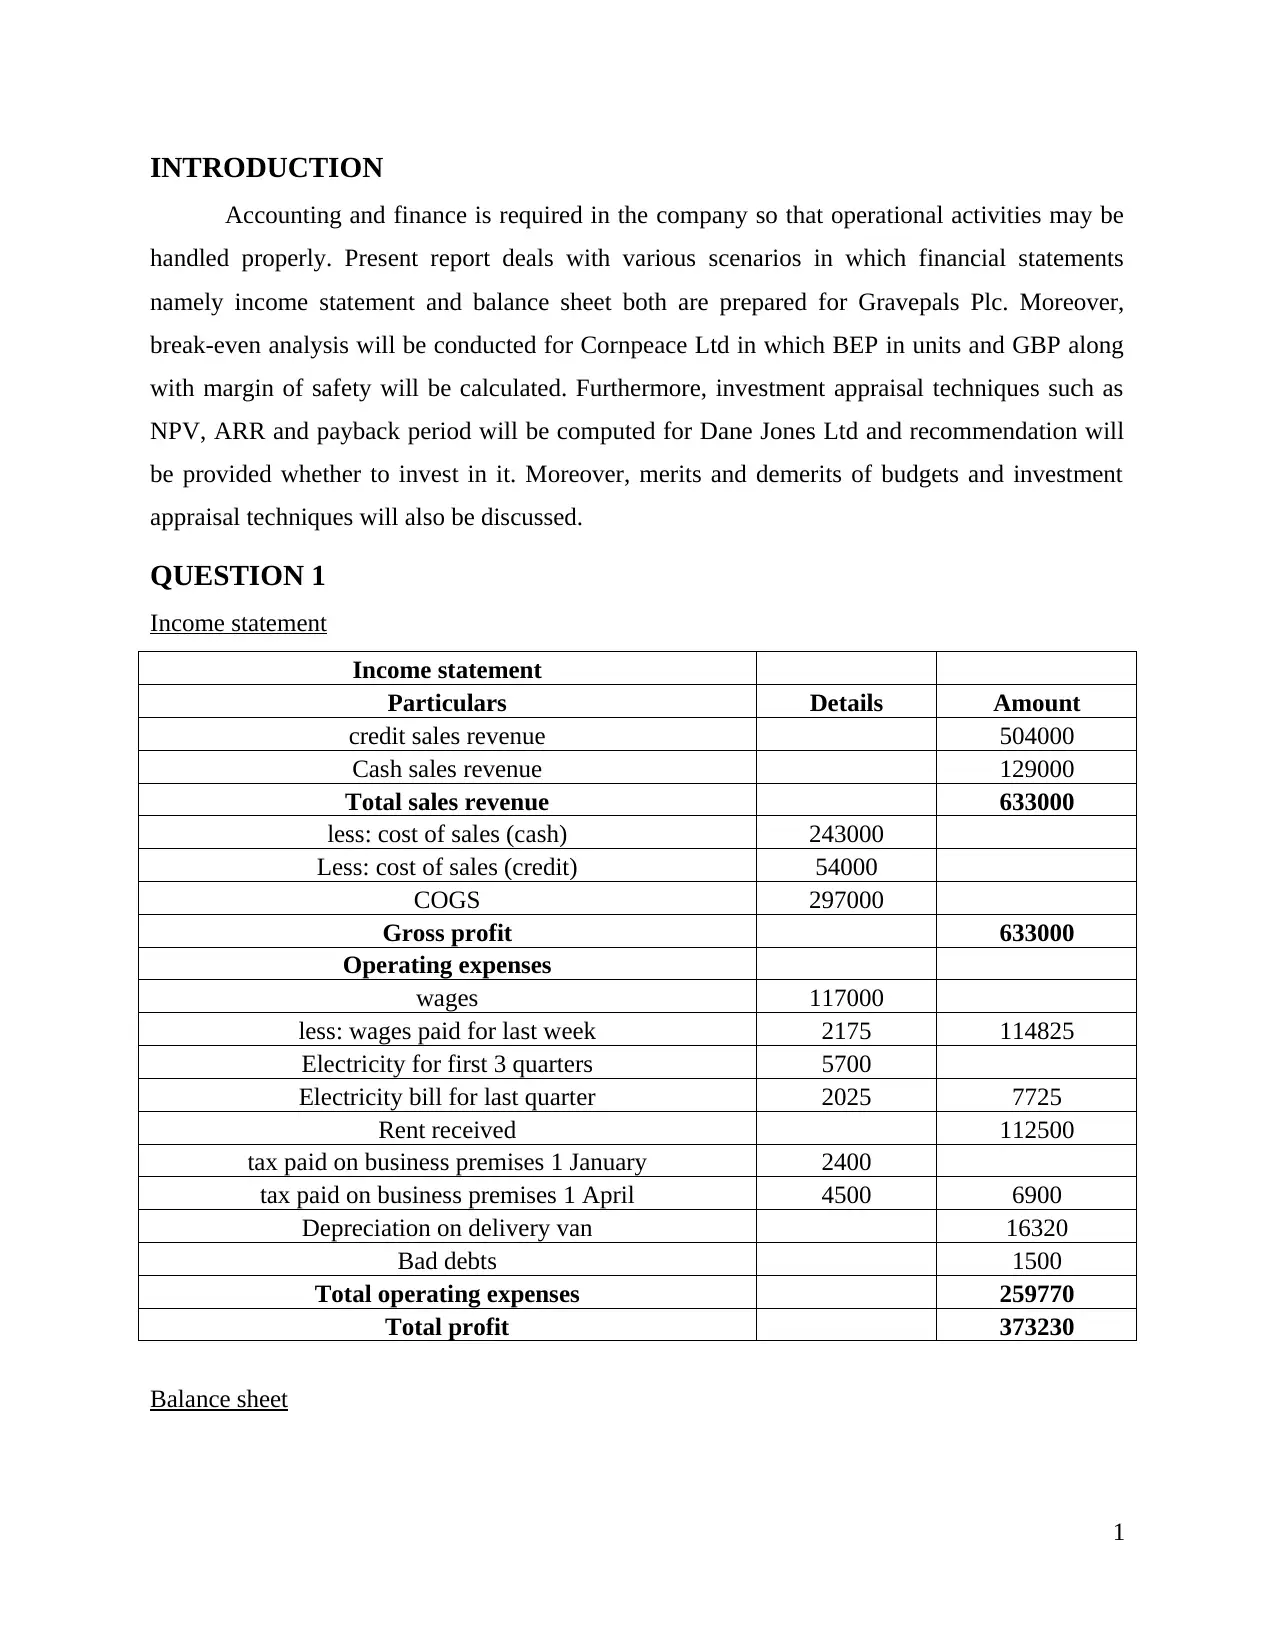
INTRODUCTION
Accounting and finance is required in the company so that operational activities may be
handled properly. Present report deals with various scenarios in which financial statements
namely income statement and balance sheet both are prepared for Gravepals Plc. Moreover,
break-even analysis will be conducted for Cornpeace Ltd in which BEP in units and GBP along
with margin of safety will be calculated. Furthermore, investment appraisal techniques such as
NPV, ARR and payback period will be computed for Dane Jones Ltd and recommendation will
be provided whether to invest in it. Moreover, merits and demerits of budgets and investment
appraisal techniques will also be discussed.
QUESTION 1
Income statement
Income statement
Particulars Details Amount
credit sales revenue 504000
Cash sales revenue 129000
Total sales revenue 633000
less: cost of sales (cash) 243000
Less: cost of sales (credit) 54000
COGS 297000
Gross profit 633000
Operating expenses
wages 117000
less: wages paid for last week 2175 114825
Electricity for first 3 quarters 5700
Electricity bill for last quarter 2025 7725
Rent received 112500
tax paid on business premises 1 January 2400
tax paid on business premises 1 April 4500 6900
Depreciation on delivery van 16320
Bad debts 1500
Total operating expenses 259770
Total profit 373230
Balance sheet
1
⊘ This is a preview!⊘
Do you want full access?
Subscribe today to unlock all pages.
Trusted by 1+ million students worldwide
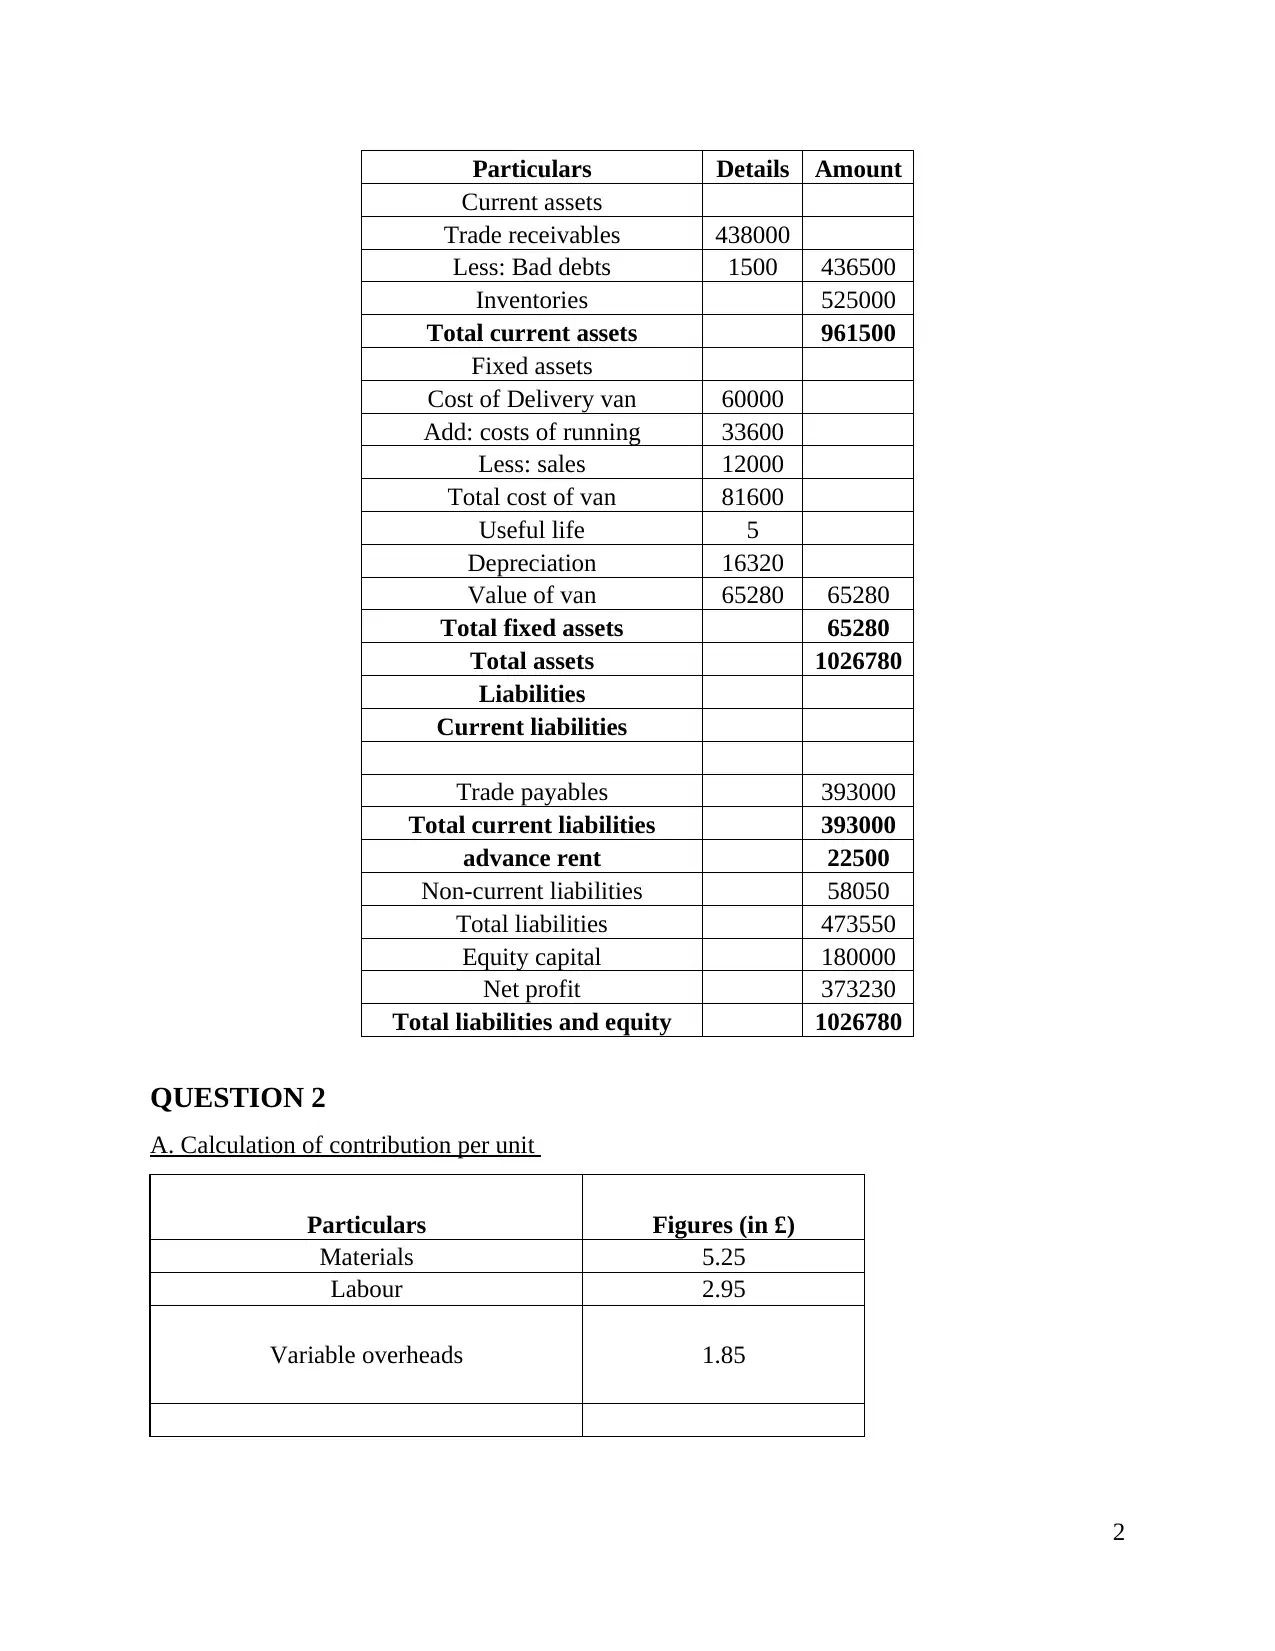
Particulars Details Amount
Current assets
Trade receivables 438000
Less: Bad debts 1500 436500
Inventories 525000
Total current assets 961500
Fixed assets
Cost of Delivery van 60000
Add: costs of running 33600
Less: sales 12000
Total cost of van 81600
Useful life 5
Depreciation 16320
Value of van 65280 65280
Total fixed assets 65280
Total assets 1026780
Liabilities
Current liabilities
Trade payables 393000
Total current liabilities 393000
advance rent 22500
Non-current liabilities 58050
Total liabilities 473550
Equity capital 180000
Net profit 373230
Total liabilities and equity 1026780
QUESTION 2
A. Calculation of contribution per unit
Particulars Figures (in £)
Materials 5.25
Labour 2.95
Variable overheads 1.85
2
Paraphrase This Document
Need a fresh take? Get an instant paraphrase of this document with our AI Paraphraser
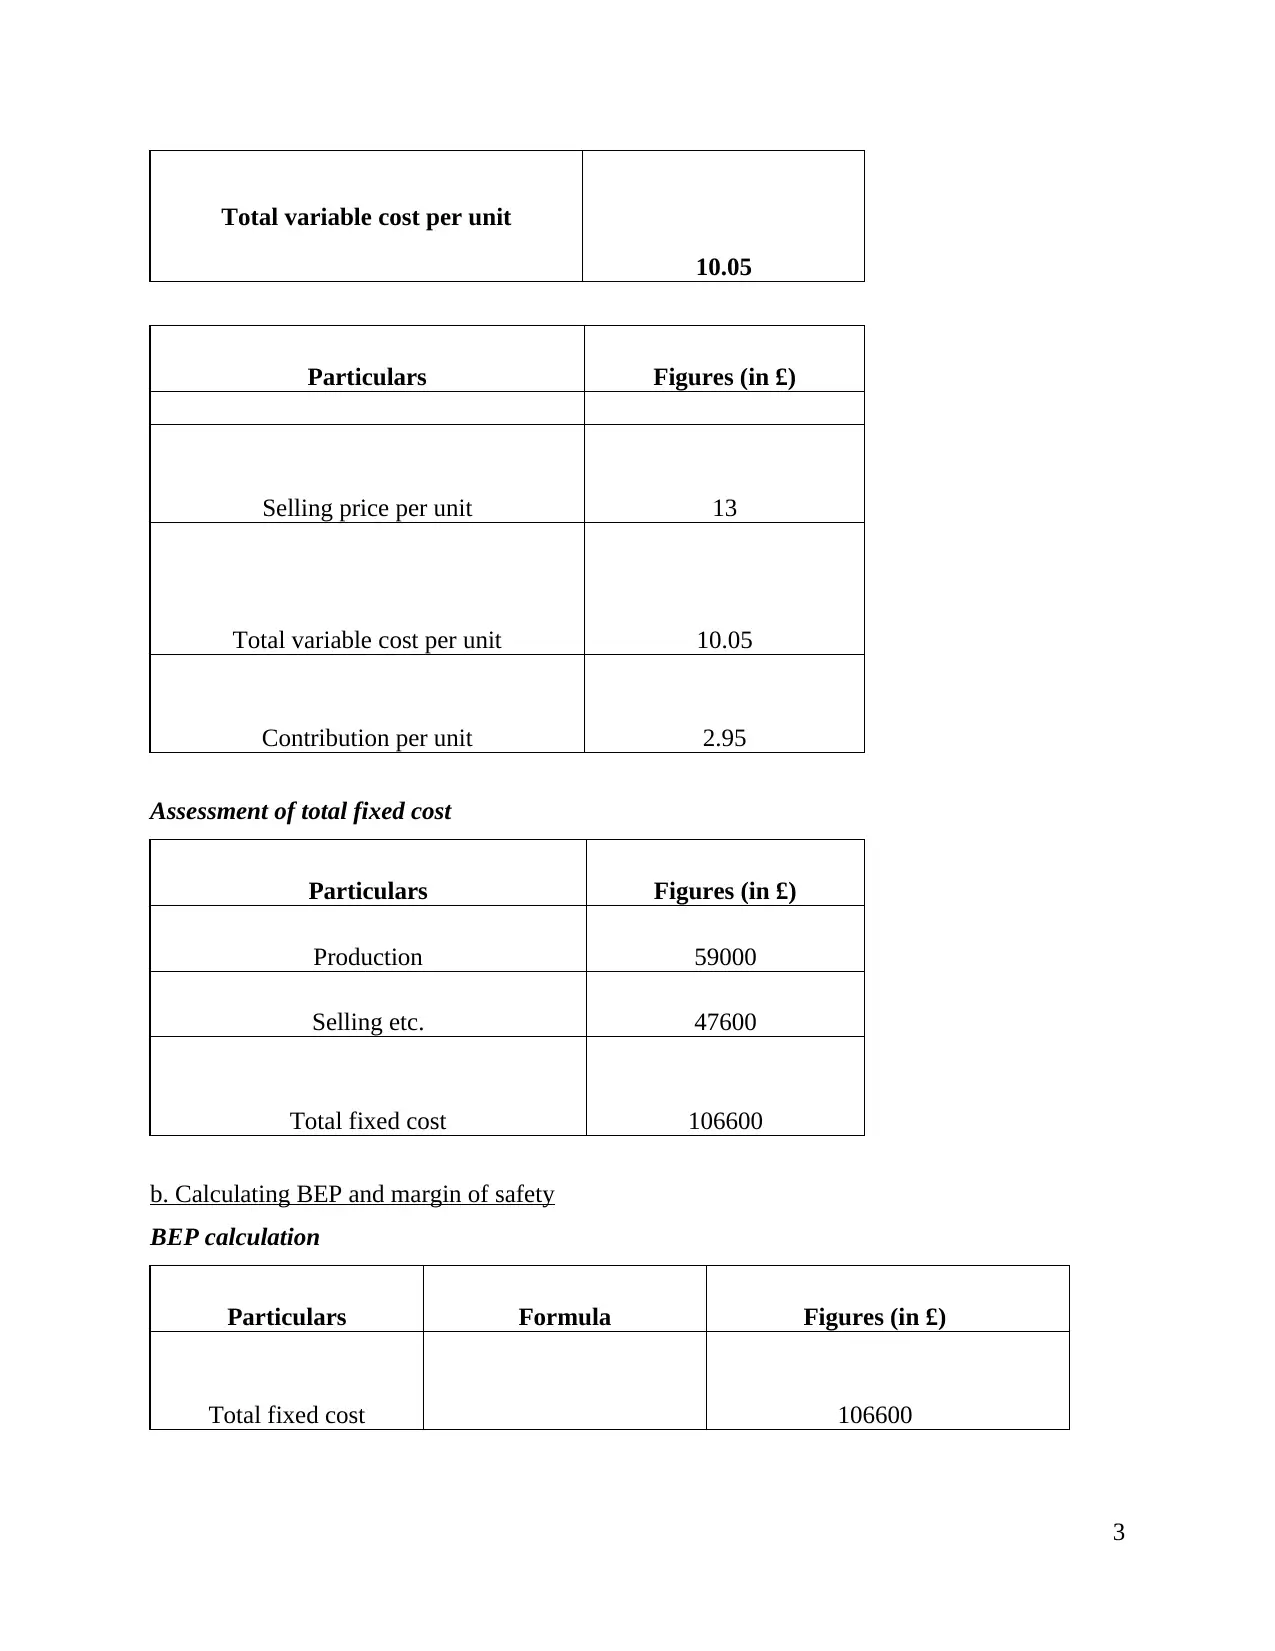
Total variable cost per unit
10.05
Particulars Figures (in £)
Selling price per unit 13
Total variable cost per unit 10.05
Contribution per unit 2.95
Assessment of total fixed cost
Particulars Figures (in £)
Production 59000
Selling etc. 47600
Total fixed cost 106600
b. Calculating BEP and margin of safety
BEP calculation
Particulars Formula Figures (in £)
Total fixed cost 106600
3
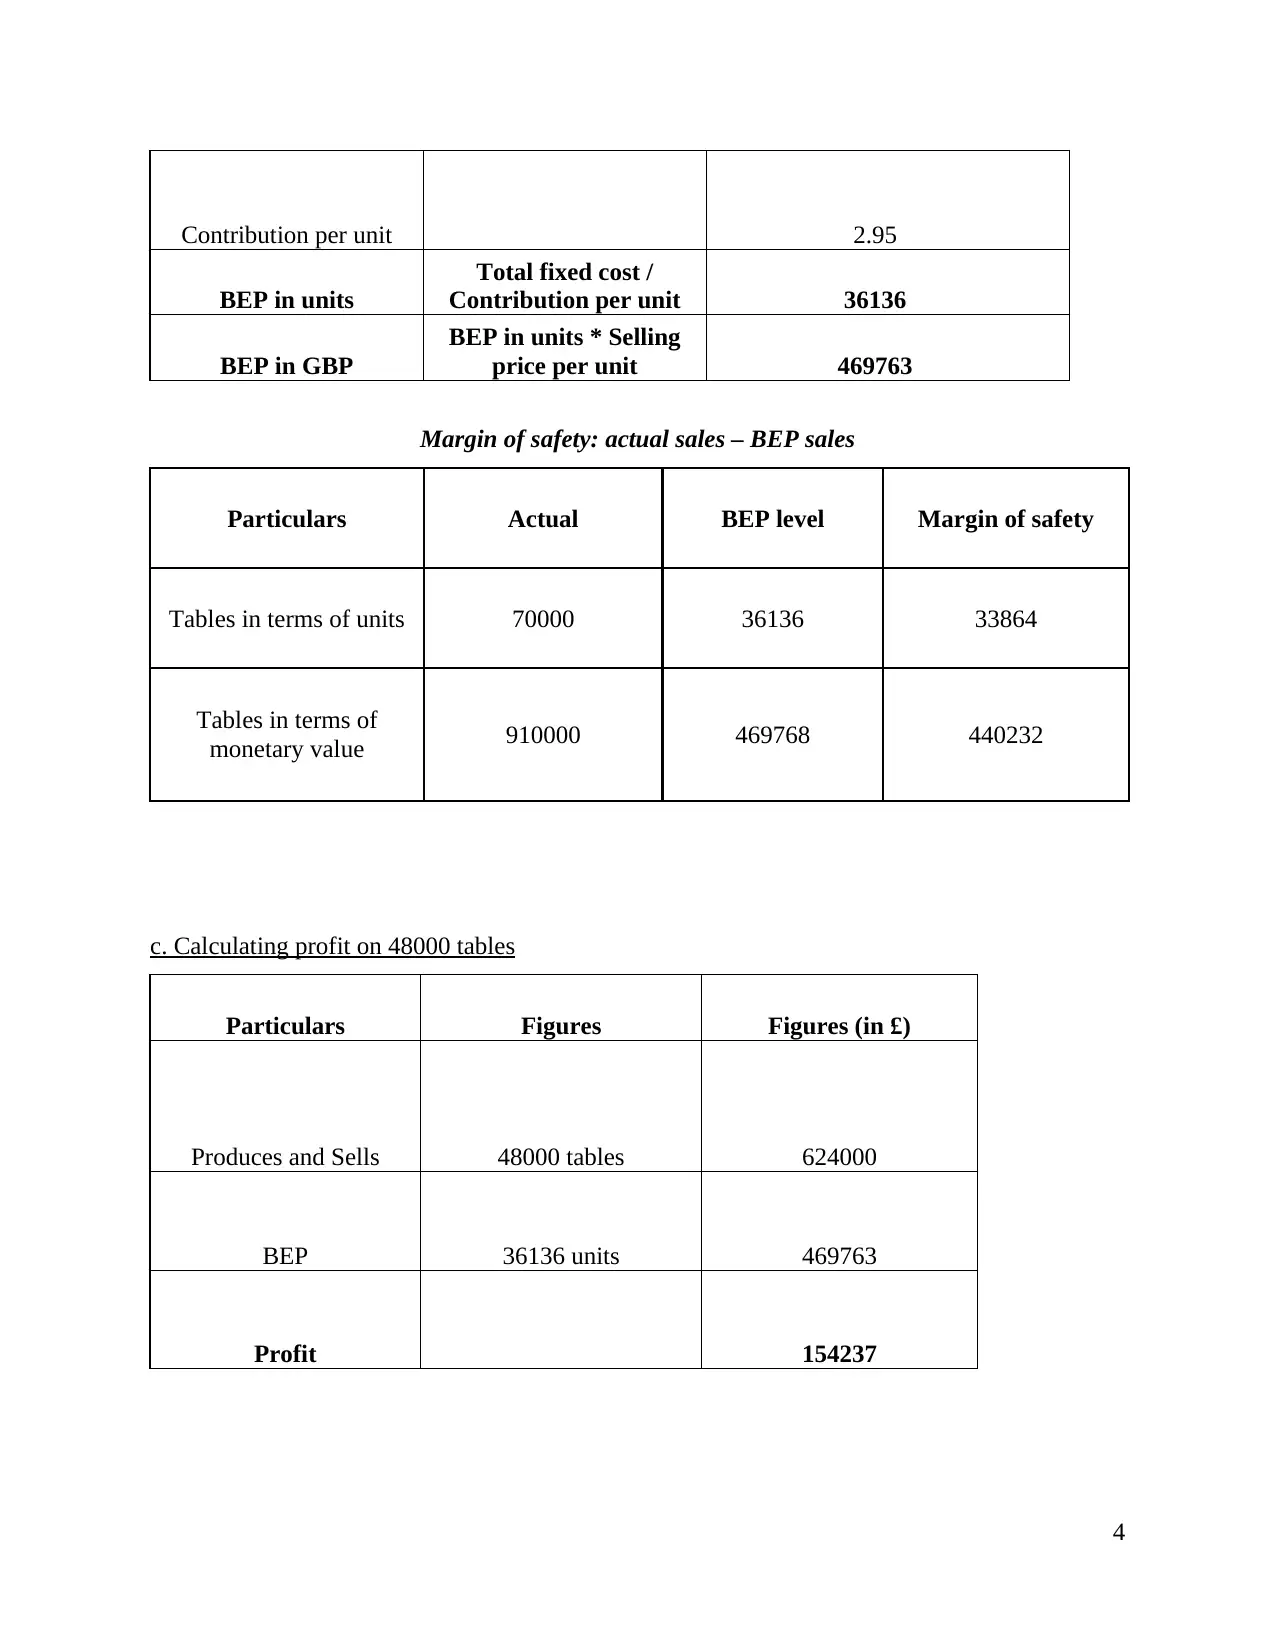
Contribution per unit 2.95
BEP in units
Total fixed cost /
Contribution per unit 36136
BEP in GBP
BEP in units * Selling
price per unit 469763
Margin of safety: actual sales – BEP sales
Particulars Actual BEP level Margin of safety
Tables in terms of units 70000 36136 33864
Tables in terms of
monetary value 910000 469768 440232
c. Calculating profit on 48000 tables
Particulars Figures Figures (in £)
Produces and Sells 48000 tables 624000
BEP 36136 units 469763
Profit 154237
4
⊘ This is a preview!⊘
Do you want full access?
Subscribe today to unlock all pages.
Trusted by 1+ million students worldwide
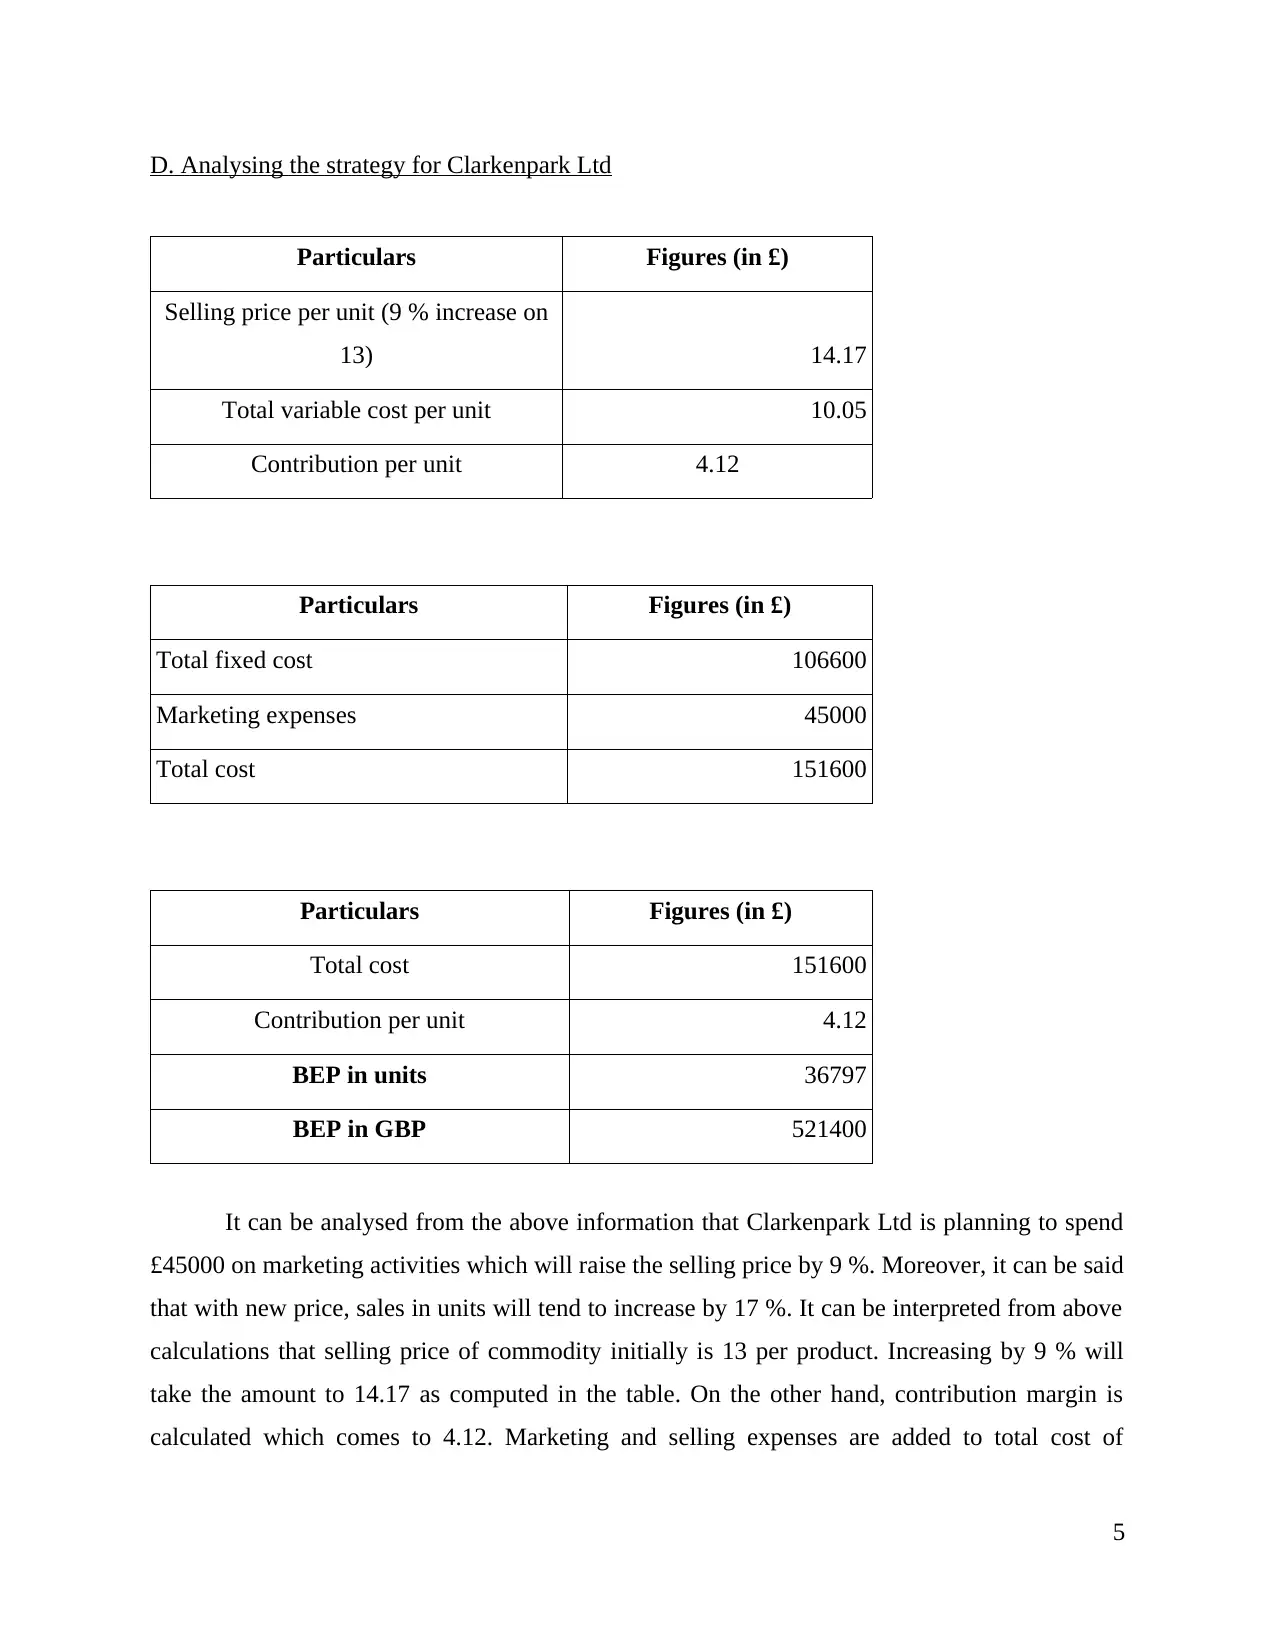
D. Analysing the strategy for Clarkenpark Ltd
Particulars Figures (in £)
Selling price per unit (9 % increase on
13) 14.17
Total variable cost per unit 10.05
Contribution per unit 4.12
Particulars Figures (in £)
Total fixed cost 106600
Marketing expenses 45000
Total cost 151600
Particulars Figures (in £)
Total cost 151600
Contribution per unit 4.12
BEP in units 36797
BEP in GBP 521400
It can be analysed from the above information that Clarkenpark Ltd is planning to spend
£45000 on marketing activities which will raise the selling price by 9 %. Moreover, it can be said
that with new price, sales in units will tend to increase by 17 %. It can be interpreted from above
calculations that selling price of commodity initially is 13 per product. Increasing by 9 % will
take the amount to 14.17 as computed in the table. On the other hand, contribution margin is
calculated which comes to 4.12. Marketing and selling expenses are added to total cost of
5
Particulars Figures (in £)
Selling price per unit (9 % increase on
13) 14.17
Total variable cost per unit 10.05
Contribution per unit 4.12
Particulars Figures (in £)
Total fixed cost 106600
Marketing expenses 45000
Total cost 151600
Particulars Figures (in £)
Total cost 151600
Contribution per unit 4.12
BEP in units 36797
BEP in GBP 521400
It can be analysed from the above information that Clarkenpark Ltd is planning to spend
£45000 on marketing activities which will raise the selling price by 9 %. Moreover, it can be said
that with new price, sales in units will tend to increase by 17 %. It can be interpreted from above
calculations that selling price of commodity initially is 13 per product. Increasing by 9 % will
take the amount to 14.17 as computed in the table. On the other hand, contribution margin is
calculated which comes to 4.12. Marketing and selling expenses are added to total cost of
5
Paraphrase This Document
Need a fresh take? Get an instant paraphrase of this document with our AI Paraphraser
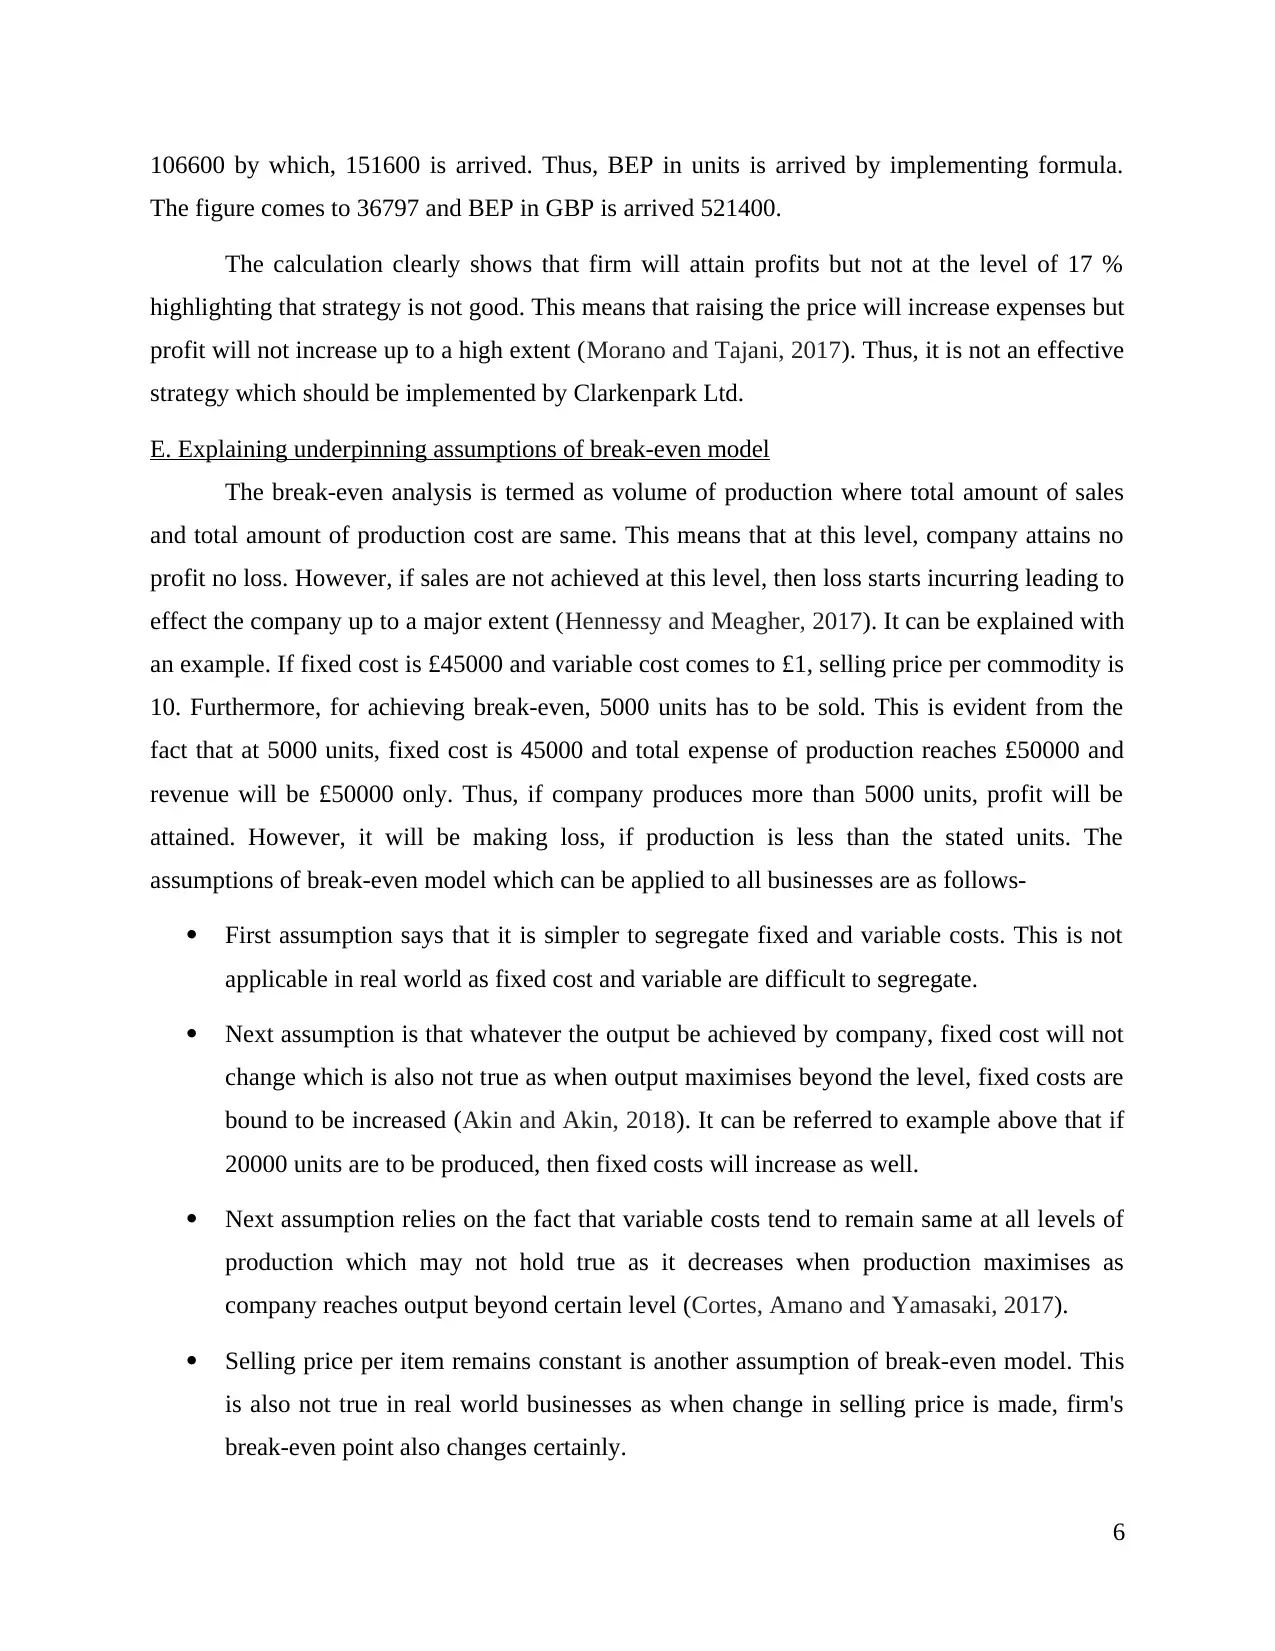
106600 by which, 151600 is arrived. Thus, BEP in units is arrived by implementing formula.
The figure comes to 36797 and BEP in GBP is arrived 521400.
The calculation clearly shows that firm will attain profits but not at the level of 17 %
highlighting that strategy is not good. This means that raising the price will increase expenses but
profit will not increase up to a high extent (Morano and Tajani, 2017). Thus, it is not an effective
strategy which should be implemented by Clarkenpark Ltd.
E. Explaining underpinning assumptions of break-even model
The break-even analysis is termed as volume of production where total amount of sales
and total amount of production cost are same. This means that at this level, company attains no
profit no loss. However, if sales are not achieved at this level, then loss starts incurring leading to
effect the company up to a major extent (Hennessy and Meagher, 2017). It can be explained with
an example. If fixed cost is £45000 and variable cost comes to £1, selling price per commodity is
10. Furthermore, for achieving break-even, 5000 units has to be sold. This is evident from the
fact that at 5000 units, fixed cost is 45000 and total expense of production reaches £50000 and
revenue will be £50000 only. Thus, if company produces more than 5000 units, profit will be
attained. However, it will be making loss, if production is less than the stated units. The
assumptions of break-even model which can be applied to all businesses are as follows-
First assumption says that it is simpler to segregate fixed and variable costs. This is not
applicable in real world as fixed cost and variable are difficult to segregate.
Next assumption is that whatever the output be achieved by company, fixed cost will not
change which is also not true as when output maximises beyond the level, fixed costs are
bound to be increased (Akin and Akin, 2018). It can be referred to example above that if
20000 units are to be produced, then fixed costs will increase as well.
Next assumption relies on the fact that variable costs tend to remain same at all levels of
production which may not hold true as it decreases when production maximises as
company reaches output beyond certain level (Cortes, Amano and Yamasaki, 2017).
Selling price per item remains constant is another assumption of break-even model. This
is also not true in real world businesses as when change in selling price is made, firm's
break-even point also changes certainly.
6
Next assumption is that there is no technological advancement, methods of production
and workers efficiency (Linssen, Stenzel and Fleer, 2017). Furthermore, machine
breakdown is also not possible due to natural calamities.
Thus, above assumptions are universally applicable to businesses but might deviate from real
business world practices.
QUESTION 3
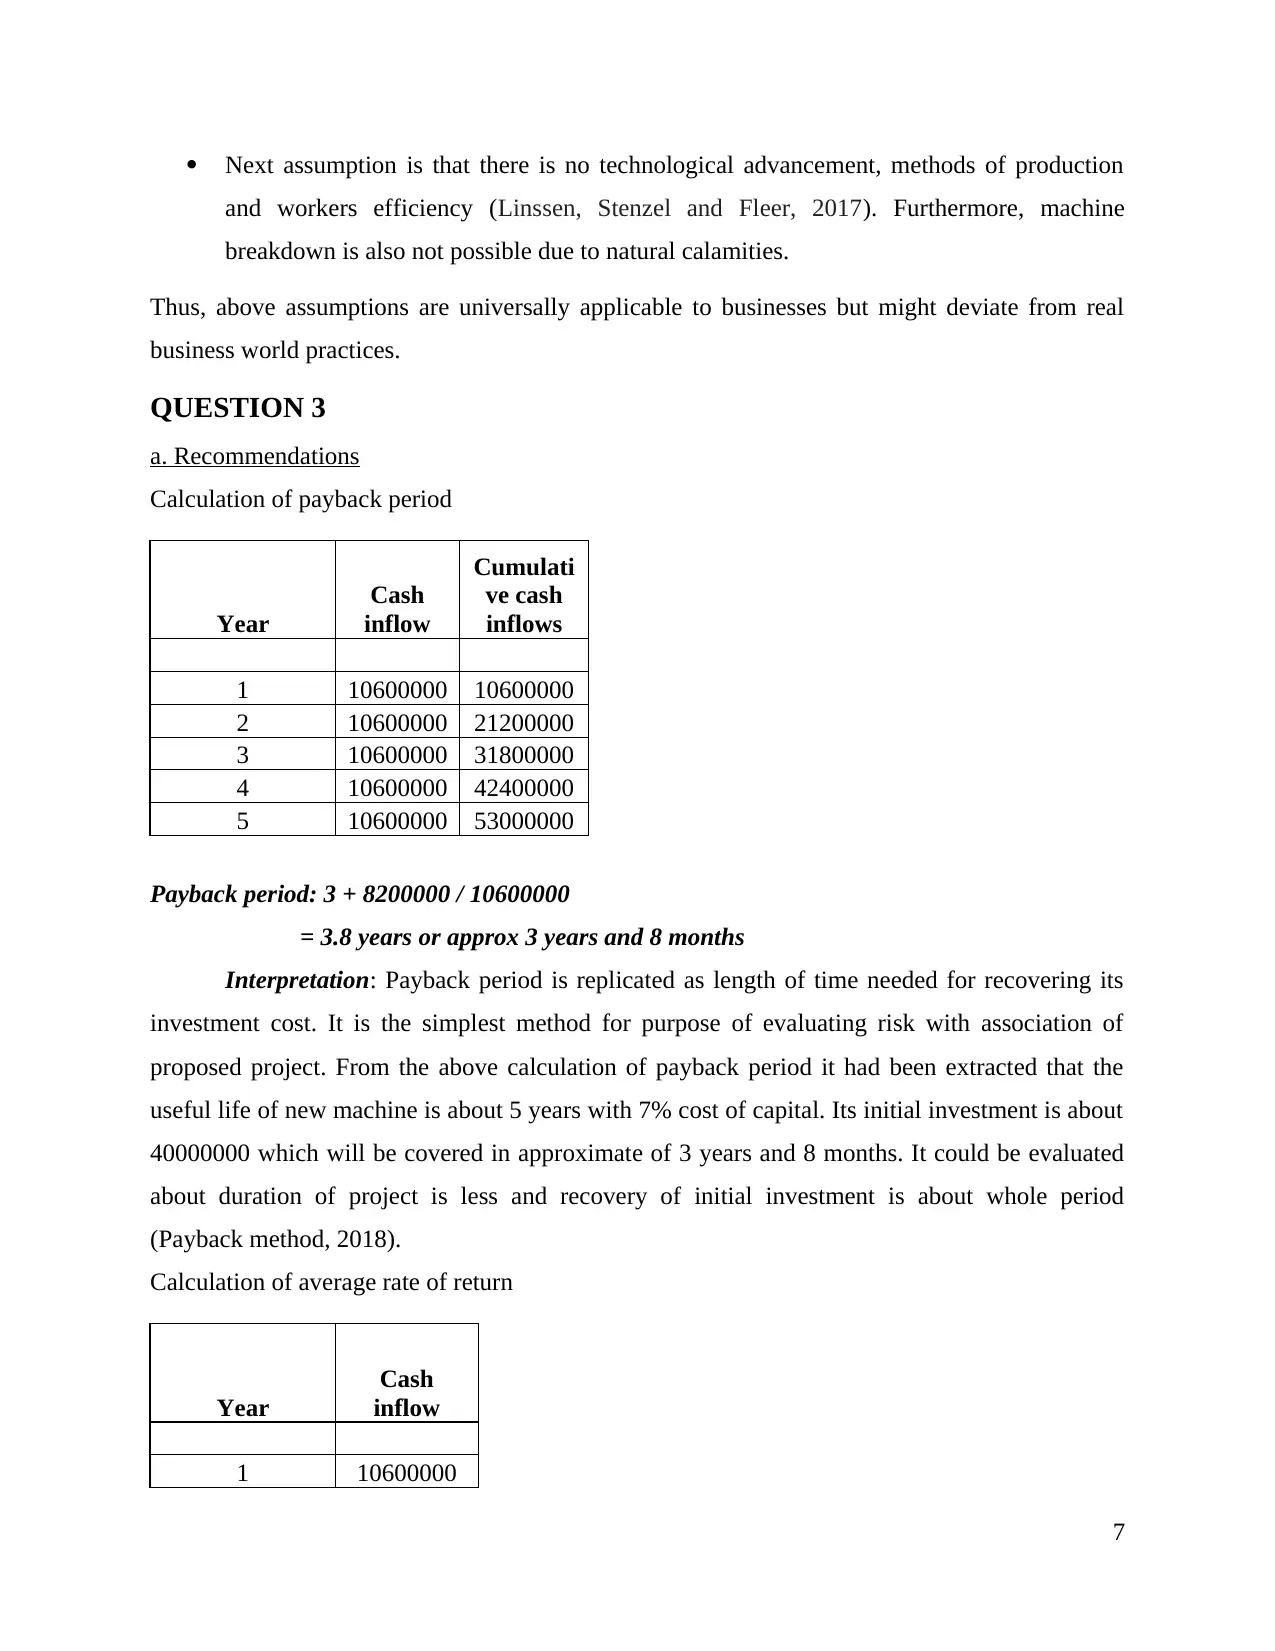
a. Recommendations
Calculation of payback period
Year
Cash
inflow
Cumulati
ve cash
inflows
1 10600000 10600000
2 10600000 21200000
3 10600000 31800000
4 10600000 42400000
5 10600000 53000000
Payback period: 3 + 8200000 / 10600000
= 3.8 years or approx 3 years and 8 months
Interpretation: Payback period is replicated as length of time needed for recovering its
investment cost. It is the simplest method for purpose of evaluating risk with association of
proposed project. From the above calculation of payback period it had been extracted that the
useful life of new machine is about 5 years with 7% cost of capital. Its initial investment is about
40000000 which will be covered in approximate of 3 years and 8 months. It could be evaluated
about duration of project is less and recovery of initial investment is about whole period
(Payback method, 2018).
Calculation of average rate of return
Year
Cash
inflow
1 10600000
7
and workers efficiency (Linssen, Stenzel and Fleer, 2017). Furthermore, machine
breakdown is also not possible due to natural calamities.
Thus, above assumptions are universally applicable to businesses but might deviate from real
business world practices.
QUESTION 3
a. Recommendations
Calculation of payback period
Year
Cash
inflow
Cumulati
ve cash
inflows
1 10600000 10600000
2 10600000 21200000
3 10600000 31800000
4 10600000 42400000
5 10600000 53000000
Payback period: 3 + 8200000 / 10600000
= 3.8 years or approx 3 years and 8 months
Interpretation: Payback period is replicated as length of time needed for recovering its
investment cost. It is the simplest method for purpose of evaluating risk with association of
proposed project. From the above calculation of payback period it had been extracted that the
useful life of new machine is about 5 years with 7% cost of capital. Its initial investment is about
40000000 which will be covered in approximate of 3 years and 8 months. It could be evaluated
about duration of project is less and recovery of initial investment is about whole period
(Payback method, 2018).
Calculation of average rate of return
Year
Cash
inflow
1 10600000
7
⊘ This is a preview!⊘
Do you want full access?
Subscribe today to unlock all pages.
Trusted by 1+ million students worldwide
2 10600000
3 10600000
4 10600000
5 10600000
Average profit 10600000
Average
investment 22500000
ARR 47.11%
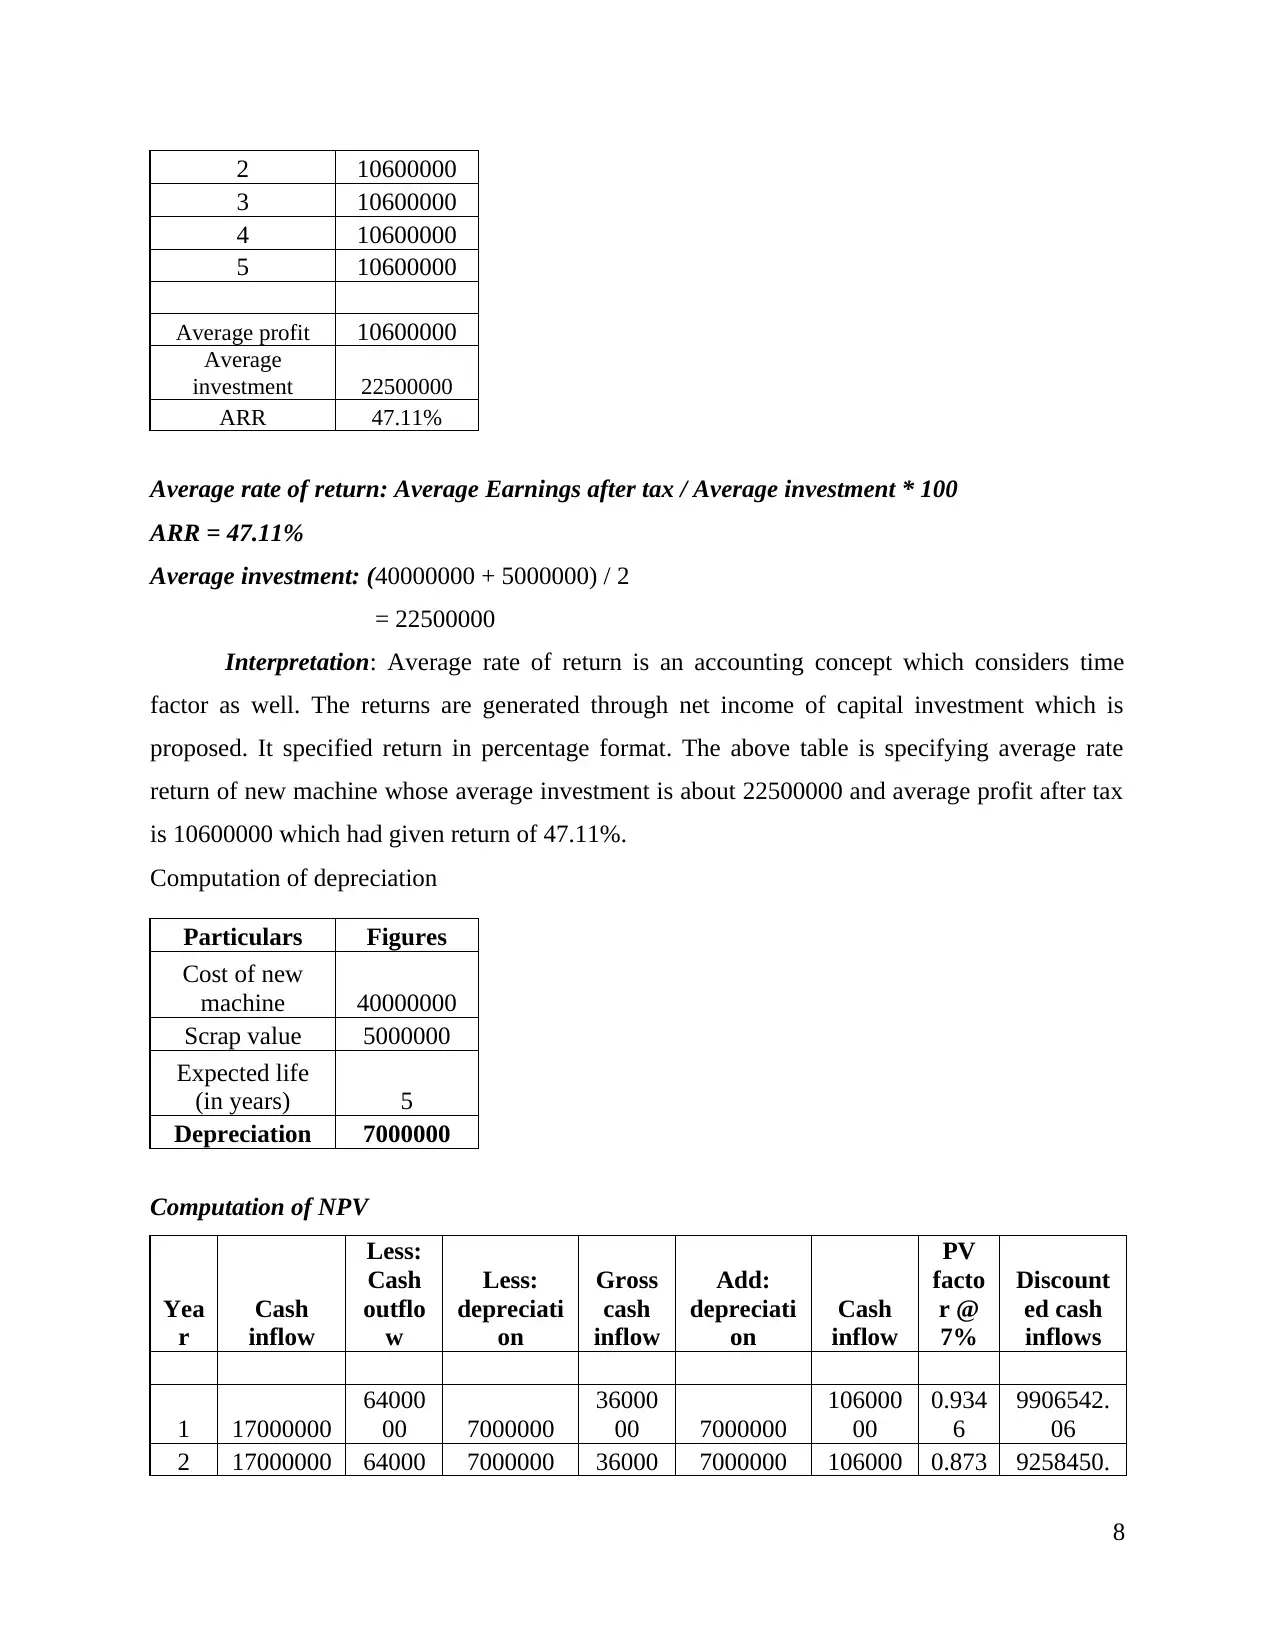
Average rate of return: Average Earnings after tax / Average investment * 100
ARR = 47.11%
Average investment: (40000000 + 5000000) / 2
= 22500000
Interpretation: Average rate of return is an accounting concept which considers time
factor as well. The returns are generated through net income of capital investment which is
proposed. It specified return in percentage format. The above table is specifying average rate
return of new machine whose average investment is about 22500000 and average profit after tax
is 10600000 which had given return of 47.11%.
Computation of depreciation
Particulars Figures
Cost of new
machine 40000000
Scrap value 5000000
Expected life
(in years) 5
Depreciation 7000000
Computation of NPV
Yea
r
Cash
inflow
Less:
Cash
outflo
w
Less:
depreciati
on
Gross
cash
inflow
Add:
depreciati
on
Cash
inflow
PV
facto
r @
7%
Discount
ed cash
inflows
1 17000000
64000
00 7000000
36000
00 7000000
106000
00
0.934
6
9906542.
06
2 17000000 64000 7000000 36000 7000000 106000 0.873 9258450.
8
3 10600000
4 10600000
5 10600000
Average profit 10600000
Average
investment 22500000
ARR 47.11%
Average rate of return: Average Earnings after tax / Average investment * 100
ARR = 47.11%
Average investment: (40000000 + 5000000) / 2
= 22500000
Interpretation: Average rate of return is an accounting concept which considers time
factor as well. The returns are generated through net income of capital investment which is
proposed. It specified return in percentage format. The above table is specifying average rate
return of new machine whose average investment is about 22500000 and average profit after tax
is 10600000 which had given return of 47.11%.
Computation of depreciation
Particulars Figures
Cost of new
machine 40000000
Scrap value 5000000
Expected life
(in years) 5
Depreciation 7000000
Computation of NPV
Yea
r
Cash
inflow
Less:
Cash
outflo
w
Less:
depreciati
on
Gross
cash
inflow
Add:
depreciati
on
Cash
inflow
PV
facto
r @
7%
Discount
ed cash
inflows
1 17000000
64000
00 7000000
36000
00 7000000
106000
00
0.934
6
9906542.
06
2 17000000 64000 7000000 36000 7000000 106000 0.873 9258450.
8
Paraphrase This Document
Need a fresh take? Get an instant paraphrase of this document with our AI Paraphraser
00 00 00 4 52
3 17000000
64000
00 7000000
36000
00 7000000
106000
00
0.816
3
8652757.
5
4 17000000
64000
00 7000000
36000
00 7000000
106000
00
0.762
9
8086689.
25
5 17000000
64000
00 7000000
36000
00 7000000
106000
00
0.713
0
7557653.
5
Total
discounte
d cash
inflows
43462092
.8
Less:
initial
investmen
t 40000000
NPV
(Total
discounte
d cash
inflow –
initial
investme
nt)
3462092.
82
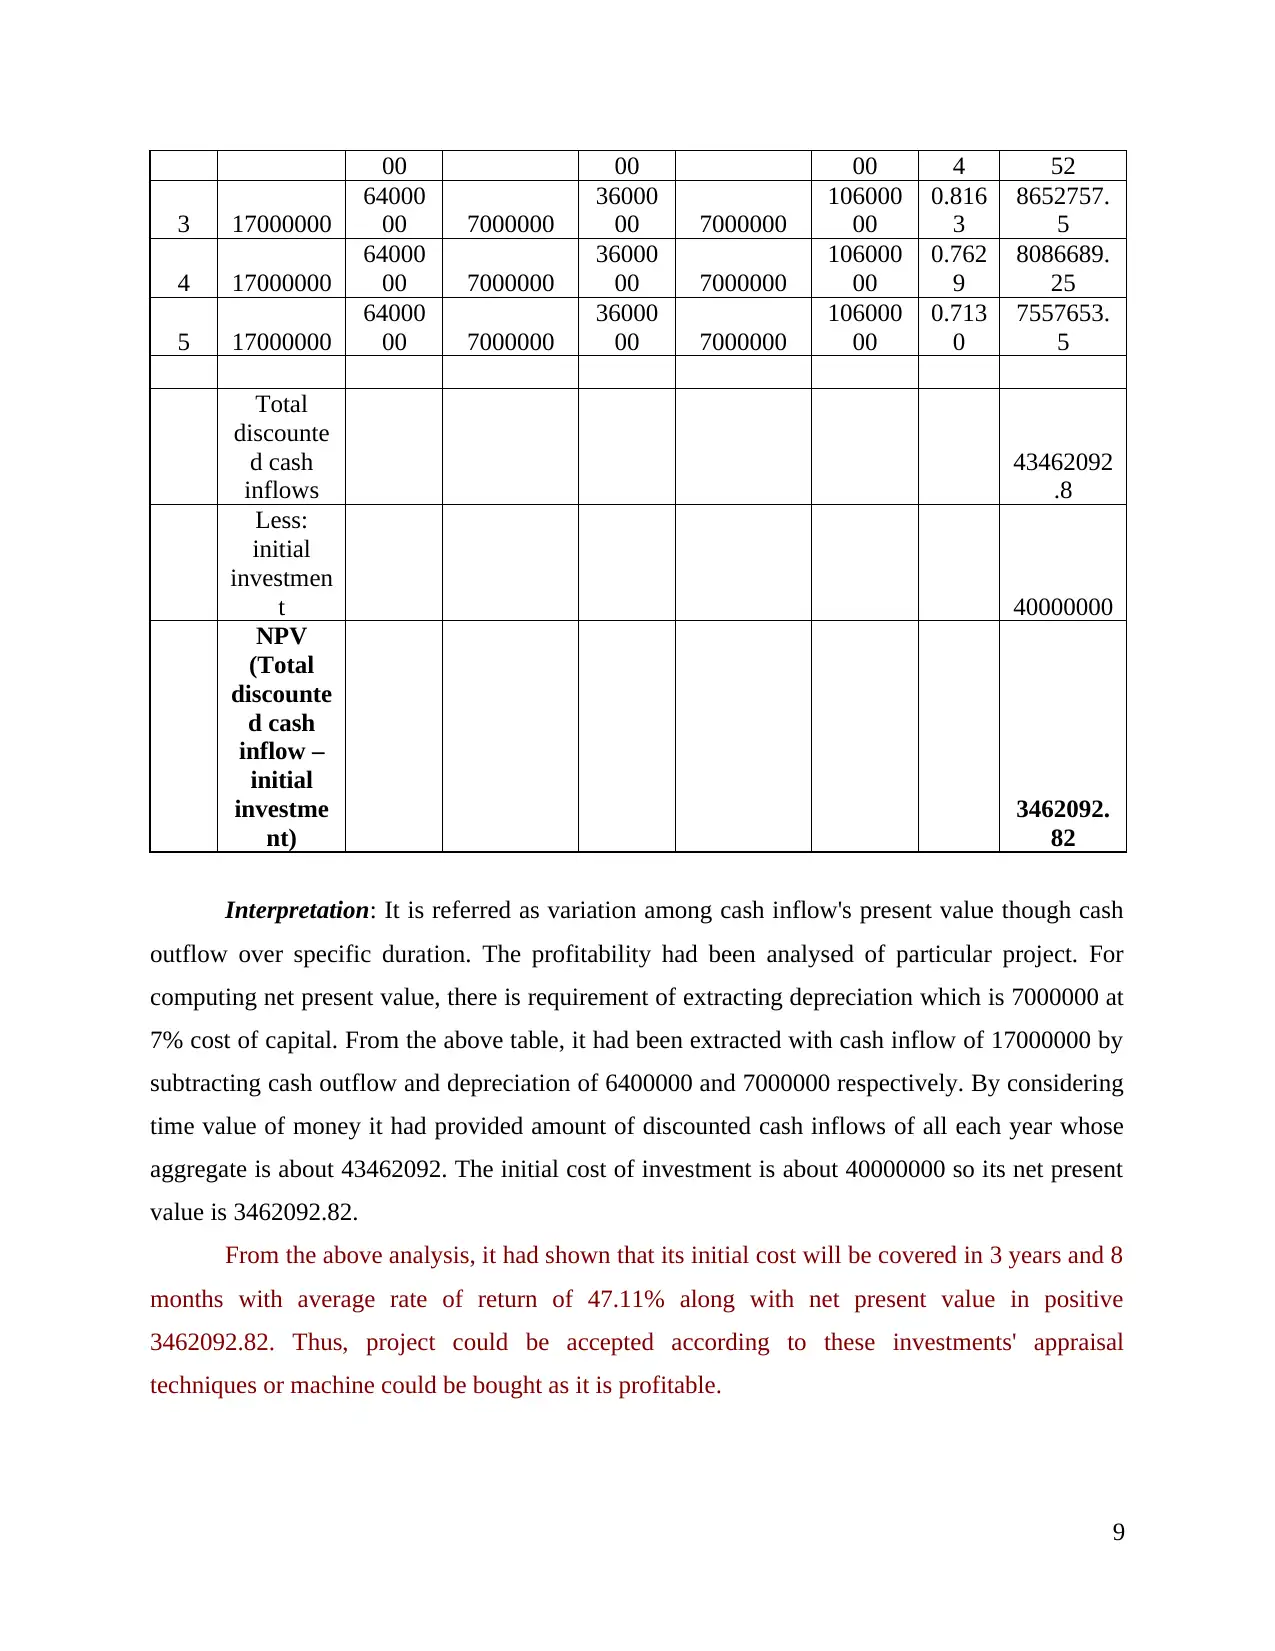
Interpretation: It is referred as variation among cash inflow's present value though cash
outflow over specific duration. The profitability had been analysed of particular project. For
computing net present value, there is requirement of extracting depreciation which is 7000000 at
7% cost of capital. From the above table, it had been extracted with cash inflow of 17000000 by
subtracting cash outflow and depreciation of 6400000 and 7000000 respectively. By considering
time value of money it had provided amount of discounted cash inflows of all each year whose
aggregate is about 43462092. The initial cost of investment is about 40000000 so its net present
value is 3462092.82.
From the above analysis, it had shown that its initial cost will be covered in 3 years and 8
months with average rate of return of 47.11% along with net present value in positive
3462092.82. Thus, project could be accepted according to these investments' appraisal
techniques or machine could be bought as it is profitable.
9
3 17000000
64000
00 7000000
36000
00 7000000
106000
00
0.816
3
8652757.
5
4 17000000
64000
00 7000000
36000
00 7000000
106000
00
0.762
9
8086689.
25
5 17000000
64000
00 7000000
36000
00 7000000
106000
00
0.713
0
7557653.
5
Total
discounte
d cash
inflows
43462092
.8
Less:
initial
investmen
t 40000000
NPV
(Total
discounte
d cash
inflow –
initial
investme
nt)
3462092.
82
Interpretation: It is referred as variation among cash inflow's present value though cash
outflow over specific duration. The profitability had been analysed of particular project. For
computing net present value, there is requirement of extracting depreciation which is 7000000 at
7% cost of capital. From the above table, it had been extracted with cash inflow of 17000000 by
subtracting cash outflow and depreciation of 6400000 and 7000000 respectively. By considering
time value of money it had provided amount of discounted cash inflows of all each year whose
aggregate is about 43462092. The initial cost of investment is about 40000000 so its net present
value is 3462092.82.
From the above analysis, it had shown that its initial cost will be covered in 3 years and 8
months with average rate of return of 47.11% along with net present value in positive
3462092.82. Thus, project could be accepted according to these investments' appraisal
techniques or machine could be bought as it is profitable.
9
b. Explaining and analysing key merits and demerits of various investment appraisal techniques
Payback period : Payback period is a time period which is used to calculate the payback
period of the initial cash invested in a project. Payback period of any investment assist in
determining whether project must be undertaken or not (Lin, Chang and Chung, 2015). Formula
to calculate payback period is as follows:
Payback period = Initial outlay / cash inflows
Project is accepted if there is less payback period otherwise the project is rejected.
Advantages of Payback period
This method to determine the payback of initial cash outlay is easy to understand .
This method assists the company in analysing the risk of investment for a time period.
This method is helpful in estimating the liquidity of projects.
This method is helpful to those companies where the investment is made quickly.
Disadvantages of payback period
This method is having a major drawback as it ignores the time value of money.
Payback period method does not take into account the cash flows occur after the payback
period.
This method only focuses on time required to recover the investment and ignore the
profitability which occur from investing in that particular project.
This method does not measure the liquidity of the company. It only considers about the
time required to recover the cash invested.
The accounting rate of return: It is also known as ARR which is a financial ratio used
in capital budgeting (Jonker, Junginger and Faaij, 2014). It is used to measure the profitability
on particular investment accounting rate of return is used to know about return on investment to
identify if that particular project should be accepted of rejected. Formula for accounting rate of
return is as follows
ARR = average annual accounting profits / Initial investment
Advantages of accounting rate of return
Accounting rate of return is based on information provided in the accounting reports ,
thus there is no need of any other report for calculating ARR.
10
⊘ This is a preview!⊘
Do you want full access?
Subscribe today to unlock all pages.
Trusted by 1+ million students worldwide
1 out of 16
Related Documents


Your All-in-One AI-Powered Toolkit for Academic Success.
+13062052269
info@desklib.com
Available 24*7 on WhatsApp / Email
![[object Object]](/_next/static/media/star-bottom.7253800d.svg)
Unlock your academic potential
Copyright © 2020–2026 A2Z Services. All Rights Reserved. Developed and managed by ZUCOL.