Biostatistics Assignment 2: Statistical Analysis of Grip Strength Data

Verified

Added on  2022/11/22

|11
|1459
|221
Homework Assignment
AI Summary
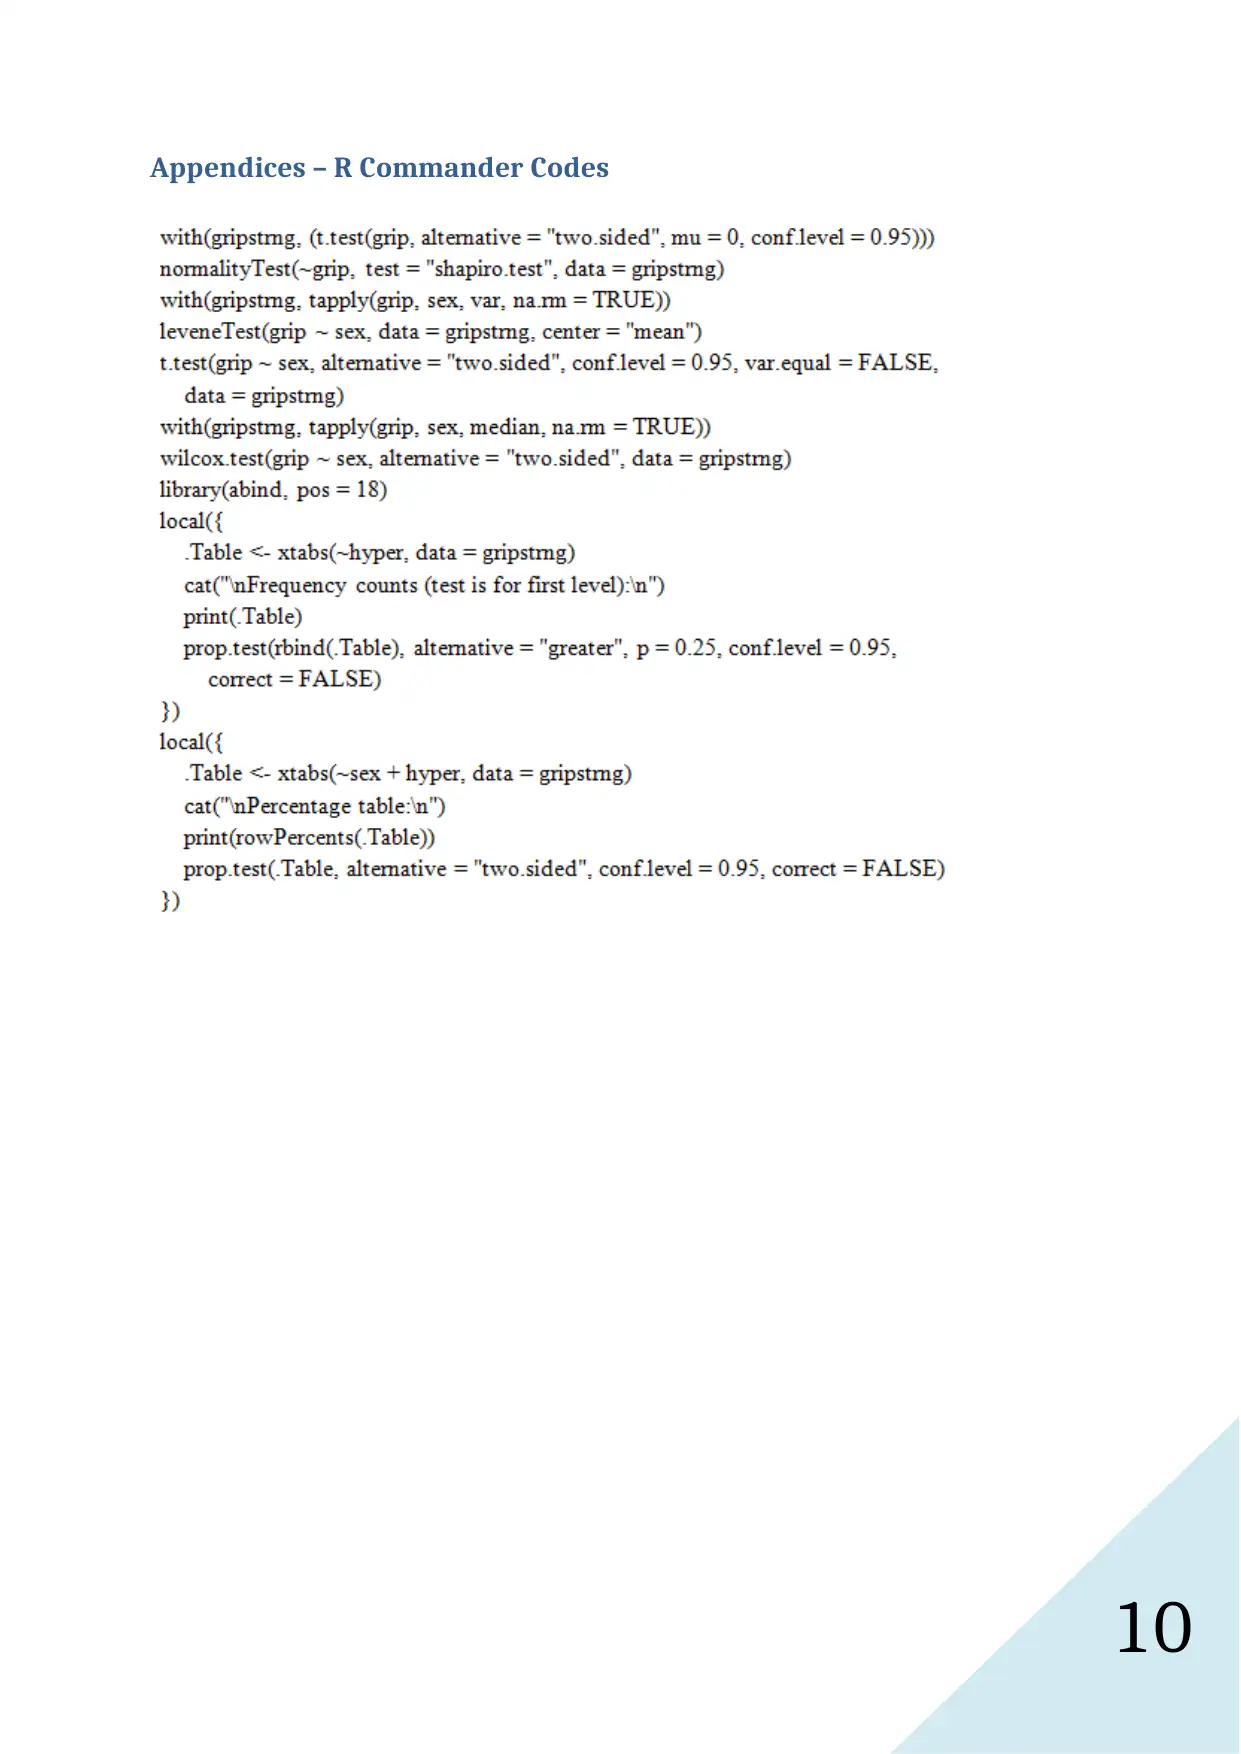
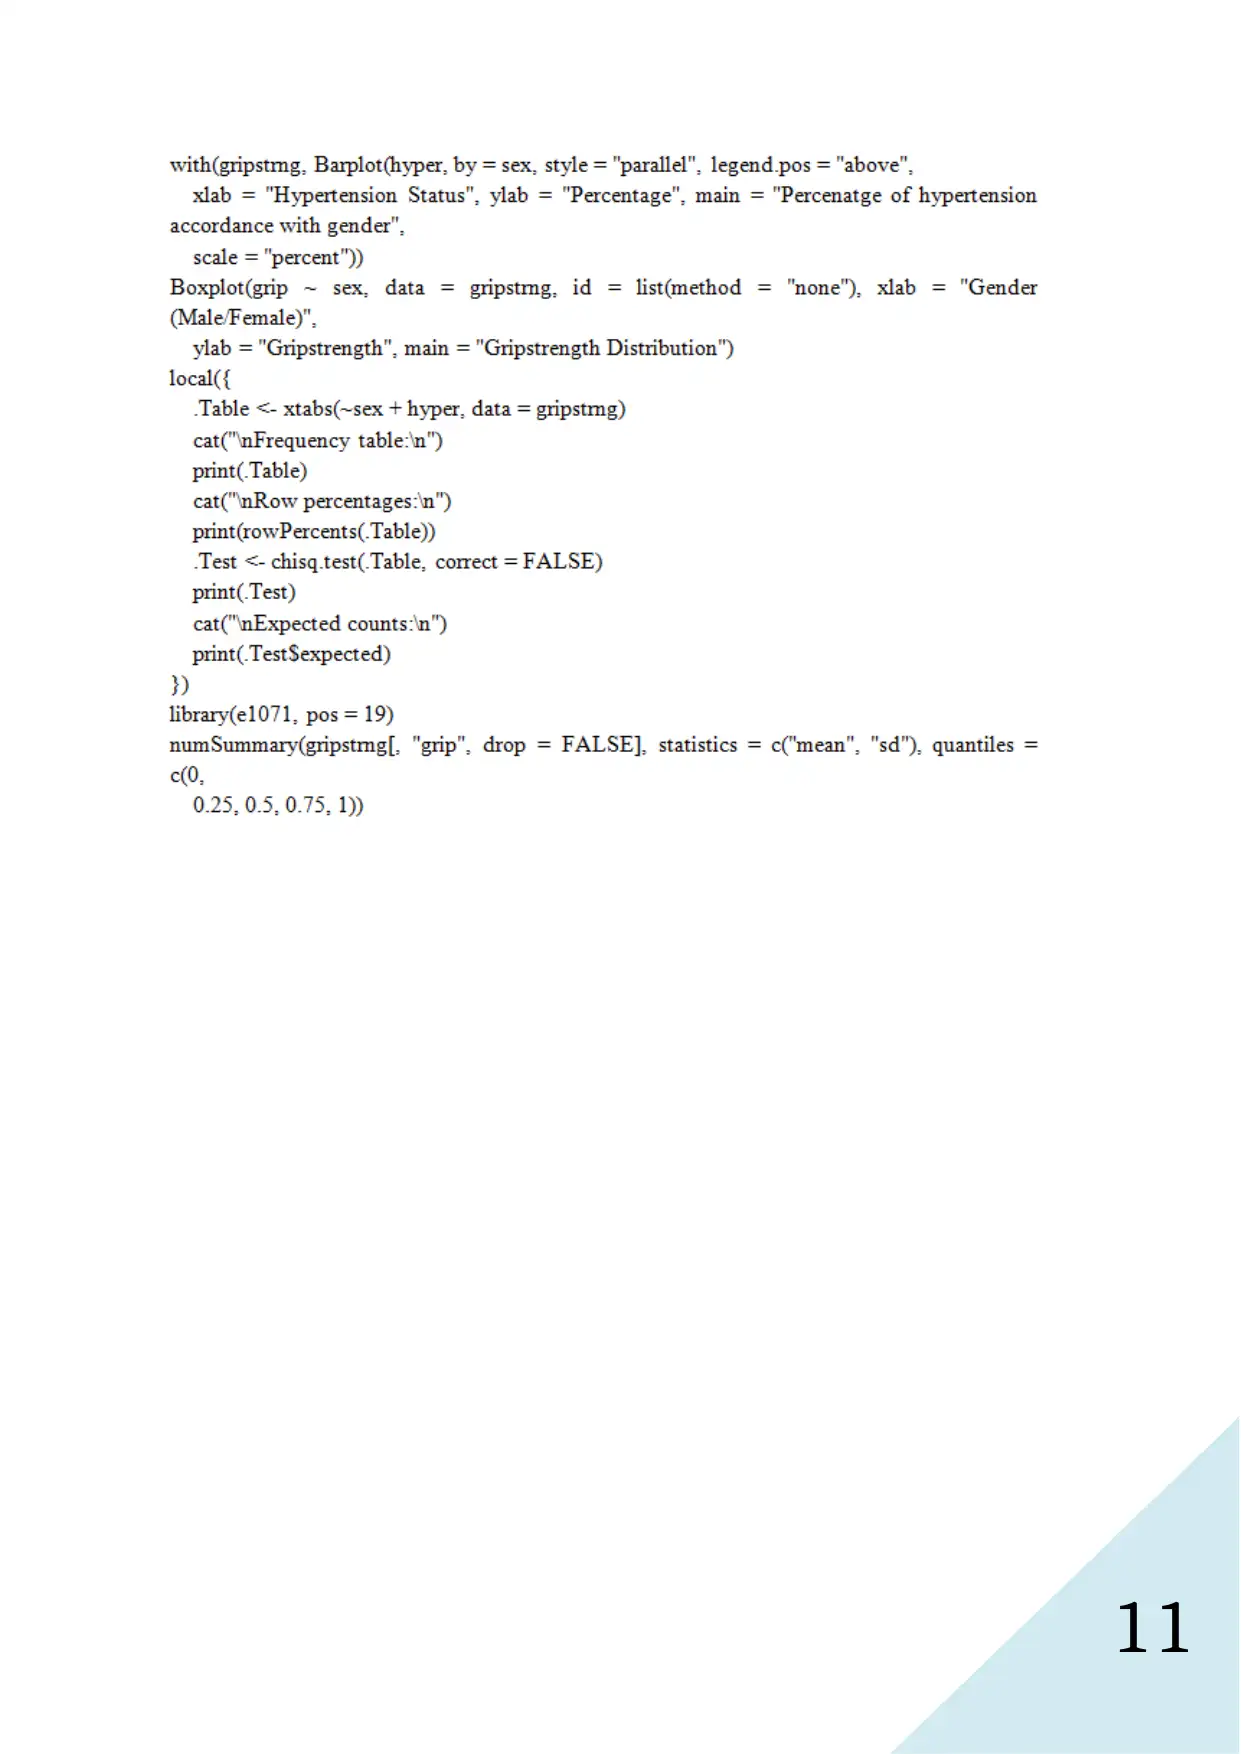
This assignment solution analyzes a dataset related to grandparent carers, focusing on grip strength and hypertension. It includes calculations and interpretations of confidence intervals for grip strength, determining statistical significance. The solution tests hypotheses regarding grip strength differences between males and females using both t-tests and Wilcoxon tests. Further analysis involves testing the proportion of hypertension in grandparents using a Chi-squared test and calculating the confidence interval for the difference in proportions. The assignment also examines grip strength differences between dominant and non-dominant hands using a Wilcoxon sign rank test. Finally, it addresses sample size calculations for detecting differences in hypertension between males and females and determining the margin of error for grip strength measurements. The solution provides detailed steps, R Commander outputs, and conclusions for each analysis.
tabler-icon-diamond-filled.svg

Contribute Materials

Your contribution can guide someone’s learning journey. Share your documents today.
Document Page
1
Assignment 2
tabler-icon-diamond-filled.svg

Secure Best Marks with AI Grader

Need help grading? Try our AI Grader for instant feedback on your assignments.
Document Page
2
Abbreviations:
I. Grip Strength: GS
II. Confidence Interval: CI
III. Dominant: DMN
IV. Non-Dominant: NDMN
Question 1: Answers
a) Method: The 95% CI for GS of grandparent carers in Parramatta has been calculated in
R commander window using one sample t-test.
The 95% CI was identified from the R-output as [31.27, 32.23]. The CI implies that
there is 95% chance that average GS of grandparents will be somewhere between 31.27
kg and 32.23 kg.
b) At 5% level of significance 33 kg GS is significantly different from the estimated GS.
Reason is that GS of 33 kg is outside the 95% confidence interval.
c) Hypothesis testing by independent sample t-test
Step1:
Null hypothesis: There is no difference between averages of GS between male and
females.
Alternate hypothesis: There is significant difference between averages of GS between
male and females (two tailed).
Step 2:
Significance level: 5% => α =0 . 05
Test Selection: According to Shapiro-Wilk test, GS is normally distributed (W = 0.99, p
= 0.96). According to Levene’s test there is no statistical difference between variances
of GS between male and females (F (1, 231) = 1.92, p = 0.17). Therefore, parametric
test is applicable here. Here, a two sample independent t-test has been used.
Document Page
3
Figure 1: Side-by-side box plots for grip strength
Step 3:
Decision Statute:
The test statistic and the p-value are found. If the p-value is less than α=0 . 05 then null
hypothesis will be rejected. Otherwise, the null hypothesis will fail to get rejected.
Step 4:
R Commander Output:
The statistics: t = 1.12, df = 217.73, p-value = 0.265, 95% CI: [-0.42, 1.52]
Step 5:
Conclusion: Null hypothesis failed to get rejected as p-value > 0.05.
Hence, there is no statistically significant difference between average GS of males and
females.
Document Page
4
d) Hypothesis testing by two sample Wilcoxon test
Step1:
Null hypothesis: There is no difference between medians of GS between male and
females.
Alternate hypothesis: There is significant difference between medians of GS between
male and females (two tailed).
Step 2:
Significance level: 5% => α =0 . 05
Test Selection: A non-parametric alternate to independent sample t-test is Wilcoxon test
(also known as Mann Whitney U test).
Step 3:
Decision Statute:
The test statistic and the p-value are found. If the p-value is less than α=0 . 05 then null
hypothesis will be rejected. Otherwise, the null hypothesis will fail to get rejected.
Step 4:
R Commander Output:
The statistics: W = 7401, p-value = 0.216
Step 5:
Conclusion: Null hypothesis failed to get rejected as p-value > 0.05.
Hence, there is no statistically significant difference between medians of GS between
males and females.
tabler-icon-diamond-filled.svg

Secure Best Marks with AI Grader

Need help grading? Try our AI Grader for instant feedback on your assignments.
Document Page
5
Question 2: Answers
a) Hypothesis testing by two sample Wilcoxon test
Step1:
Null hypothesis: Proportion of hypertension grandparents is less than equal to 0.25 in
the sample.
Alternate hypothesis: Proportion of hypertension grandparents is significantly greater
than 0.25 in the sample (right tailed).
Step 2:
Significance level: 5% => α =0 . 05
Test Selection: Non-parametric test Chi-squared test of independence is selected.
Frequency for hypertension and non-hypertension grandparents are both greater than 5.
Step 3:
Decision Statute:
The test statistic and the p-value are found. If the p-value is less than α=0 . 05 then null
hypothesis will be rejected. Otherwise, the null hypothesis will fail to get rejected.
Normal approximation has been considered for this test.
Step 4:
R Commander Output:
The statistics: Chi-squared = 7.2117, df = 1, p-value = 0.004, 95% CI: [0.277, 1.000]
Step 5:
Conclusion: Null hypothesis is rejected as p-value < 0.05.
Hence, proportion of hypertension grandparents is significantly greater than 0.25 in the
sample.
Document Page
6
b) The 95% CI for difference of proportions for male and female hypertension
grandparents is: [-0.03, 0.21]. The CI implies that at 5% level, the above difference of
proportions is somewhere between (-3%) and 21%. Also, the Chi-squared statistic (X-
squared = 2.0541, df = 1, p-value = 0.152) implies that there is no significant difference
between proportions for male and female hypertension grandparents.
Question 3: Answers
Hypothesis testing by matched sample Wilcoxon sign rank test (de Barros, Hidalgo, &
de Lima Cabral, 2018)
Step1:
Null hypothesis: There is no difference between medians of GS between DMN and
NDMN hands.
Alternate hypothesis: Median of NDMN hand GS is significantly lower than DMN
hand (left tailed).
Step 2:
Significance level: 5% => α =0 . 05
Test Selection: A non-parametric alternate to independent sample t-test is Wilcoxon
sign rank test.
Step 3:
Decision Statute:
The calculated test statistic and the critical value of the statistic are found. If W-
calculated is smaller than W-critical value then null hypothesis will be rejected.
Otherwise, the null hypothesis will failed to get rejected.
Step 4:
Wilcoxon statistic is calculated using the table below.
Document Page
7
Table 1: Wilcoxon test rank calculation
T+ = |sum of positive ranks| = |8 + 3 + 6 + 1.5 + 1.5 + 5 + 4| = 29
T- = |sum of negative ranks| = |- 7| = 7
W-calculated = min (T+, T-) = min (29, 7) = 7
W-critical at 5% level (one sided, n = 8) = 6
So, W-calculated > W-critical
Step 5:
Conclusion: Null hypothesis failed to get rejected as W-calculated > W-critical.
Hence, there is no statistically significant difference between medians of GS between
DMN and NDMN hands.
Question 4: Answers
a) Proportion of females with hypertension is 28.5% (from two way contingency table).
Figure 2: Gender wise percentage of grandparents with hypertension
tabler-icon-diamond-filled.svg

Paraphrase This Document

Need a fresh take? Get an instant paraphrase of this document with our AI Paraphraser
Document Page
8
Table 2: Two-way contingency table for male/female proportion of hypertension
Freq (%) Hypertension Non-hypertension Total
Male 41 (37.3%) 69 (62.7%) 110
Female 35 (28.5%) 88 (71.5%) 123
b) Margin of error = 4% = ME, Female proportion = 28.5% = p
Power = 80% = 1 – β, CI = 95% = 1 - α , n =?
Assumption: Equal number of males and females in the sample.
Sample size:
n= 20 .285(10 .285 )(1. 96+0 . 84 )2
( 0. 04 ) 2 =1996 . 991997
Minimum sample size of 1997 is required for any clinical significant difference in
hypertension between males and females (Champely et. al., 2018).
c) Standard deviation of grip strength from R Commander is: 3.72 kg.
d) Margin of error = 1.5 kg, SD GS = 3.72 kg, CI = 95% = 1 - α , n =?
Sample size:
n= ( Z0 . 025S
ME )
2
= ( 1. 963 .72
1. 5 )
2
=23 . 6324
Minimum sample size of 28 grandparents is required to achieve a margin of error of 1.5
kg at 5% level of significance.
e) Confidence interval = 1 – level of significance. So, lesser the confidence higher will be
level of significance, and higher the level of significance so will be the Type 1 error.
Hence, 50% CI will have higher Type 1 error compared to 95% CI. True null hypothesis
will have 50% chance of being rejected (Morey, Hoekstra, Rouder, Lee, & Wagenmakers,
2016).
Document Page
9
References
Champely, S., Ekstrom, C., Dalgaard, P., Gill, J., Wunder, J., & De Rosario, H. (2018). Basic
functions for power analysis. R Package Version https://cran. r-project.
org/web/packages/pwr/pwr. pdf.
de Barros, R. S. M., Hidalgo, J. I. G., & de Lima Cabral, D. R. (2018). Wilcoxon rank sum
test drift detector. Neurocomputing, 275, 1954-1963.
Morey, R. D., Hoekstra, R., Rouder, J. N., Lee, M. D., & Wagenmakers, E. J. (2016). The
fallacy of placing confidence in confidence intervals. Psychonomic bulletin &
review, 23(1), 103-123.
Document Page
10
Appendices – R Commander Codes
tabler-icon-diamond-filled.svg

Secure Best Marks with AI Grader

Need help grading? Try our AI Grader for instant feedback on your assignments.
Document Page
11
chevron_up_icon
1 out of 11
circle_padding
hide_on_mobile
zoom_out_icon
logo.png

Your All-in-One AI-Powered Toolkit for Academic Success.

Available 24*7 on WhatsApp / Email

[object Object]