King's Own Institute ECO100 Introduction to Economics Assignment
VerifiedAdded on 2022/12/23
|13
|3088
|83
Homework Assignment
AI Summary
This document presents a comprehensive solution to an ECO100 Introduction to Economics assignment. The assignment addresses several key economic concepts, beginning with the calculation of equilibrium price and quantity using supply and demand equations, along with graphical representations. It then explores the concepts of consumer and producer surplus, and price elasticity of demand and supply, providing detailed calculations and interpretations. The assignment further delves into the production possibility frontier (PPF), analyzing China's PPF for clothing and rice, including explanations for its concave shape and the assumptions underlying its construction. The solution also discusses production and allocative efficiency within the PPF framework, along with the impact of technological advancements on the PPF. Finally, the assignment examines the Australian espresso coffee market, determining whether firms are price takers or makers, and explaining the market's growth using demand and supply models, including factors like quality, changing culture, and international competition.
Running head: ECO 100 INTRODUCTION TO ECONOMICS
ECO 100 Introduction to Economics
Name
University
ECO 100 Introduction to Economics
Name
University
Paraphrase This Document
Need a fresh take? Get an instant paraphrase of this document with our AI Paraphraser
ECO 100 INTRODUCTION TO ECONOMICS 2
Question One
a) Equilibrium quantity
The quantity demand and quantity supply are equal at equilibrium.
P = 200 – 0.4QD (1)
P = 20 + 0.5QS (2)
Demand = 200 - 0.4Q
Supply = 20 + 0.5Q
200 - 0.4Q = 20 + 0.5Q
200 – 20 = 0.5Q + 0.4Q
180 = 0.9Q
Quantity (Q) = 180/ 0.9
= 200 Kilograms
Since, Supply = Demand at equilibrium;
The price equation is P = 200 – 0.4Q
P = 200 – 0.4(200)
P= 200-80
P= 120
Therefore, the Equilibrium price = $120.
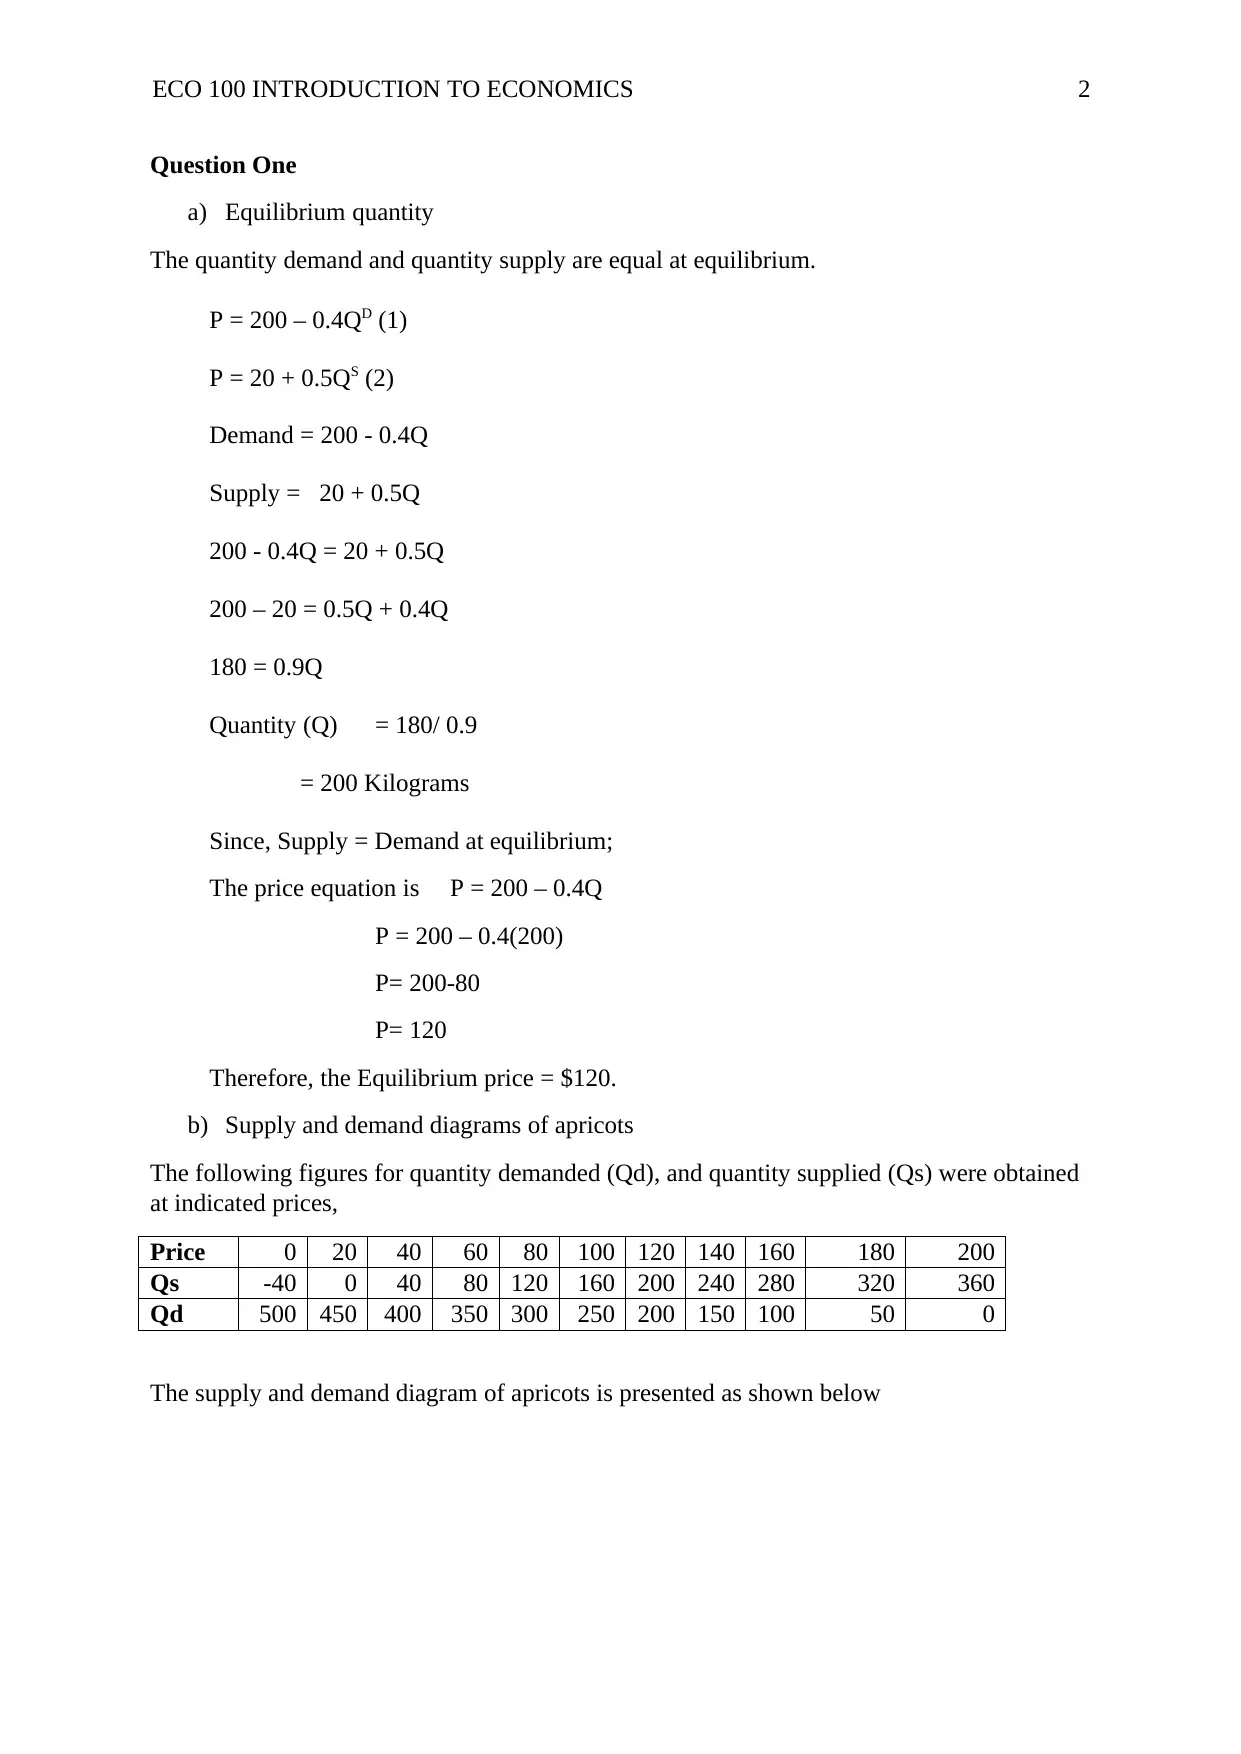
b) Supply and demand diagrams of apricots
The following figures for quantity demanded (Qd), and quantity supplied (Qs) were obtained
at indicated prices,
Price 0 20 40 60 80 100 120 140 160 180 200
Qs -40 0 40 80 120 160 200 240 280 320 360
Qd 500 450 400 350 300 250 200 150 100 50 0
The supply and demand diagram of apricots is presented as shown below
Question One
a) Equilibrium quantity
The quantity demand and quantity supply are equal at equilibrium.
P = 200 – 0.4QD (1)
P = 20 + 0.5QS (2)
Demand = 200 - 0.4Q
Supply = 20 + 0.5Q
200 - 0.4Q = 20 + 0.5Q
200 – 20 = 0.5Q + 0.4Q
180 = 0.9Q
Quantity (Q) = 180/ 0.9
= 200 Kilograms
Since, Supply = Demand at equilibrium;
The price equation is P = 200 – 0.4Q
P = 200 – 0.4(200)
P= 200-80
P= 120
Therefore, the Equilibrium price = $120.
b) Supply and demand diagrams of apricots
The following figures for quantity demanded (Qd), and quantity supplied (Qs) were obtained
at indicated prices,
Price 0 20 40 60 80 100 120 140 160 180 200
Qs -40 0 40 80 120 160 200 240 280 320 360
Qd 500 450 400 350 300 250 200 150 100 50 0
The supply and demand diagram of apricots is presented as shown below
ECO 100 INTRODUCTION TO ECONOMICS 3
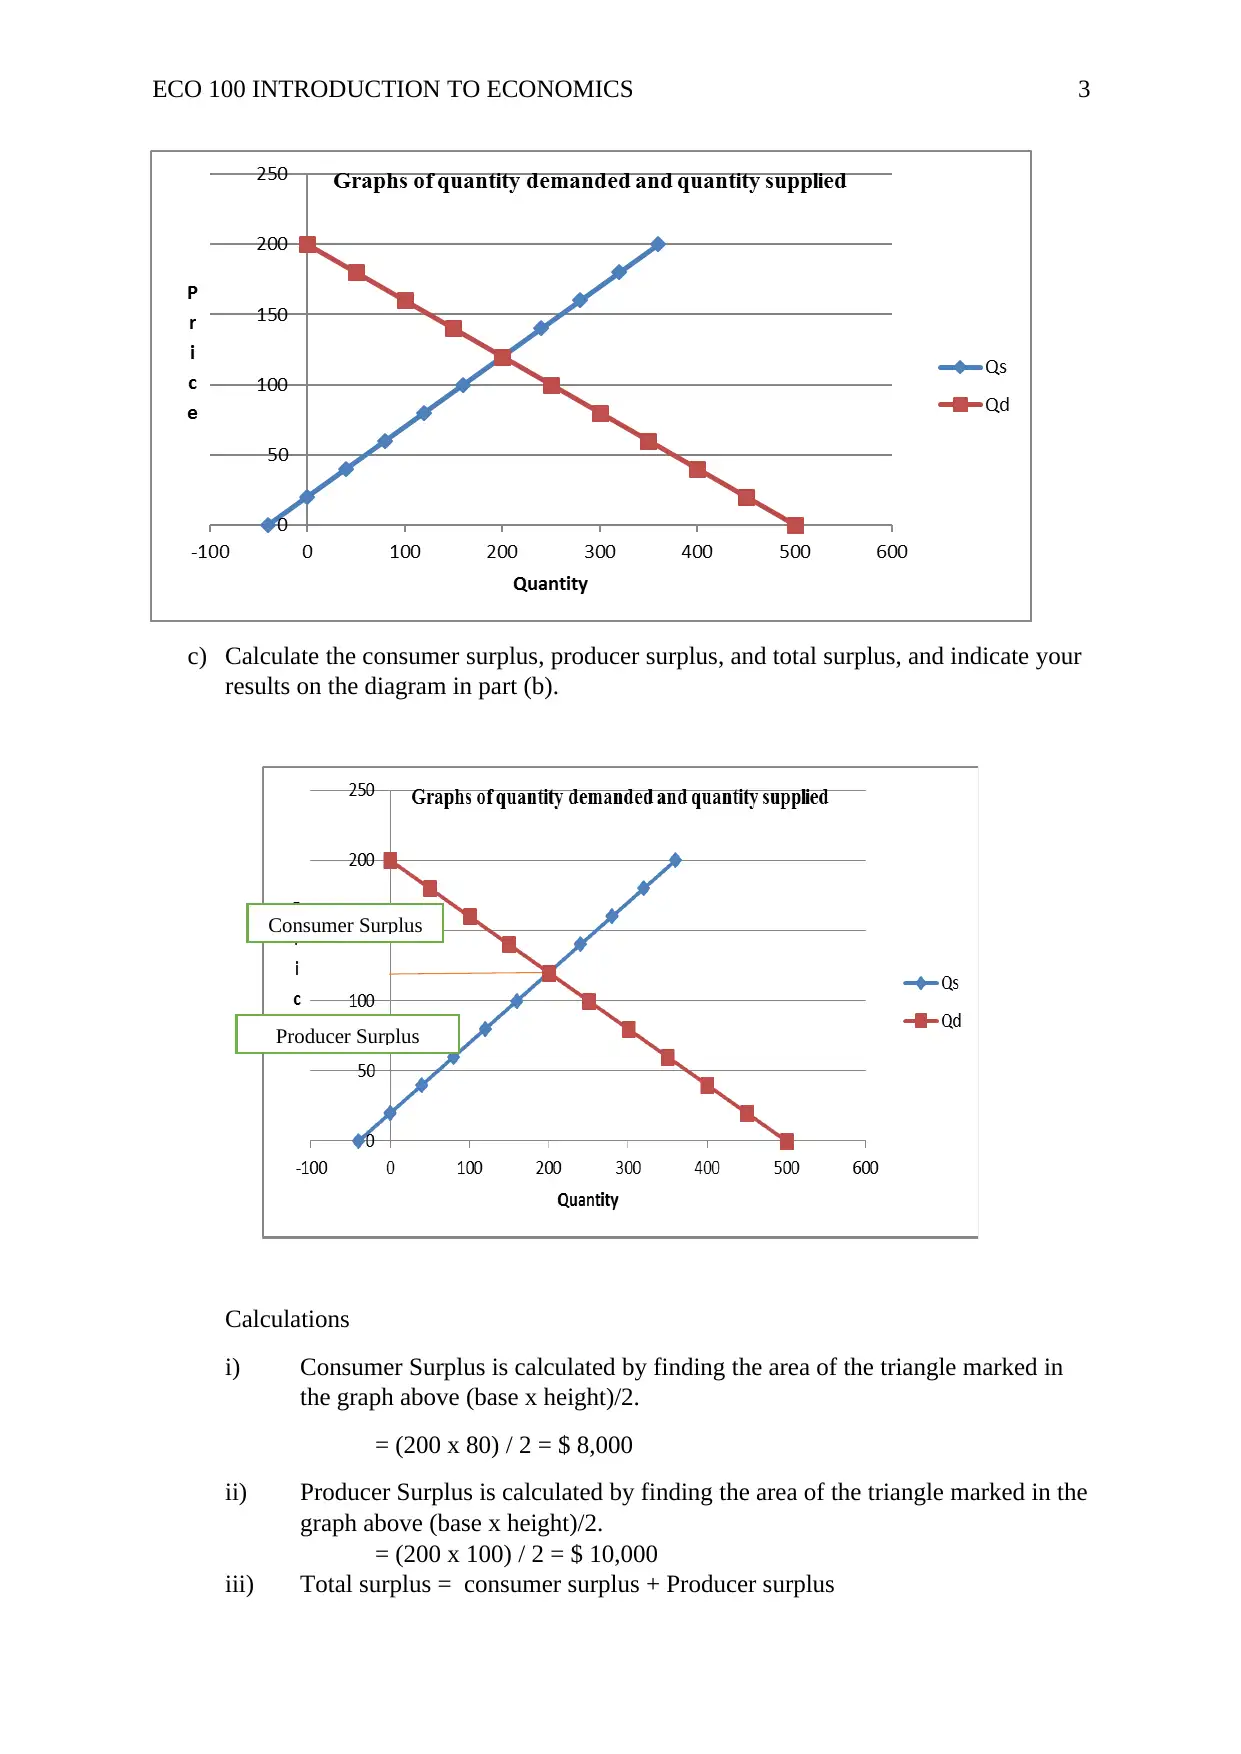
c) Calculate the consumer surplus, producer surplus, and total surplus, and indicate your
results on the diagram in part (b).
Calculations
i) Consumer Surplus is calculated by finding the area of the triangle marked in
the graph above (base x height)/2.
= (200 x 80) / 2 = $ 8,000
ii) Producer Surplus is calculated by finding the area of the triangle marked in the
graph above (base x height)/2.
= (200 x 100) / 2 = $ 10,000
iii) Total surplus = consumer surplus + Producer surplus
Consumer Surplus
Producer Surplus
⊘ This is a preview!⊘
Do you want full access?
Subscribe today to unlock all pages.
Trusted by 1+ million students worldwide
ECO 100 INTRODUCTION TO ECONOMICS 4
= $ 8,000 + $ 10,000
= $ 18,000.
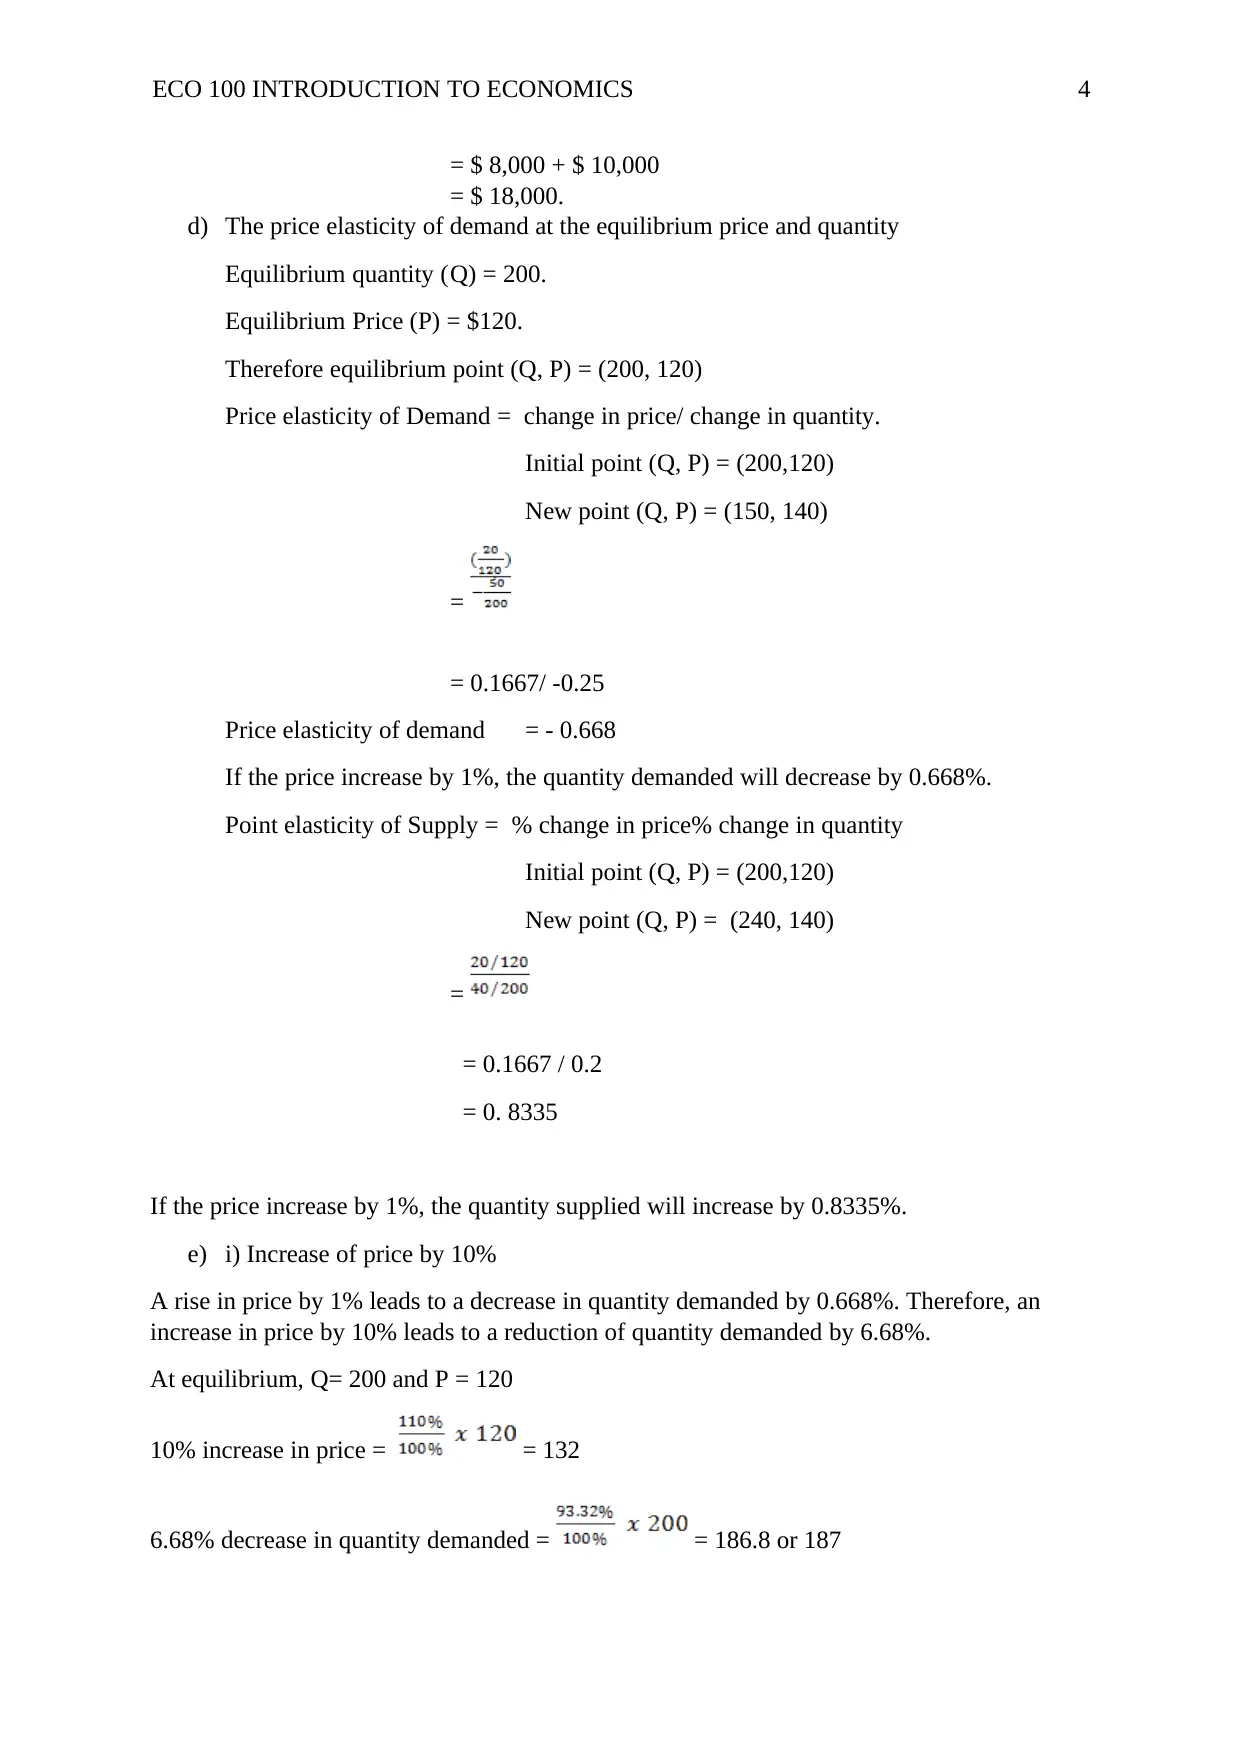
d) The price elasticity of demand at the equilibrium price and quantity
Equilibrium quantity (Q) = 200.
Equilibrium Price (P) = $120.
Therefore equilibrium point (Q, P) = (200, 120)
Price elasticity of Demand = change in price/ change in quantity.
Initial point (Q, P) = (200,120)
New point (Q, P) = (150, 140)
=
= 0.1667/ -0.25
Price elasticity of demand = - 0.668
If the price increase by 1%, the quantity demanded will decrease by 0.668%.
Point elasticity of Supply = % change in price% change in quantity
Initial point (Q, P) = (200,120)
New point (Q, P) = (240, 140)
=
= 0.1667 / 0.2
= 0. 8335
If the price increase by 1%, the quantity supplied will increase by 0.8335%.
e) i) Increase of price by 10%
A rise in price by 1% leads to a decrease in quantity demanded by 0.668%. Therefore, an
increase in price by 10% leads to a reduction of quantity demanded by 6.68%.
At equilibrium, Q= 200 and P = 120
10% increase in price = = 132
6.68% decrease in quantity demanded = = 186.8 or 187
= $ 8,000 + $ 10,000
= $ 18,000.
d) The price elasticity of demand at the equilibrium price and quantity
Equilibrium quantity (Q) = 200.
Equilibrium Price (P) = $120.
Therefore equilibrium point (Q, P) = (200, 120)
Price elasticity of Demand = change in price/ change in quantity.
Initial point (Q, P) = (200,120)
New point (Q, P) = (150, 140)
=
= 0.1667/ -0.25
Price elasticity of demand = - 0.668
If the price increase by 1%, the quantity demanded will decrease by 0.668%.
Point elasticity of Supply = % change in price% change in quantity
Initial point (Q, P) = (200,120)
New point (Q, P) = (240, 140)
=
= 0.1667 / 0.2
= 0. 8335
If the price increase by 1%, the quantity supplied will increase by 0.8335%.
e) i) Increase of price by 10%
A rise in price by 1% leads to a decrease in quantity demanded by 0.668%. Therefore, an
increase in price by 10% leads to a reduction of quantity demanded by 6.68%.
At equilibrium, Q= 200 and P = 120
10% increase in price = = 132
6.68% decrease in quantity demanded = = 186.8 or 187
Paraphrase This Document
Need a fresh take? Get an instant paraphrase of this document with our AI Paraphraser
ECO 100 INTRODUCTION TO ECONOMICS 5
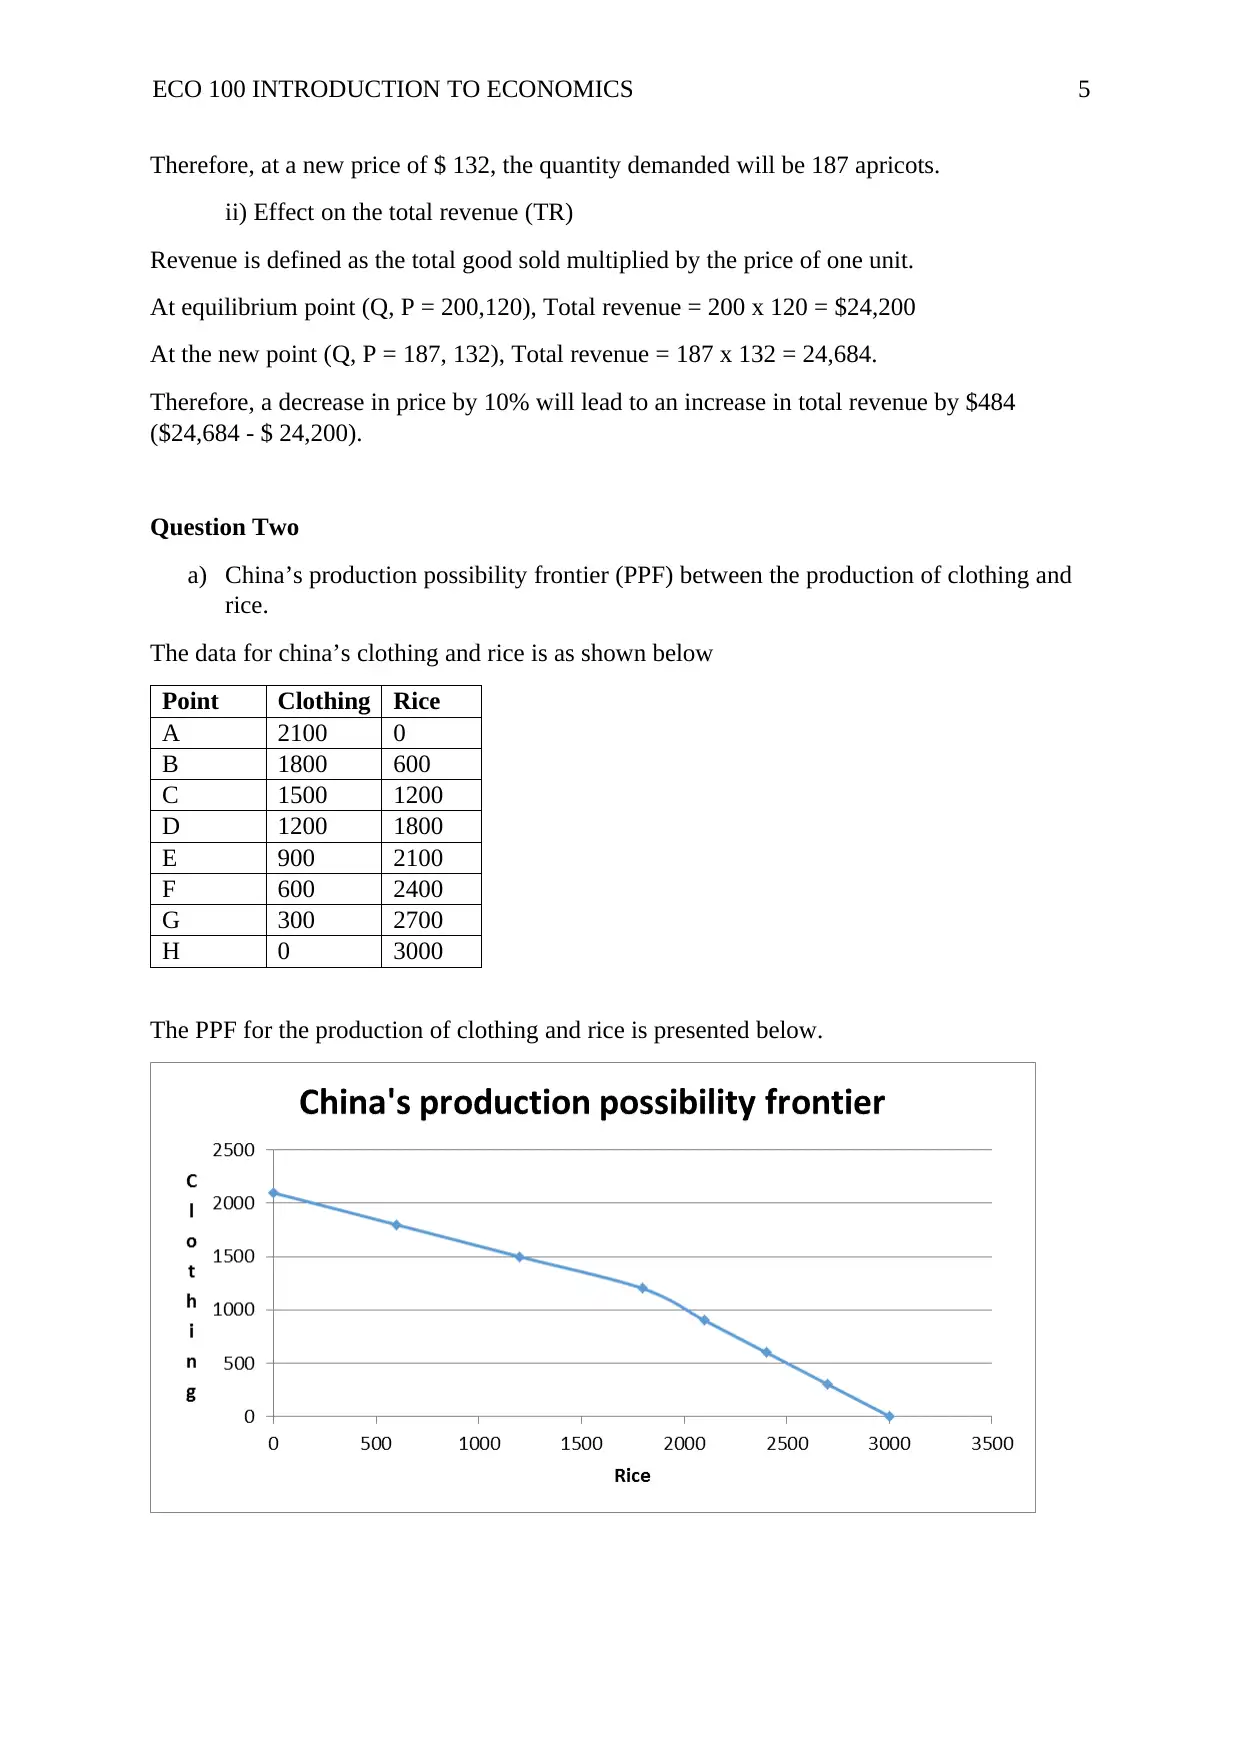
Therefore, at a new price of $ 132, the quantity demanded will be 187 apricots.
ii) Effect on the total revenue (TR)
Revenue is defined as the total good sold multiplied by the price of one unit.
At equilibrium point (Q, P = 200,120), Total revenue = 200 x 120 = $24,200
At the new point (Q, P = 187, 132), Total revenue = 187 x 132 = 24,684.
Therefore, a decrease in price by 10% will lead to an increase in total revenue by $484
($24,684 - $ 24,200).
Question Two
a) China’s production possibility frontier (PPF) between the production of clothing and
rice.
The data for china’s clothing and rice is as shown below
Point Clothing Rice
A 2100 0
B 1800 600
C 1500 1200
D 1200 1800
E 900 2100
F 600 2400
G 300 2700
H 0 3000
The PPF for the production of clothing and rice is presented below.
ECO 100 INTRODUCTION TO ECONOMICS 6
b) Why is the PPF curve concave?
China’s economy is faced with limited resources for production. The economy cannot
produce clothing and rice products concurrently. In other words, the production of rice must
be forgone to produce the maximum quantity of clothing and vice versa. Likewise, for China
to produce more rice it has to give up on the production of a given quantity of clothing.
Therefore, the PPF curve is concave because of the increasing marginal/ opportunity cost
associated with producing more of the clothing while reducing rice or providing more of rice
and reducing the production of clothing (Banerjee & Warrier, 2018).
c) Assumptions for constructing a PPF
There are four critical assumptions for the construction of a PPF curve. First, it is
assumed that the available resources are only used to produce one or both goods. Second, the
quantity of available resources remains the same. Third, applied production techniques and
technology remain the same. And fourth, the available resources for the production are used
efficiently (Sloman, Norris, & Garett, 2014).
d) Production Efficiency and Allocative Efficiency
In a democratic economy, decisions making process involves different stakeholders
who are guided by several factors. Some of the factors which help stakeholder in making
production decisions are production cost, availability of resources, time, and market
demands. Production decisions are based on the need to maximize the output from the
available inputs (resources). Maximization of output is based on the concept of efficiency
which is explained as a lack of waste from the production process. There are two types of
efficiency under production possibilities frontier (PPF), that is, the allocative efficiency and
productive efficiency (Jones, 2014).
⊘ This is a preview!⊘
Do you want full access?
Subscribe today to unlock all pages.
Trusted by 1+ million students worldwide
ECO 100 INTRODUCTION TO ECONOMICS 7
Economics explains production efficiency as the impossibility of producing more of
one item without reducing the quantity produced of another item using the available
resources. For instance, in China’s PPF, the economy can only use the available resources to
produce 1800 clothing and 600 rice at point B. In order to produce a quantity of 1200 rice, the
quantity of clothing must be reduced to 1500 items. Production efficiency for China’s PPF
can only be illustrated along the PPF curve. The production below or above the PPF curve is
considered to be production inefficiency because resources would be wasted. In other words,
China can only experience production efficiency by choosing a production combination
which falls along the PPF curve (Bishop, Parrott, Martie, & Miller, 2014).
On the other hand, allocative efficiency is explained as the production-based on the
consumers' desire. For example, a low-income society would prefer food over cars.
Therefore, producers will use the available resources to produce more food items and fewer
cars. Likewise, consider a society with both young and older population faced with the
making a choice between education and health. The producers will produce more educational
resources for the young population and health products for the older population. Allocative
efficiency is achieved at a given point along the PPF curve. For instance, China’s society
prefers 2100 clothing and 0 rice at point A and 900 clothing and 2100 rice at point E
(Krugman & Wells, 2015).
e) Suppose the adoption of a new technology for growing rice lowers the cost of
producing rice, allowing yields to increase by 100%. Show and explain the impact of
this technological change on the initial production possibility frontier in part (a).
Adoption of new technology would reduce the cost associated with the production of
rice because it leads to production efficiency. Subsequently, the initial yield would increase
Paraphrase This Document
Need a fresh take? Get an instant paraphrase of this document with our AI Paraphraser
ECO 100 INTRODUCTION TO ECONOMICS 8
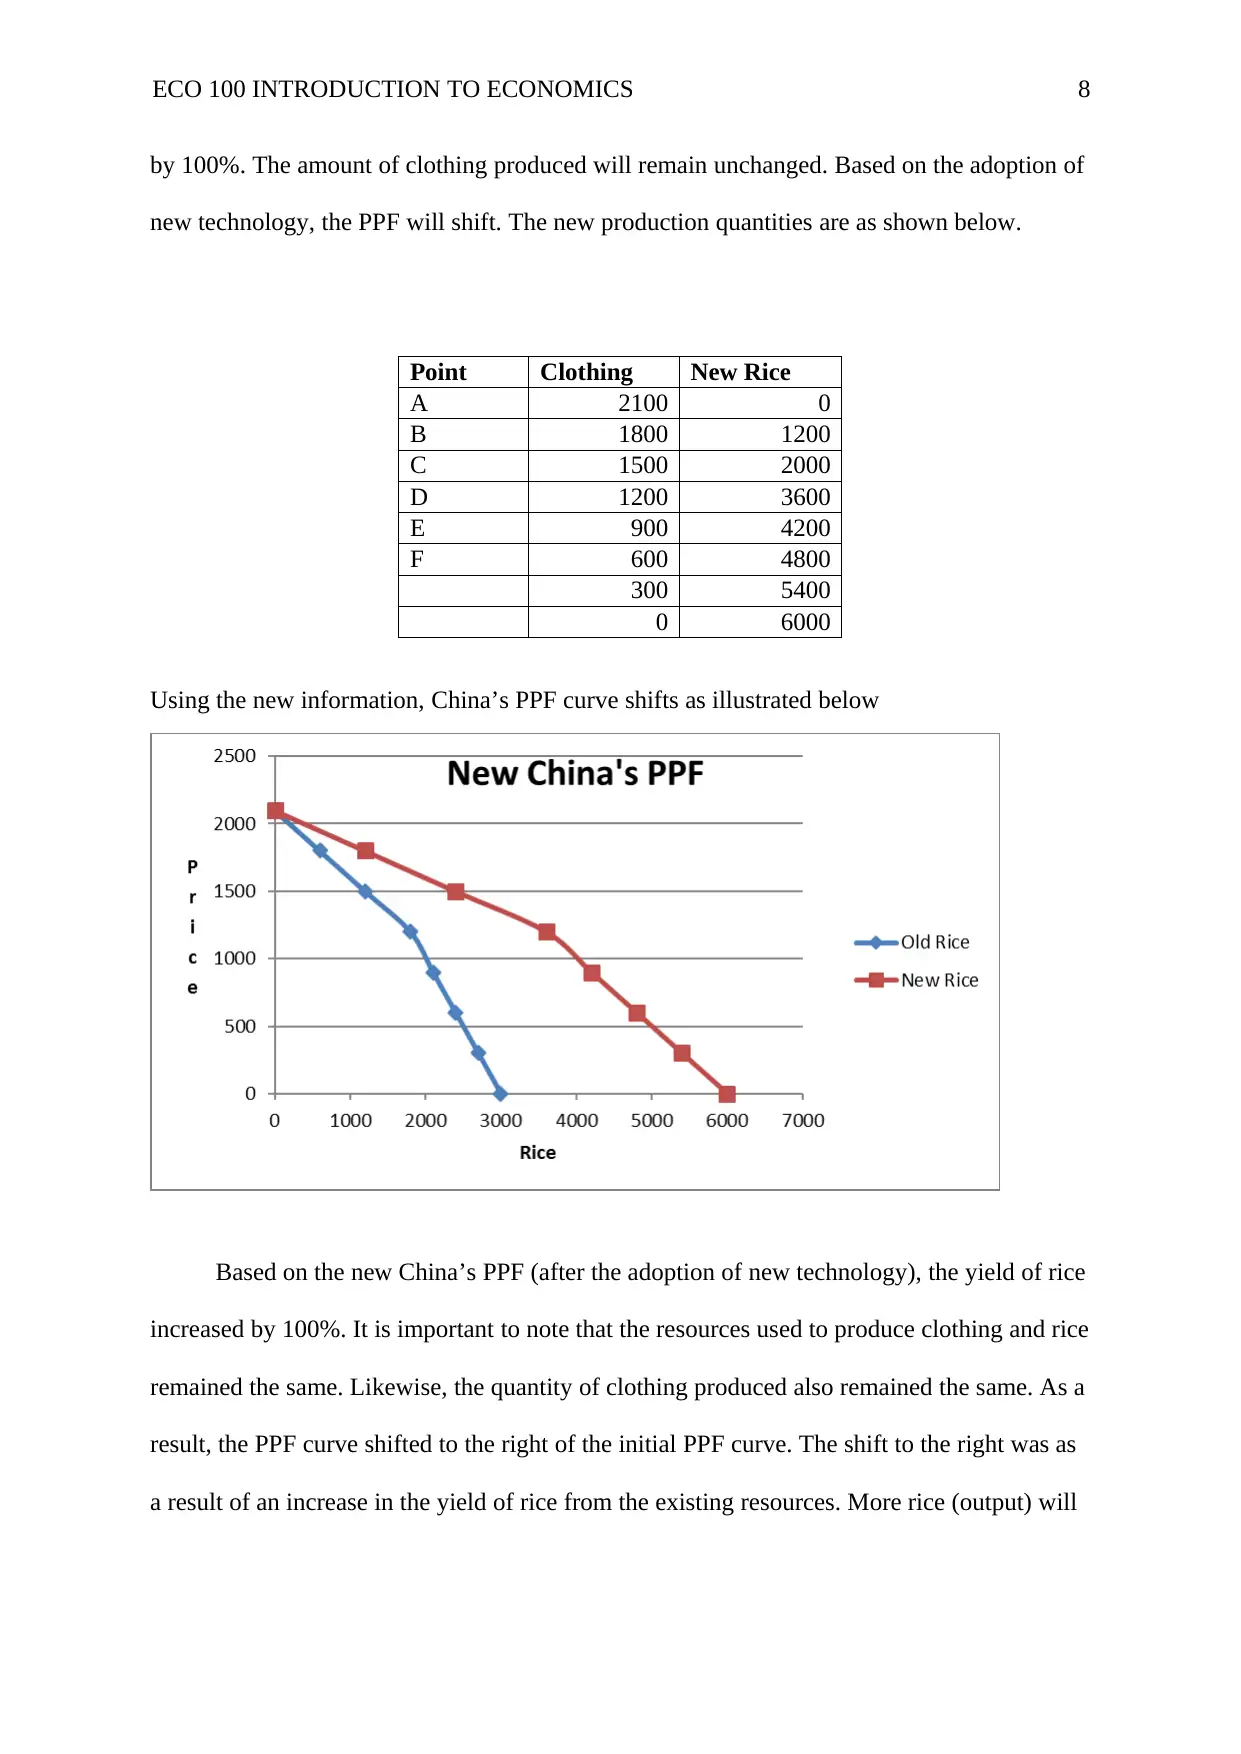
by 100%. The amount of clothing produced will remain unchanged. Based on the adoption of
new technology, the PPF will shift. The new production quantities are as shown below.
Point Clothing New Rice
A 2100 0
B 1800 1200
C 1500 2000
D 1200 3600
E 900 4200
F 600 4800
300 5400
0 6000
Using the new information, China’s PPF curve shifts as illustrated below
Based on the new China’s PPF (after the adoption of new technology), the yield of rice
increased by 100%. It is important to note that the resources used to produce clothing and rice
remained the same. Likewise, the quantity of clothing produced also remained the same. As a
result, the PPF curve shifted to the right of the initial PPF curve. The shift to the right was as
a result of an increase in the yield of rice from the existing resources. More rice (output) will
ECO 100 INTRODUCTION TO ECONOMICS 9
be produced using the same amount of resources (input). The improvement in technology
causes an outward shift in the production possibility frontier curve (Gillespie, 2014).
Question Three
a) Is the espresso coffee market, are firms price takers or price makers? Explain.
Economics defines price takers has participants in the market who cannot dictate the
price of their products in the market. Price takers have to accept the existing price in the
market. Price takers operate in a market where;
a) There are many sellers and many buyers,
b) The products are identical,
c) And, buyers have easy access to information on product prices.
On the other hand, price makers enjoy the power to dictate the price of their products in
the market. The power to become a price maker is influenced by factors such as;
a) High barrier to market entry or exit,
b) Existence of monopoly and oligopoly firms in the market,
c) And, buyers hold imperfect information on the price of products.
The Australian espresso coffee market has a few large players. Some of the companies
operating in the market include Starbucks, Nestle, McCafe, and Gloria Jeans. The companies
enjoy the ability to differentiate their coffees products according to consumers taste and
preferences. Large espresso coffee companies engage in mergers and acquisitions of smaller
companies to increase or maintain their market shares (Bishop, Parrott, Martie, & Miller,
2014). Second, a few large companies enjoy economies of scale, which is not available for
smaller companies. As a result, entrants by new companies is limited. Likewise, small
companies cannot survive in the market for long; they are forced to either shut down or a
⊘ This is a preview!⊘
Do you want full access?
Subscribe today to unlock all pages.
Trusted by 1+ million students worldwide
ECO 100 INTRODUCTION TO ECONOMICS
10
merger with more substantial companies (Krugman & Wells, 2015). Lastly, consumers are
ready to pay any prices as far as the quality of coffee is guaranteed. Based on this market
features, the Australian espresso coffee market has a price maker structure. One, there is an
existence of oligopoly. Second, companies use taste and quality to differentiate their
products. And third, consumers hold imperfect information about the market; they are
interested more with the quality of the coffee (Hubbard, 2014).
b) With the aid of an appropriate economic model, explain why there has been such an
explosion in the number of coffee chains in Australia over the past ten years.
The growth of the Australian coffee market can be explained using the demand and
supply economic model. Demand refers to the ability and willingness to buy a given quantity
of a product at a given price. On the other hand, supply refers the quantity of a product that
producers are willing to sell at a given price. Change in demand and supply is influenced
factors such as quality, taste and preference and technology and innovation, among others
(Gillespie, 2014).
An explosion in the number of coffee chains in Australia has been witnessed over the
past 10 years. The significant growth has been influenced by; a) availability of quality
coffees, b) well-trained baristas, c) changing culture, and d) diversification of consumers
expectation. Moreover, international coffee chains have joined the Australian market bring in
their global expertise and experience.
Apart from the factors that have been mentioned above, Australians have developed a
culture of consuming quality foods in a welcoming and relaxed atmosphere. Many people are
moving away from the culture of heading home after a busy day to joining their friends and
family for a cup of coffee. Consumers have also acquired adequate information in the
Paraphrase This Document
Need a fresh take? Get an instant paraphrase of this document with our AI Paraphraser
ECO 100 INTRODUCTION TO ECONOMICS
11
availability of quality coffee within their environment. For example, there are plenty of
webpages and blog posts that inform consumers about the location of coffee shops, the price,
and quality of coffee being offered by each café (Banerjee & Warrier, 2018).
Considering the competitive nature of the Australian coffee industry, coffee shop
owners have turned their attention to operational efficiency. Australian Baristas have become
more efficient with resources, time and productivity. Lack of operation efficiency leads to
poor quality and high cost of production. Subsequently, the final price of coffee becomes
expenses lowering the demand and revenue realized. On the other hand, operational
efficiency results in high productivity, high quality and low cost of production. Operational
efficiency also increases the economies of scale enjoyed by coffee shops (Jones, 2014).
c) Do you foresee firms in the market making positive economic profit in the long run?
Explain.
Positive economic profit refers to the profit realized when the total revenue is higher
than total cost in the long run. In the long run, the total cost declines first before increases
beyond a desirable point. On the other hand, the total revenue increases first before
decreasing beyond a desirable point. The total cost and total revenue start to increase and fall
respectively beyond the economies of scale. The Australian coffee market is considered to be
monopolistically competitive. Unlike perfectly competitive market which can make economic
profits in the long run, monopolistically competitive market cannot. Therefore, firms
operating in the Australian coffee market cannot realize positive economic market in the long
run (Bishop, Parrott, Martie, & Miller, 2014).
d) Would the impact of government subsidy to each existing firm change your answer in
part (c) in the short run? Explain
ECO 100 INTRODUCTION TO ECONOMICS
12
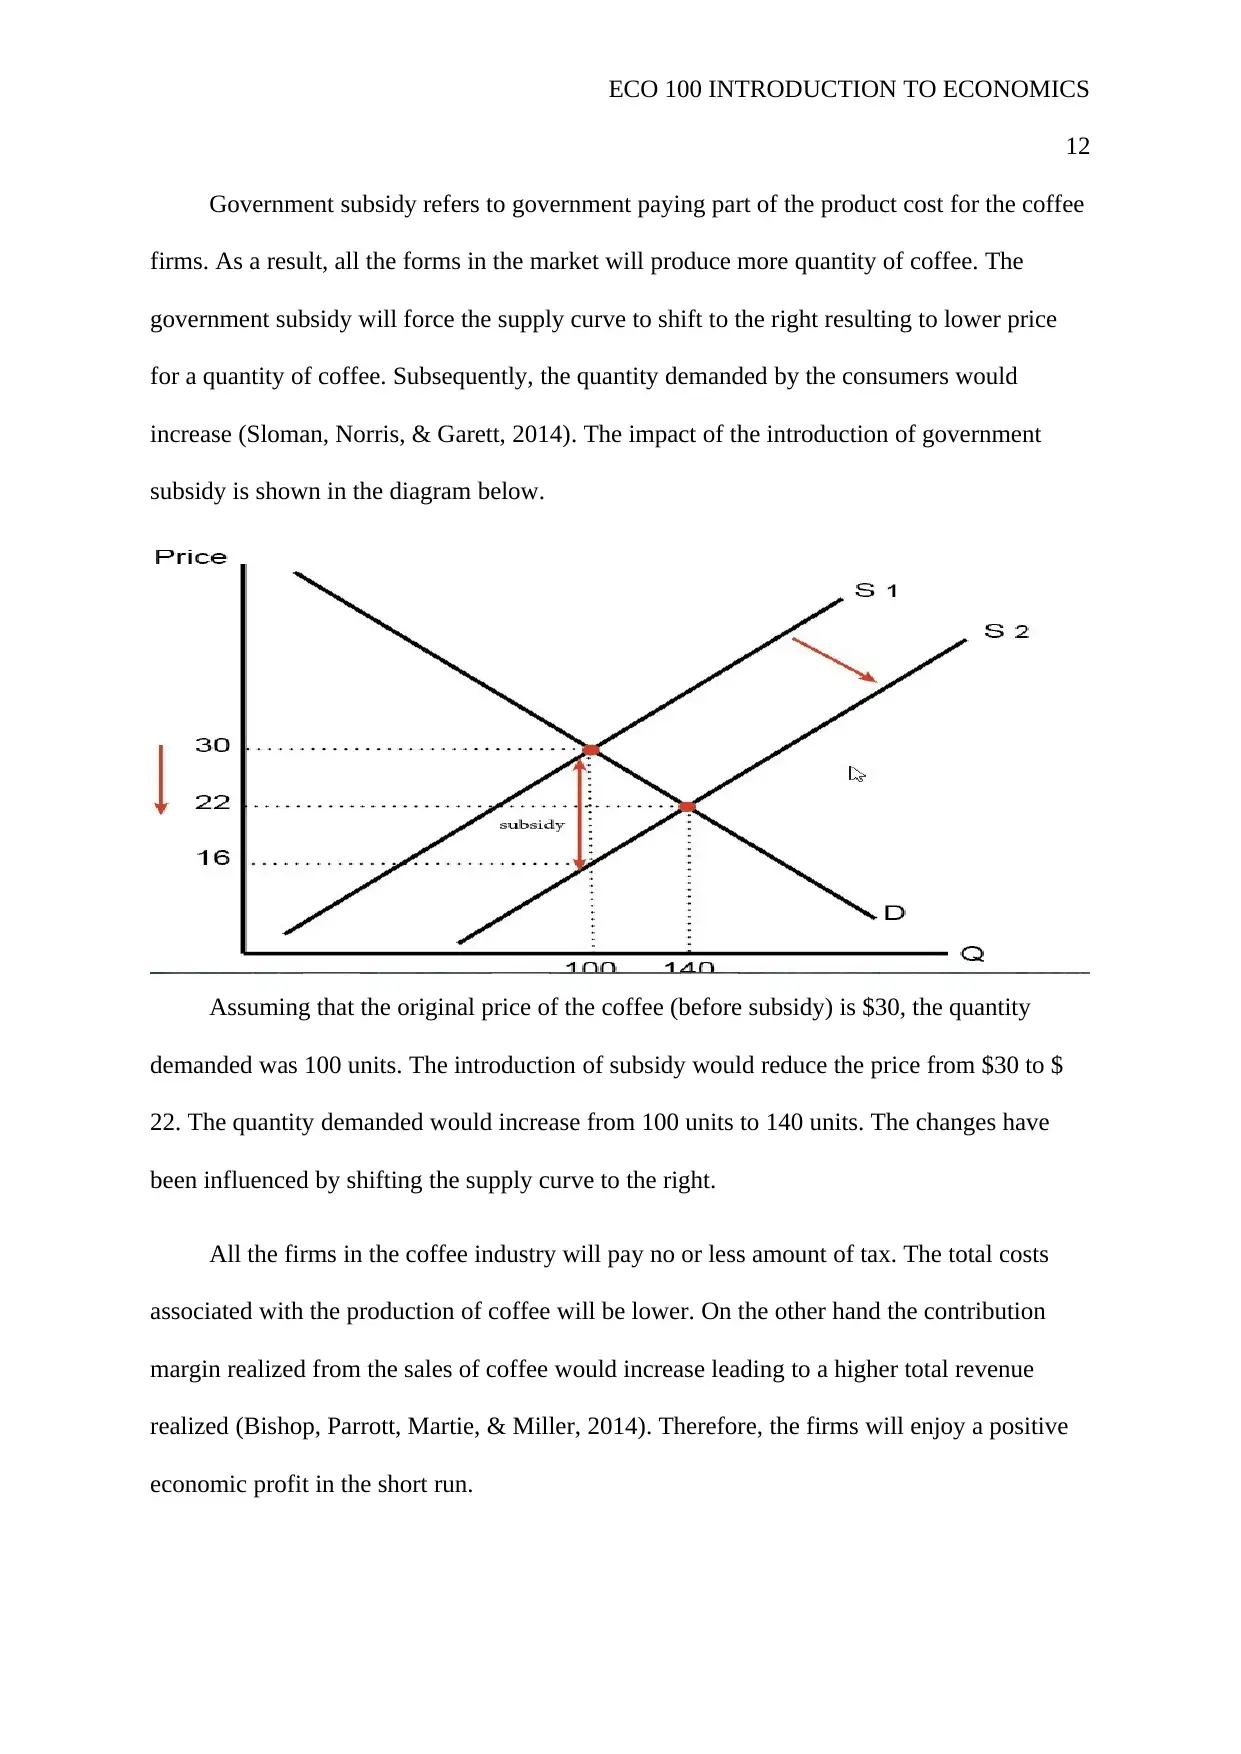
Government subsidy refers to government paying part of the product cost for the coffee
firms. As a result, all the forms in the market will produce more quantity of coffee. The
government subsidy will force the supply curve to shift to the right resulting to lower price
for a quantity of coffee. Subsequently, the quantity demanded by the consumers would
increase (Sloman, Norris, & Garett, 2014). The impact of the introduction of government
subsidy is shown in the diagram below.
Assuming that the original price of the coffee (before subsidy) is $30, the quantity
demanded was 100 units. The introduction of subsidy would reduce the price from $30 to $
22. The quantity demanded would increase from 100 units to 140 units. The changes have
been influenced by shifting the supply curve to the right.
All the firms in the coffee industry will pay no or less amount of tax. The total costs
associated with the production of coffee will be lower. On the other hand the contribution
margin realized from the sales of coffee would increase leading to a higher total revenue
realized (Bishop, Parrott, Martie, & Miller, 2014). Therefore, the firms will enjoy a positive
economic profit in the short run.
12
Government subsidy refers to government paying part of the product cost for the coffee
firms. As a result, all the forms in the market will produce more quantity of coffee. The
government subsidy will force the supply curve to shift to the right resulting to lower price
for a quantity of coffee. Subsequently, the quantity demanded by the consumers would
increase (Sloman, Norris, & Garett, 2014). The impact of the introduction of government
subsidy is shown in the diagram below.
Assuming that the original price of the coffee (before subsidy) is $30, the quantity
demanded was 100 units. The introduction of subsidy would reduce the price from $30 to $
22. The quantity demanded would increase from 100 units to 140 units. The changes have
been influenced by shifting the supply curve to the right.
All the firms in the coffee industry will pay no or less amount of tax. The total costs
associated with the production of coffee will be lower. On the other hand the contribution
margin realized from the sales of coffee would increase leading to a higher total revenue
realized (Bishop, Parrott, Martie, & Miller, 2014). Therefore, the firms will enjoy a positive
economic profit in the short run.
⊘ This is a preview!⊘
Do you want full access?
Subscribe today to unlock all pages.
Trusted by 1+ million students worldwide
1 out of 13
Related Documents


Your All-in-One AI-Powered Toolkit for Academic Success.
+13062052269
info@desklib.com
Available 24*7 on WhatsApp / Email
![[object Object]](/_next/static/media/star-bottom.7253800d.svg)
Unlock your academic potential
Copyright © 2020–2026 A2Z Services. All Rights Reserved. Developed and managed by ZUCOL.