ATMC BUS102 Introduction to Economics, Semester 2: Article Responses

Verified

Added on  2022/10/17

|6
|1028
|68
Homework Assignment
AI Summary
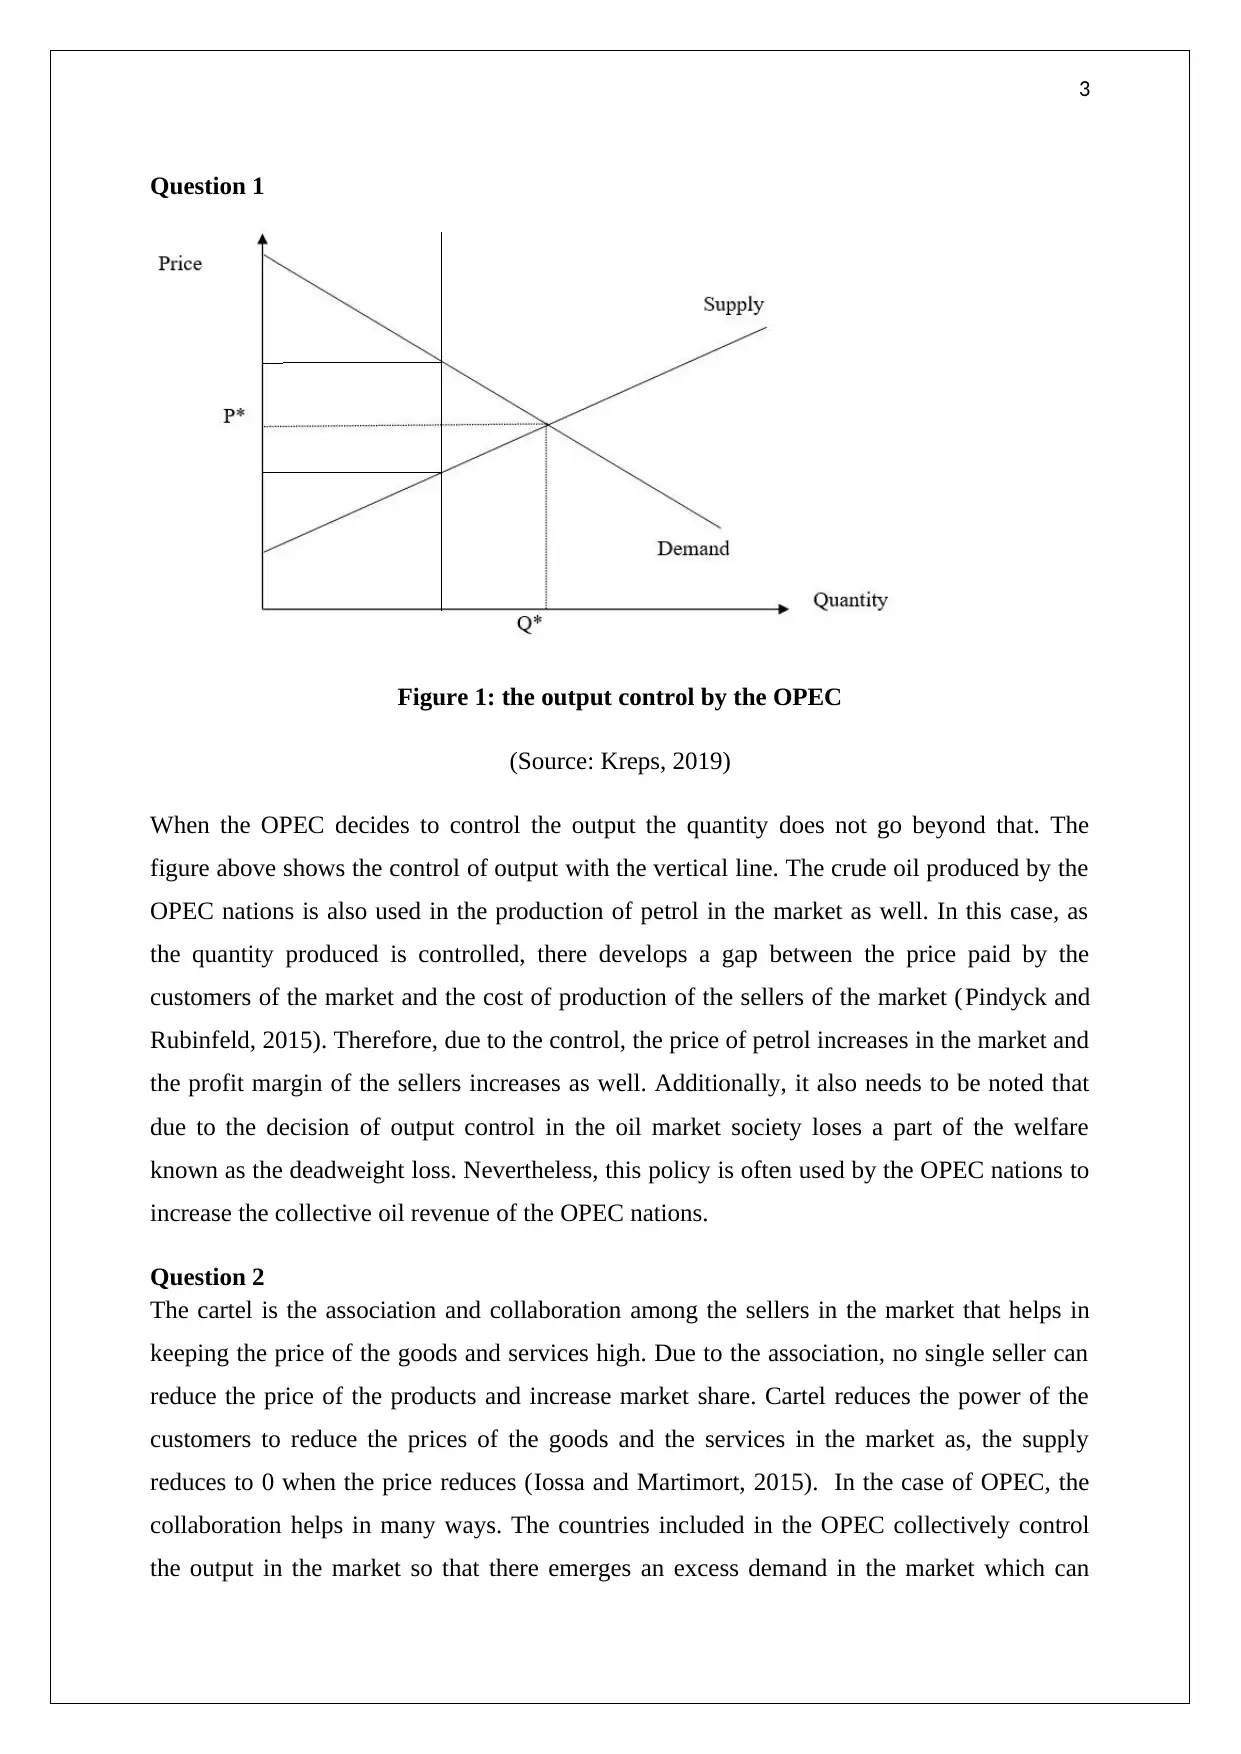
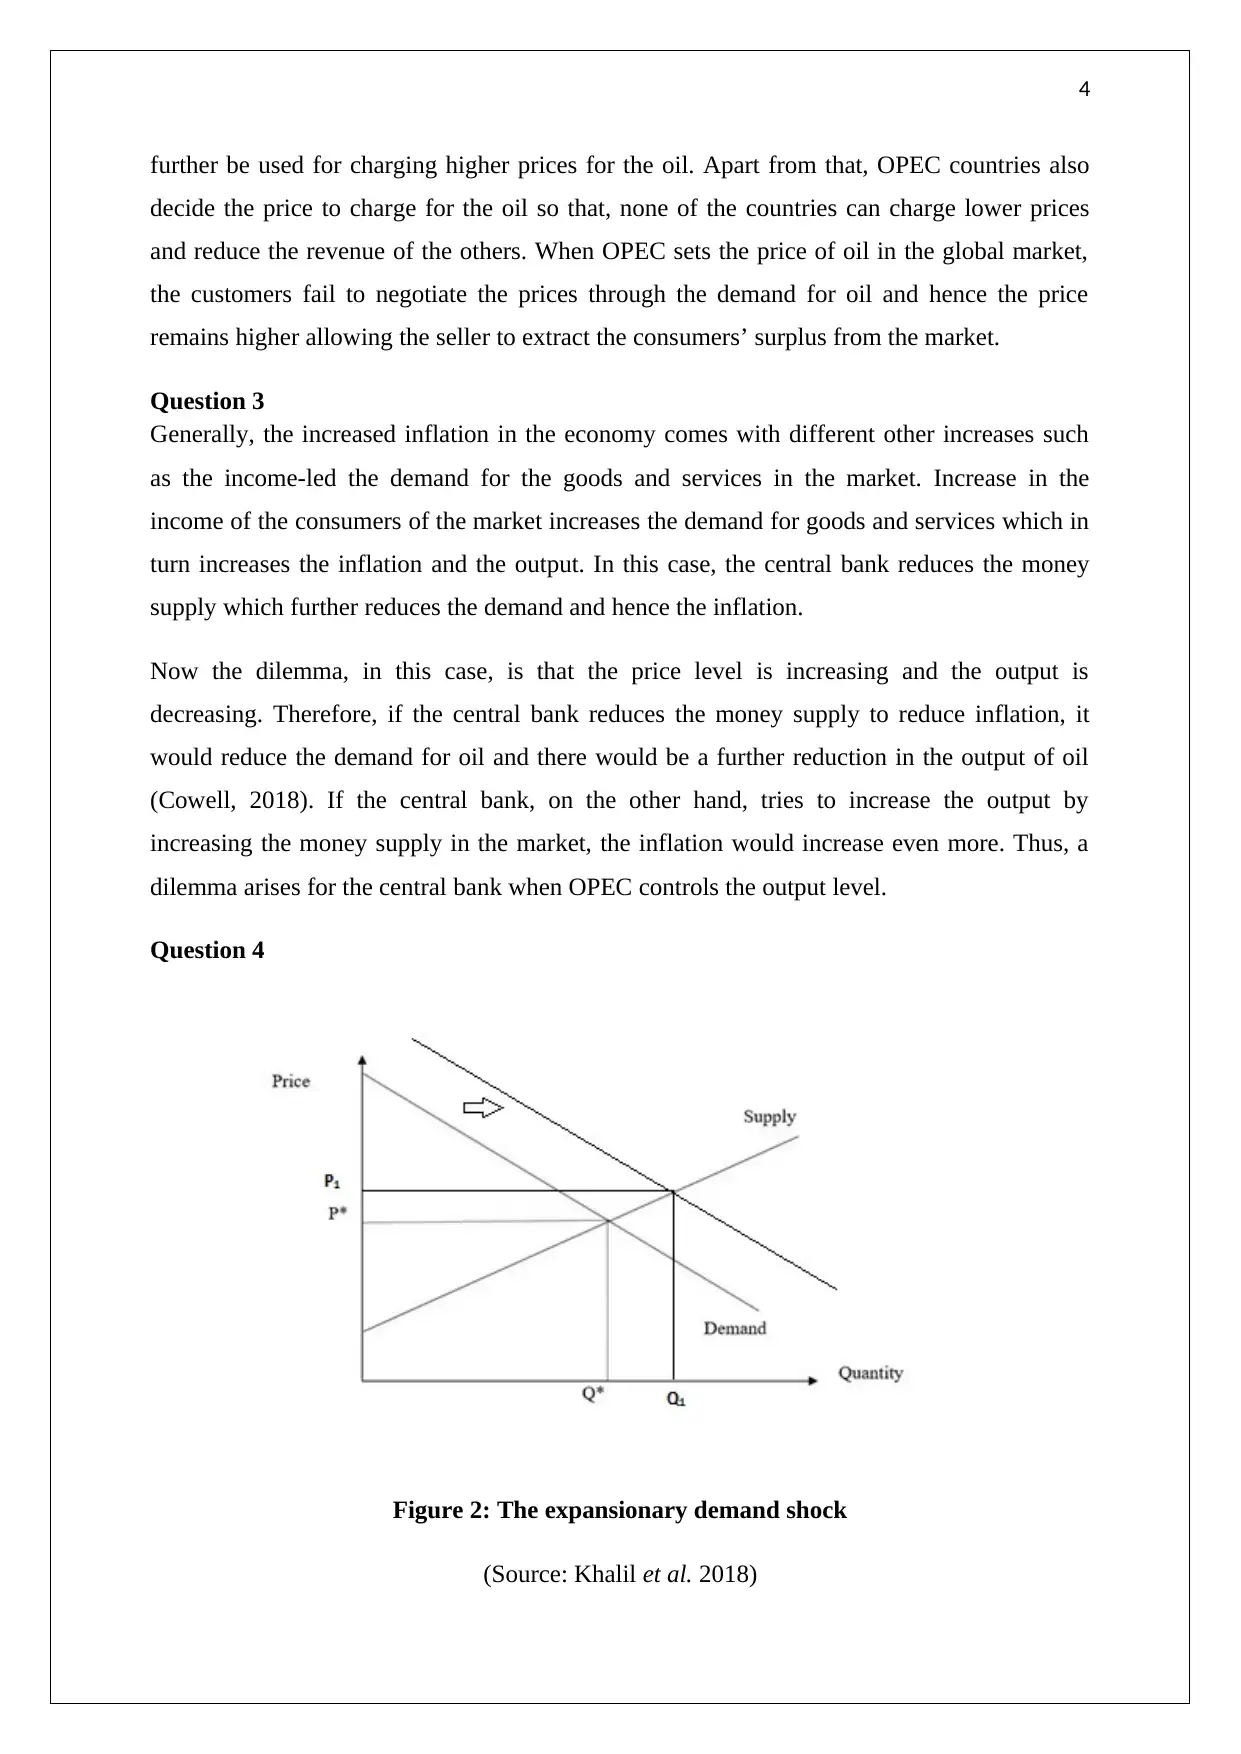
This assignment solution for BUS102 Introduction to Economics analyzes the impact of OPEC's output control on petrol prices, explaining the concept of cartels and how OPEC operates to influence the market. It addresses the dilemma faced by central banks regarding inflation and output when OPEC restricts oil supply. The solution further examines the effects of expansionary demand shocks on oil prices and evaluates the consequences of Saudi Arabia's decision to maximize oil production. The analysis is supported by demand and supply diagrams and references relevant economic literature, providing a comprehensive understanding of the dynamics within the oil market and its broader economic implications.
Document Page
1
ATMC BUS102 INTRODUCTION TO ECONOMICS –
SEMESTER 2 2019
tabler-icon-diamond-filled.svg

Paraphrase This Document

Need a fresh take? Get an instant paraphrase of this document with our AI Paraphraser
Document Page
2
Contents
Question 1...............................................................................................................................3
Question 2...............................................................................................................................3
Question 3...............................................................................................................................4
Question 4...............................................................................................................................4
Question 5...............................................................................................................................5
Reference................................................................................................................................6
Document Page
3
Question 1
Figure 1: the output control by the OPEC
(Source: Kreps, 2019)
When the OPEC decides to control the output the quantity does not go beyond that. The
figure above shows the control of output with the vertical line. The crude oil produced by the
OPEC nations is also used in the production of petrol in the market as well. In this case, as
the quantity produced is controlled, there develops a gap between the price paid by the
customers of the market and the cost of production of the sellers of the market (Pindyck and
Rubinfeld, 2015). Therefore, due to the control, the price of petrol increases in the market and
the profit margin of the sellers increases as well. Additionally, it also needs to be noted that
due to the decision of output control in the oil market society loses a part of the welfare
known as the deadweight loss. Nevertheless, this policy is often used by the OPEC nations to
increase the collective oil revenue of the OPEC nations.
Question 2
The cartel is the association and collaboration among the sellers in the market that helps in
keeping the price of the goods and services high. Due to the association, no single seller can
reduce the price of the products and increase market share. Cartel reduces the power of the
customers to reduce the prices of the goods and the services in the market as, the supply
reduces to 0 when the price reduces (Iossa and Martimort, 2015). In the case of OPEC, the
collaboration helps in many ways. The countries included in the OPEC collectively control
the output in the market so that there emerges an excess demand in the market which can
Document Page
4
further be used for charging higher prices for the oil. Apart from that, OPEC countries also
decide the price to charge for the oil so that, none of the countries can charge lower prices
and reduce the revenue of the others. When OPEC sets the price of oil in the global market,
the customers fail to negotiate the prices through the demand for oil and hence the price
remains higher allowing the seller to extract the consumers’ surplus from the market.
Question 3
Generally, the increased inflation in the economy comes with different other increases such
as the income-led the demand for the goods and services in the market. Increase in the
income of the consumers of the market increases the demand for goods and services which in
turn increases the inflation and the output. In this case, the central bank reduces the money
supply which further reduces the demand and hence the inflation.
Now the dilemma, in this case, is that the price level is increasing and the output is
decreasing. Therefore, if the central bank reduces the money supply to reduce inflation, it
would reduce the demand for oil and there would be a further reduction in the output of oil
(Cowell, 2018). If the central bank, on the other hand, tries to increase the output by
increasing the money supply in the market, the inflation would increase even more. Thus, a
dilemma arises for the central bank when OPEC controls the output level.
Question 4
Figure 2: The expansionary demand shock
(Source: Khalil et al. 2018)
tabler-icon-diamond-filled.svg

Paraphrase This Document

Need a fresh take? Get an instant paraphrase of this document with our AI Paraphraser
Document Page
5
The expansionary demand shock would increase the demand for oil in the market. As a result,
the demand curve would shift to the right side as shown in the diagram. The supply curve
would remain unchanged as demand shock has no effects on the supply side. Therefore, the
new demand curve and the supply curve for oil would show a higher price and higher
quantity sold in the market. The price increases from P* to P1 and the quantity sold in the
market increases from Q* to Q1. Therefore the expansionary demand shock leads to higher oil
prices in the market.
Question 5
Figure 3: The decision of Saudi Arabia to maximise demand
(Source: Pindyck and Rubinfeld, 2015)
When Saudi Arabia decided to maximise the production of oil in the market the supply of all
the firms in the market increased. Consequently, the supply curve shifted to the right side as
shown in the above diagram. The demand curve did not get affected due to the decision of the
government to maximise profit (Khalil et al. 2018). Thus, the new supply curve and the
demand curve come to an equilibrium where the prices of oil are lower than before and the
quantity sold is higher. From the above diagram, it can be seen that the price has fallen from
P* to P1 and the quantity sold in the market has risen from Q* to Q1. Therefore the decisions of
Saudi Arabia to maximise production reduced the price of oil in the market and increased the
quantity sold.
Document Page
6
Reference
Cowell, F., 2018. Microeconomics: principles and analysis. Oxford University Press, pp.36-
38.
Iossa, E. and Martimort, D., 2015. The simple microeconomics of publicprivate
partnerships. Journal of Public Economic Theory, 17(1), pp.4-48.
Khalil, F., Lawarree, J. and Scott, T.J., 2018. Applied Microeconomics,pp.45-91.
Kreps, D.M., 2019. Microeconomics for managers. Princeton University Press, pp.45-87.
Pindyck, R.S. and Rubinfeld, D.L., 2015. Microeconomics. Boston: Pearson,, pp.125-135.
chevron_up_icon
1 out of 6
circle_padding
hide_on_mobile
zoom_out_icon
[object Object]