Introduction to Economics: NZ and Australia Analysis
VerifiedAdded on 2020/03/02
|11
|2296
|363
Homework Assignment
AI Summary
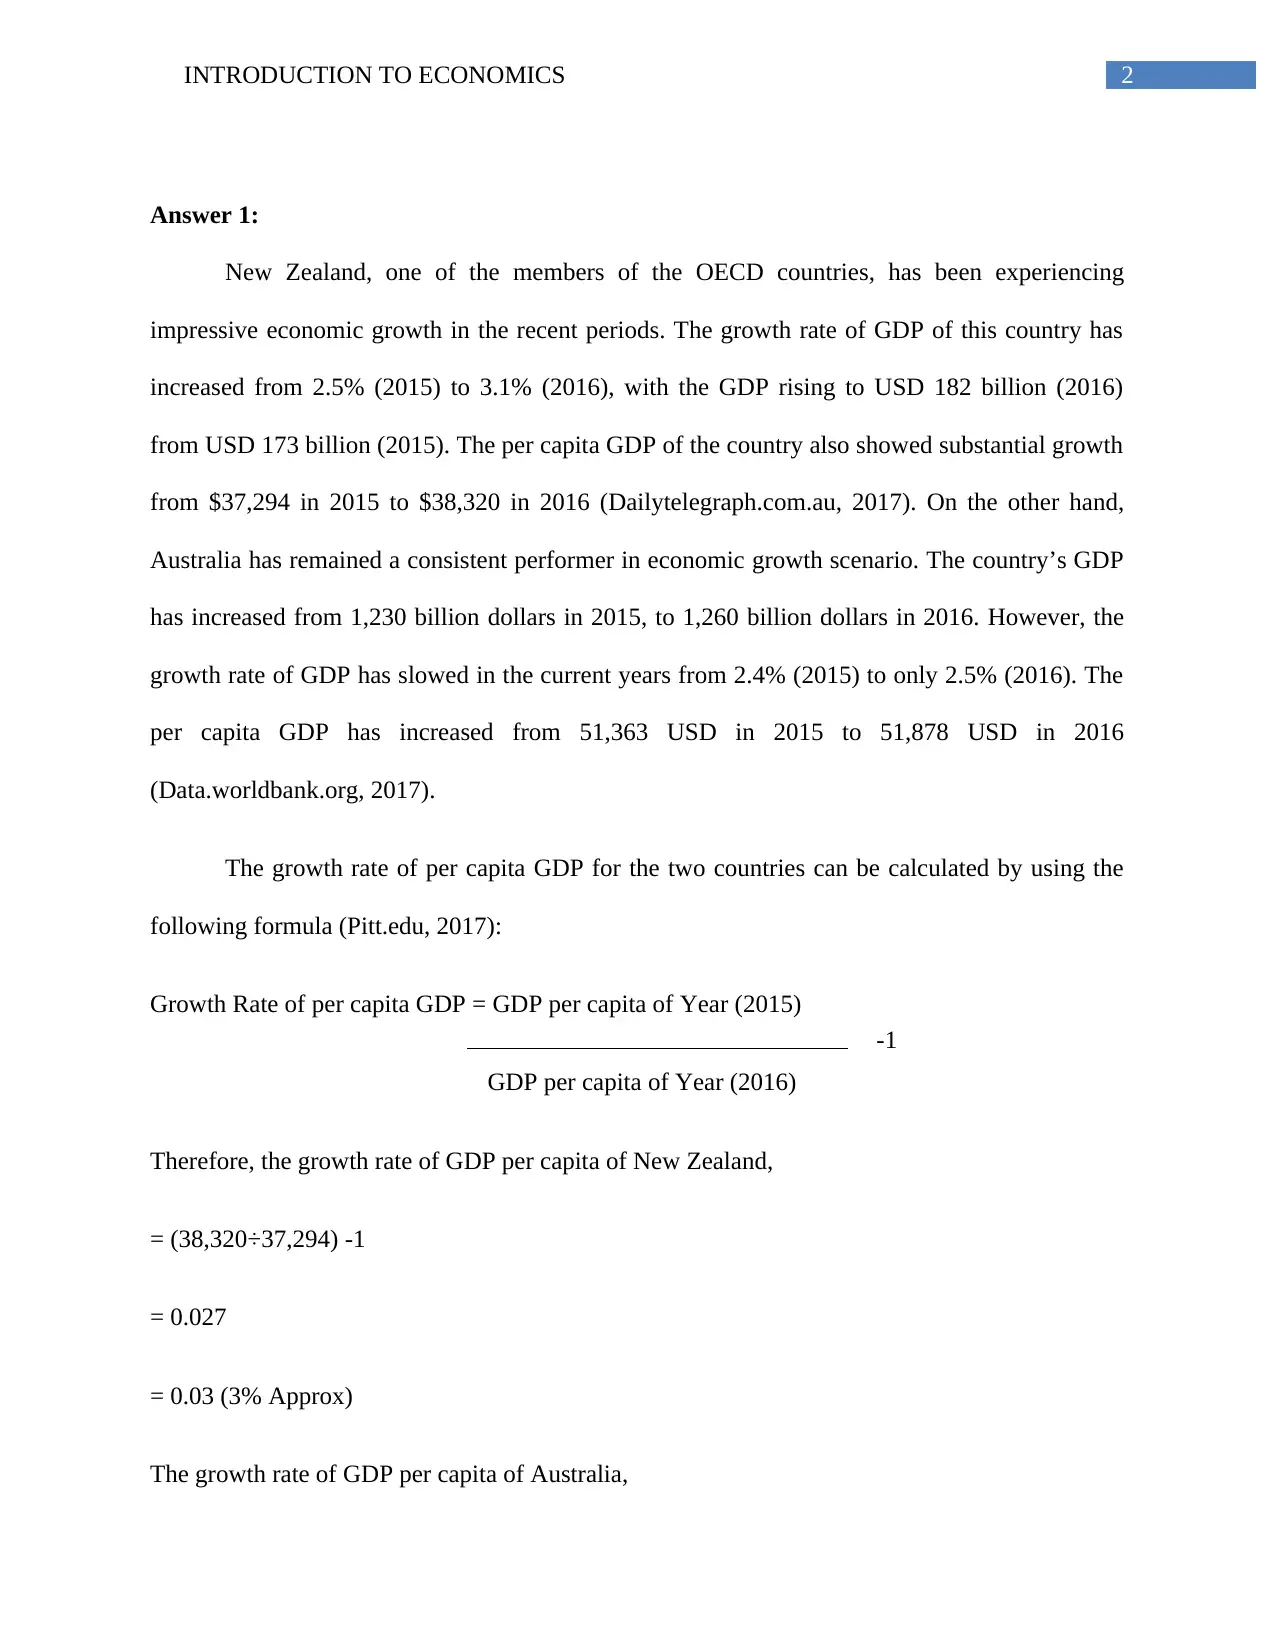
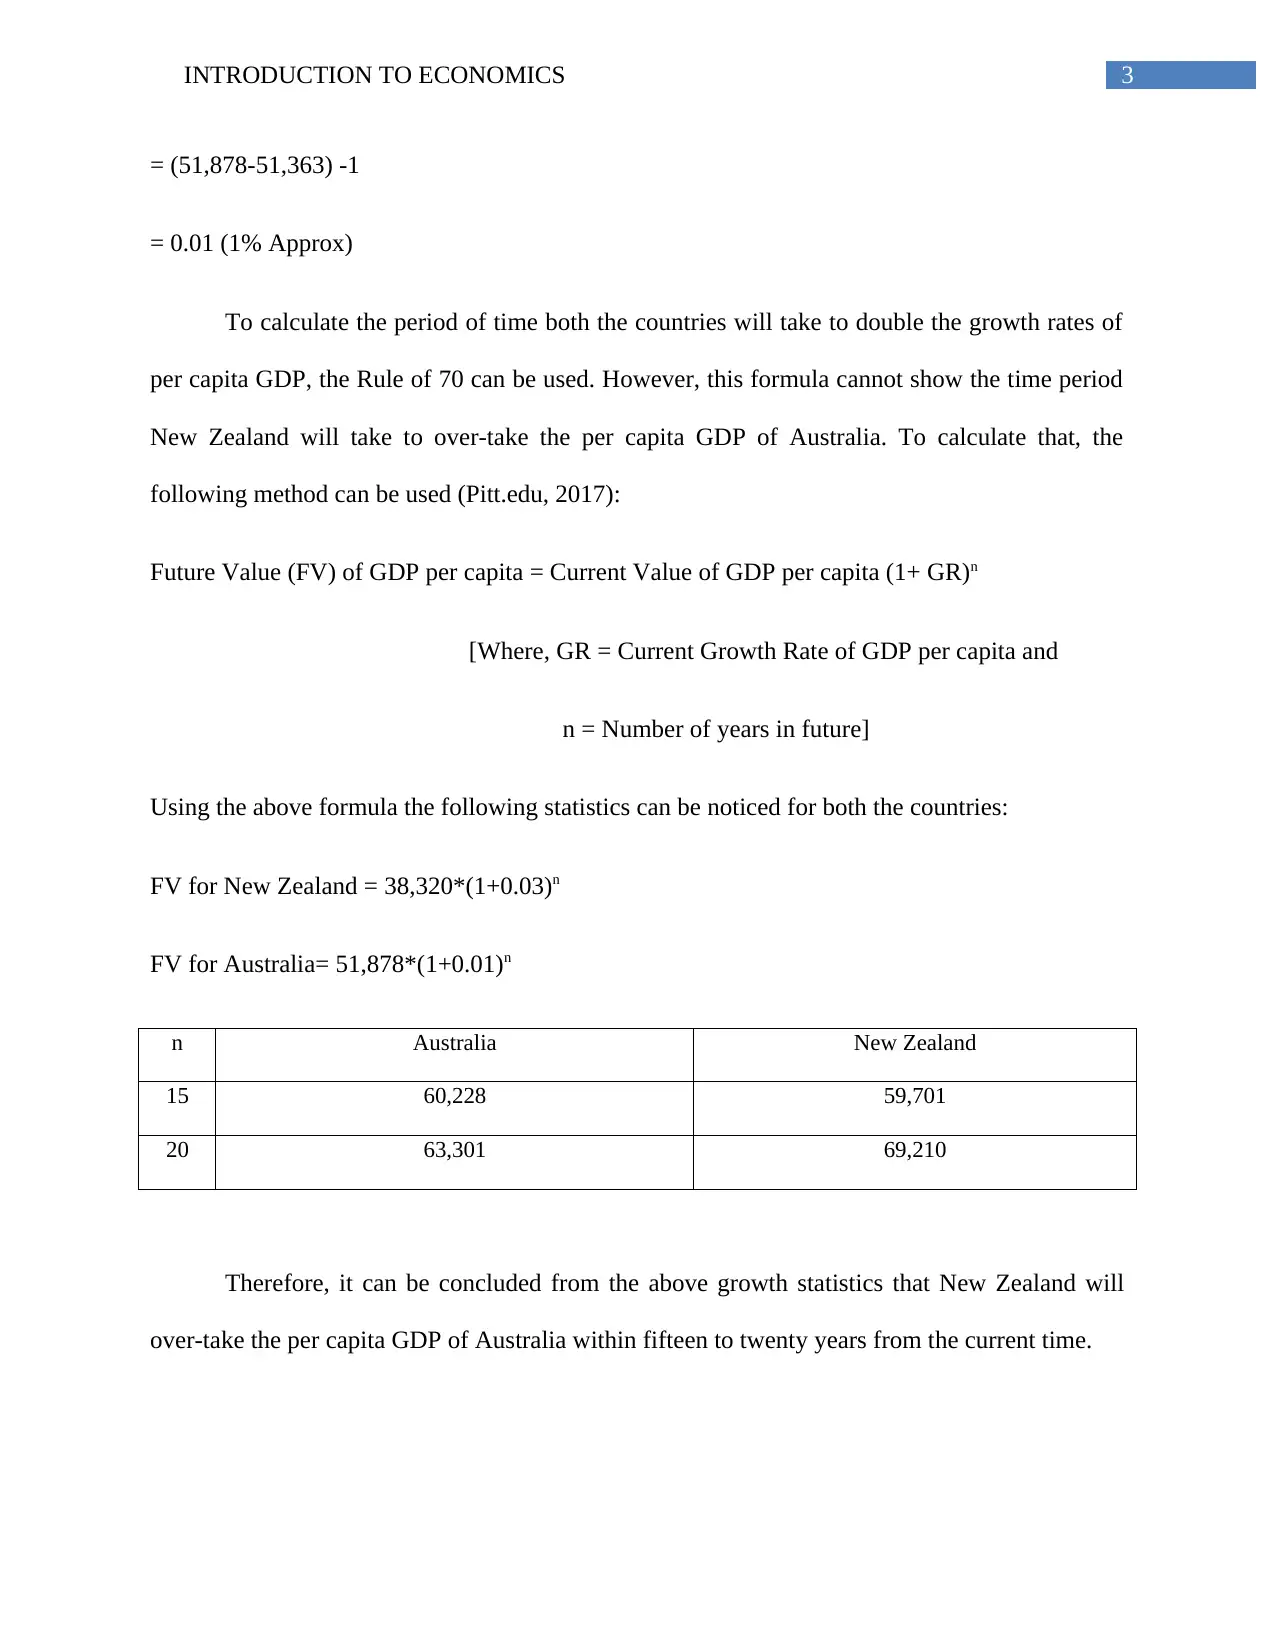
This economics assignment provides a comparative analysis of the economies of New Zealand and Australia. It begins by examining the GDP growth rates and per capita GDP of both countries, highlighting the impressive economic performance of New Zealand. The assignment then delves into the factors contributing to this growth, including an analysis of the components of GDP (consumption, investment, government expenditure, and net exports) in New Zealand. A significant portion of the assignment focuses on the Closer Economic Relations (CER) agreement between Australia and New Zealand, detailing its impact on trade, market integration, and economic growth for both nations. The analysis also explores the Australian mining boom, its effects on the country's economy, and its subsequent decline. The assignment uses national income accounting methods and the Rule of 70 to calculate growth rates and predict future economic trends, providing a comprehensive overview of the economic dynamics and key events shaping the two countries' financial landscapes, and is an example of the type of material available on Desklib.
Contribute Materials
Your contribution can guide someone’s learning journey. Share your
documents today.

Running head: INTRODUCTION TO ECONOMICS
Introduction to Economics
Name of the Student
Name of the University
Author Note
Introduction to Economics
Name of the Student
Name of the University
Author Note
Secure Best Marks with AI Grader
Need help grading? Try our AI Grader for instant feedback on your assignments.

1INTRODUCTION TO ECONOMICS
Table of Contents
Answer 1:.........................................................................................................................................2
Answer 2:.........................................................................................................................................4
Answer 3:.........................................................................................................................................6
Answer 4:.........................................................................................................................................7
References........................................................................................................................................9

2INTRODUCTION TO ECONOMICS
Answer 1:
New Zealand, one of the members of the OECD countries, has been experiencing
impressive economic growth in the recent periods. The growth rate of GDP of this country has
increased from 2.5% (2015) to 3.1% (2016), with the GDP rising to USD 182 billion (2016)
from USD 173 billion (2015). The per capita GDP of the country also showed substantial growth
from $37,294 in 2015 to $38,320 in 2016 (Dailytelegraph.com.au, 2017). On the other hand,
Australia has remained a consistent performer in economic growth scenario. The country’s GDP
has increased from 1,230 billion dollars in 2015, to 1,260 billion dollars in 2016. However, the
growth rate of GDP has slowed in the current years from 2.4% (2015) to only 2.5% (2016). The
per capita GDP has increased from 51,363 USD in 2015 to 51,878 USD in 2016
(Data.worldbank.org, 2017).
The growth rate of per capita GDP for the two countries can be calculated by using the
following formula (Pitt.edu, 2017):
Growth Rate of per capita GDP = GDP per capita of Year (2015)
GDP per capita of Year (2016)
Therefore, the growth rate of GDP per capita of New Zealand,
= (38,320÷37,294) -1
= 0.027
= 0.03 (3% Approx)
The growth rate of GDP per capita of Australia,
-1

3INTRODUCTION TO ECONOMICS
= (51,878-51,363) -1
= 0.01 (1% Approx)
To calculate the period of time both the countries will take to double the growth rates of
per capita GDP, the Rule of 70 can be used. However, this formula cannot show the time period
New Zealand will take to over-take the per capita GDP of Australia. To calculate that, the
following method can be used (Pitt.edu, 2017):
Future Value (FV) of GDP per capita = Current Value of GDP per capita (1+ GR)n
[Where, GR = Current Growth Rate of GDP per capita and
n = Number of years in future]
Using the above formula the following statistics can be noticed for both the countries:
FV for New Zealand = 38,320*(1+0.03)n
FV for Australia= 51,878*(1+0.01)n
n Australia New Zealand
15 60,228 59,701
20 63,301 69,210
Therefore, it can be concluded from the above growth statistics that New Zealand will
over-take the per capita GDP of Australia within fifteen to twenty years from the current time.
Secure Best Marks with AI Grader
Need help grading? Try our AI Grader for instant feedback on your assignments.

4INTRODUCTION TO ECONOMICS
Answer 2:
Over the recent years, New Zealand has shown an impressive growth in its economy,
with the growth rate of GDP being 3.1% in 2016, which is more than almost majority of the
OECD countries. This growth is a cumulative effect of the growths in different sectors of the
economy, which can be studied with the help of the National Income Accounting Method
(Johnson and Noguera 2012):
The components of GDP of a country at a particular point of time are as follows:
C – Private Consumption Expenditure in the economy
I – Private Investment Expenditure in the economy
G – Public or Government Expenditure (Both Public Consumption and Investment are included
this component)
NX – Net Exports (Exports – Imports)
Mathematically,
GDP = C + I + G + NX [National Income Accounting Equation (Cooper, Edey and Peacock
2013)]
The sector wise growth scenario of New Zealand is discussed below:
C- In the recent period, the nominal value of the private consumption expenditures has not
increased considerably in the country. However, the real value of consumption has increased
comparatively at a higher rate. This implies that the consumption pattern has not changed
substantially in the country (Fairburn 2013).

5INTRODUCTION TO ECONOMICS
I- During recession, the private investment expenditures in the country, fell considerably, to
15.1% of the Real GDP of the country. However, post recession the investment expenditures
gained pace and investment consists of 18.7% of the Real GDP of New Zealand in the recent
years (Downes, Hanslow and Tulip 2014).
G- Compared to the private consumption expenditures, the public consumption expenditures
expanded at a much higher rate in the country, indicating a major change in the pattern of public
consumption over the years. However, the public investment did not show any impressive
growth, in the current period; it consists of 21% of Real GDP of the country, which is lower than
21.6%, the average for the last two decades (Parkyn and Vehbi 2014) .
NX- The trade sector of New Zealand improved largely after the country experienced
Liberalization in the external sector, facilitating easy exports and imports. Post 1980s, the
country saw huge increase in the both the quantities of exports and imports. However, the
increase in the volume of imports was much higher than the increase in the volume of exports,
indicating that the country gained capability of importing more goods and services (especially
technological innovations) (Fabling and Sanderson 2015).
From the above discussion, it is evident barring the private consumption expenditures and
the public government expenditures, all other components of the GDP of New Zealand increased
impressively in the recent years, contributing significantly to its huge economic growth and
making it one of the fastest growing economies among the thirty-four OECD countries.

6INTRODUCTION TO ECONOMICS
Answer 3:
One of the most significant economic phenomena, witnessed by both Australia and New
Zealand, which contributed significantly in shaping up the economy of both the countries and
became one of the major reasons of their current prosperity, is the Closer Economic Relations
(CER), which came into force in 1983. The CER was mainly a free trade agreement between
both the countries, one of the most successful one of its kind (News.com.au, 2017). Under this
agreement, the main policies taken were elimination of all types of price and non-price quotas,
tariffs and any other trade restrictions that were present between the two countries, which were
creating impediments on path of their economic growth (Kelsey 2015). The main objective
behind this step was economic integration of two leading global economies and creation of a
Single Economic Market, which implied that all the goods and services that can be bought in one
of these two countries would also be available in the other country. Under this agreement, the
residents of both New Zealand and Australia were enabled to move, work and live in any of
these countries freely, which facilitated two way trades and employment significantly (Leslie and
Elijah 2012).
Due to this agreement, both the countries experienced significant growth their market
shares in the global scenario, leading to a growth in their economy. With the advent of CER,
many Australian entrepreneurs migrated to New Zealand and prospered hugely with time. The
same also happened for entrepreneurs of New Zealand. The symbiotic growth relationships
resulted in a more than eight to nine per cent growth of economy of both the countries (Kelsey
2015). New Zealand was specifically benefitted due to this agreement of free trade. Due to the
creation of the Single Economic Market, it became immensely easy for businessmen of New
Zealand to expand their business to Australia, thereby creating a huge exposure for their products
Paraphrase This Document
Need a fresh take? Get an instant paraphrase of this document with our AI Paraphraser

7INTRODUCTION TO ECONOMICS
and services, providing them a market almost the size of Queensland. Australia, on the other
hand, became one of the biggest sources of the country’s FDI (Fairburn 2013). The economy of
New Zealand prospered both ways, by gaining huge Australian markets and by drawing huge
investments from the country, contributing to the GDP of New Zealand. Therefore, CER is
evidently one of the primary contributors in the fast and impressive economic growth of New
Zealand in the recent periods (News.com.au, 2017).
Answer 4:
Australia experienced a mining boom of enormous magnitude at around 2003, which was
a result of a sudden upsurge in the demand of ores, especially iron ores, in the global market and
specifically in China and some other Asian countries. This huge demand hike, increased the price
of the goods, especially iron ores and the country experienced more than three times increase in
the price of the iron ores that they produced in large quantities, within a decade (Downes,
Hanslow and Tulip 2014).
Like CER, the mining boom another significant phenomenon, this contributed
substantially, in shaping up the economy of the country. The mining boom in Australia, not only
raised the GDP and the GDP growth rate of the country, but also significantly contributed in
raising the standard of living of the citizens as a whole. The main beneficiaries of this economic
boom were the giants in the mining industry. However, the benefits also hugely percolated to the
working class, who saw a massive increase in their nominal as well as real wages, employment
and over all lifestyle. The private investment in the mining sector, increased from 2% to 8%

8INTRODUCTION TO ECONOMICS
during this period as more and more companies ventured in the industry (Langton and
Longbottom 2012).
The effects of the boom in the mining industry in Australia withered away in the recent
period. The primary reason behind this was a massive fall, in the demand as well as price of the
iron ores, the country exported, in the international market. This, as a result, lead to a tremendous
downsizing of the overall budget of the country (Downes, Hanslow and Tulip 2014). Over the
years, due to the boom in the mining sector, this sector remained a major contributor in the
country’s GDP and the country over-emphasized on this sector, with increasing investment on
mining, sometimes at the cost of drawing resources from other sectors, which had potentials to
prosper. Therefore, with the downsizing of the mining sector, the economic growth of the
country experienced an overall slowdown (Langton and Longbottom 2012).

9INTRODUCTION TO ECONOMICS
References
Cooper, R., Edey, H.C. and Peacock, A.T., 2013. National income and social accounting.
Routledge.
Dailytelegraph.com.au (2017). The Kiwis are on our economic tails. [online]
Dailytelegraph.com.au. Available at:
http://www.dailytelegraph.com.au/business/jessica-irvine/new-zealand-is-kicking-australias-
economy/news- story/cdce93e5511f96f9b45a3406ddef4805 [Accessed 17 Aug. 2017].
Data.worldbank.org (2017). Countries | Data. [online] Data.worldbank.org. Available at:
http://data.worldbank.org/country/ [Accessed 16 Aug. 2017].
Downes, P.M., Hanslow, K. and Tulip, P., 2014. The effect of the mining boom on the
Australian economy.
Fabling, R. and Sanderson, L., 2015. Export Performance, Invoice Currency and Heterogeneous
Exchange Rate Pass‐through. The World Economy, 38(2), pp.315-339.
Fairburn, M., 2013. The ideal society and its enemies: Foundations of modern New Zealand
society, 1850-1900. Auckland University Press.
Johnson, R.C. and Noguera, G., 2012. Accounting for intermediates: Production sharing and
trade in value added. Journal of international Economics, 86(2), pp.224-236.
Kelsey, J., 2015. Reclaiming the future: New Zealand and the global economy. Bridget Williams
Books.
Secure Best Marks with AI Grader
Need help grading? Try our AI Grader for instant feedback on your assignments.

10INTRODUCTION TO ECONOMICS
Kelsey, J., 2015. The New Zealand experiment: A world model for structural adjustment?.
Bridget Williams Books.
Langton, M. and Longbottom, J. eds., 2012. Community futures, legal architecture: foundations
for Indigenous peoples in the global mining boom. Routledge.
Leslie, J. and Elijah, A., 2012. Does N= 2? Trans‐Tasman Economic Integration as a Comparator
for the Single European Market. JCMS: Journal of Common Market Studies, 50(6), pp.975-993.
News.com.au (2017). Three things that make New Zealand better than Australia. [online]
NewsComAu. Available at: http://www.news.com.au/finance/economy/three-things-that-make-
new-zealand-better/news-story/efb745fbae40c0dd14e444cdeb60b3fd [Accessed 16 Aug. 2017].
Parkyn, O. and Vehbi, T., 2014. The effects of fiscal policy in New Zealand: Evidence from a
VAR model with debt constraints. Economic Record, 90(290), pp.345-364.
Pitt.edu (2017). Bernanke - Chap. 8 -- Economic Growth. [online] Pitt.edu. Available at:
http://www.pitt.edu/~mgahagan/Bern8.htm [Accessed 16 Aug. 2017].
1 out of 11
Related Documents

Your All-in-One AI-Powered Toolkit for Academic Success.
+13062052269
info@desklib.com
Available 24*7 on WhatsApp / Email
Unlock your academic potential
© 2024 | Zucol Services PVT LTD | All rights reserved.