Epidemiology Assignment 1: Prevalence, Incidence, and Study Design
VerifiedAdded on 2022/10/04
|7
|2060
|438
Homework Assignment
AI Summary
This document presents the solutions to an Introduction to Epidemiology (401076) Assignment 1 from the University of Western Sydney, Spring 2019. The assignment covers key epidemiological concepts including the calculation and interpretation of prevalence and incidence rates from given datasets. The solution demonstrates calculations for crude and age-specific suicide rates, direct standardized incidence rates, and the application of these rates to compare suicide trends across different cities. Additionally, the document addresses study design considerations, including the selection of appropriate study designs (correlation and case-control) to investigate the relationship between coffee consumption and throat cancer, and an analysis of a cycling prevalence study. The solutions are detailed and comprehensive, providing clear explanations for each step of the calculations and interpretations of the results.
ID
The University of Western Sydney
School of Science and Health
Introduction to Epidemiology (401076)
ASSIGNMENT 1
Spring, 2019
Due date: 24/08/2019 11:55PM
This assignment is based on the learning objectives and concepts in in weeks 1 to 3
(not including measures of association). There is a total of 60 marks and this
assignment will contribute 20% towards the total assessment for this subject.
Your assignment should be typed, with adequate space left between questions.
Assignments should be submitted via vUWS (see specific instructions relating to
Assignment 1 on vUWS).
Be as brief as possible in your answers, and use the number of marks for a question as
a guide to how much to write.
No answers need to be longer than a few short sentences or short paragraphs. No need
for referencing
Late assignments will not be accepted without prior approval. Any request needs
supporting documents.
Remember to save your assignment to make sure it is the final version and
submit only this. as:
Family name First name_StudentID_Ass1_final
After due date I will not be able to remove the assignment. It is controlled by
Turnitin!! So, the only version that will be corrected is the last one you submitted
before due date
Paraphrase This Document
Need a fresh take? Get an instant paraphrase of this document with our AI Paraphraser
ID
Question 1(14)
(1a) “In June 2009, a study was conducted to determine the prevalence of flu in
health professionals who had patient contact and worked in three Melbourne
hospitals, Of the 165 participants, three were serologically confirmed flu cases. “
a) What was the prevalence of flu among health professionals in Melbourne? [2
Marks]
Prevelence= affected persons
population = 3
165∗100=1.81812
The prevalence of flu among the health workers for the month of June was
1.8182%.
“(1b) In December 2009, another study was conducted to determine the prevalence of
flue among health professionals with patient contact, working in three Melbourne
hospitals. Health professionals were asked whether they had experienced flu-like
symptoms during the previous winter (June-August). Of the 165 participants, 25
responded in ‘yes’ to this question.”
(b) What was the prevalence of flu according to this question? [2 marks]
Prevelence= affected persons
population = 25
165∗100=15.15 %
During the period June-August 2009, the prevalence of flu among the health
professionals was 15 for every 100 workers.
“(1c) The average duration of flu is estimated as two weeks (14 days). Can you
estimate the incidence rate of flu in the winter season for June 2009? A hint: when
computing, you need to use the decimal version of the prevalence” (4 marks)
The disease prevalence is 15.15% for the period June to August. By definition the
incidence is the number of new cases of the disease in relation to the number of
people who are at risk of being infected.
Incidence prevelence
average duration =15.15
14 =1.082, hence the disease incidence was 1.082%
per day
“(1d) In the same study of flu among health professionals in Melbourne started in
June 2009 (see a) the participants were followed up to the end of the winter season.
Within this time frame, there were 22 people serologically confirmed flu cases. What
was the incidence of flu in the 2009 winter season (June August)?” (4 marks)
Incidence is New cases
population at risk = 22
165−3∗100=13.58 %. the incidence of flu for the
period was 13.58 people for every 100 professionals.
ID
(1e) What is the difference between the incidence rates you have computed in 1c, and
1d [2 marks]
In 1c the incidence is calculated for the month of June only while in 1d the value is
obtained for the entire winter period that is June- August.
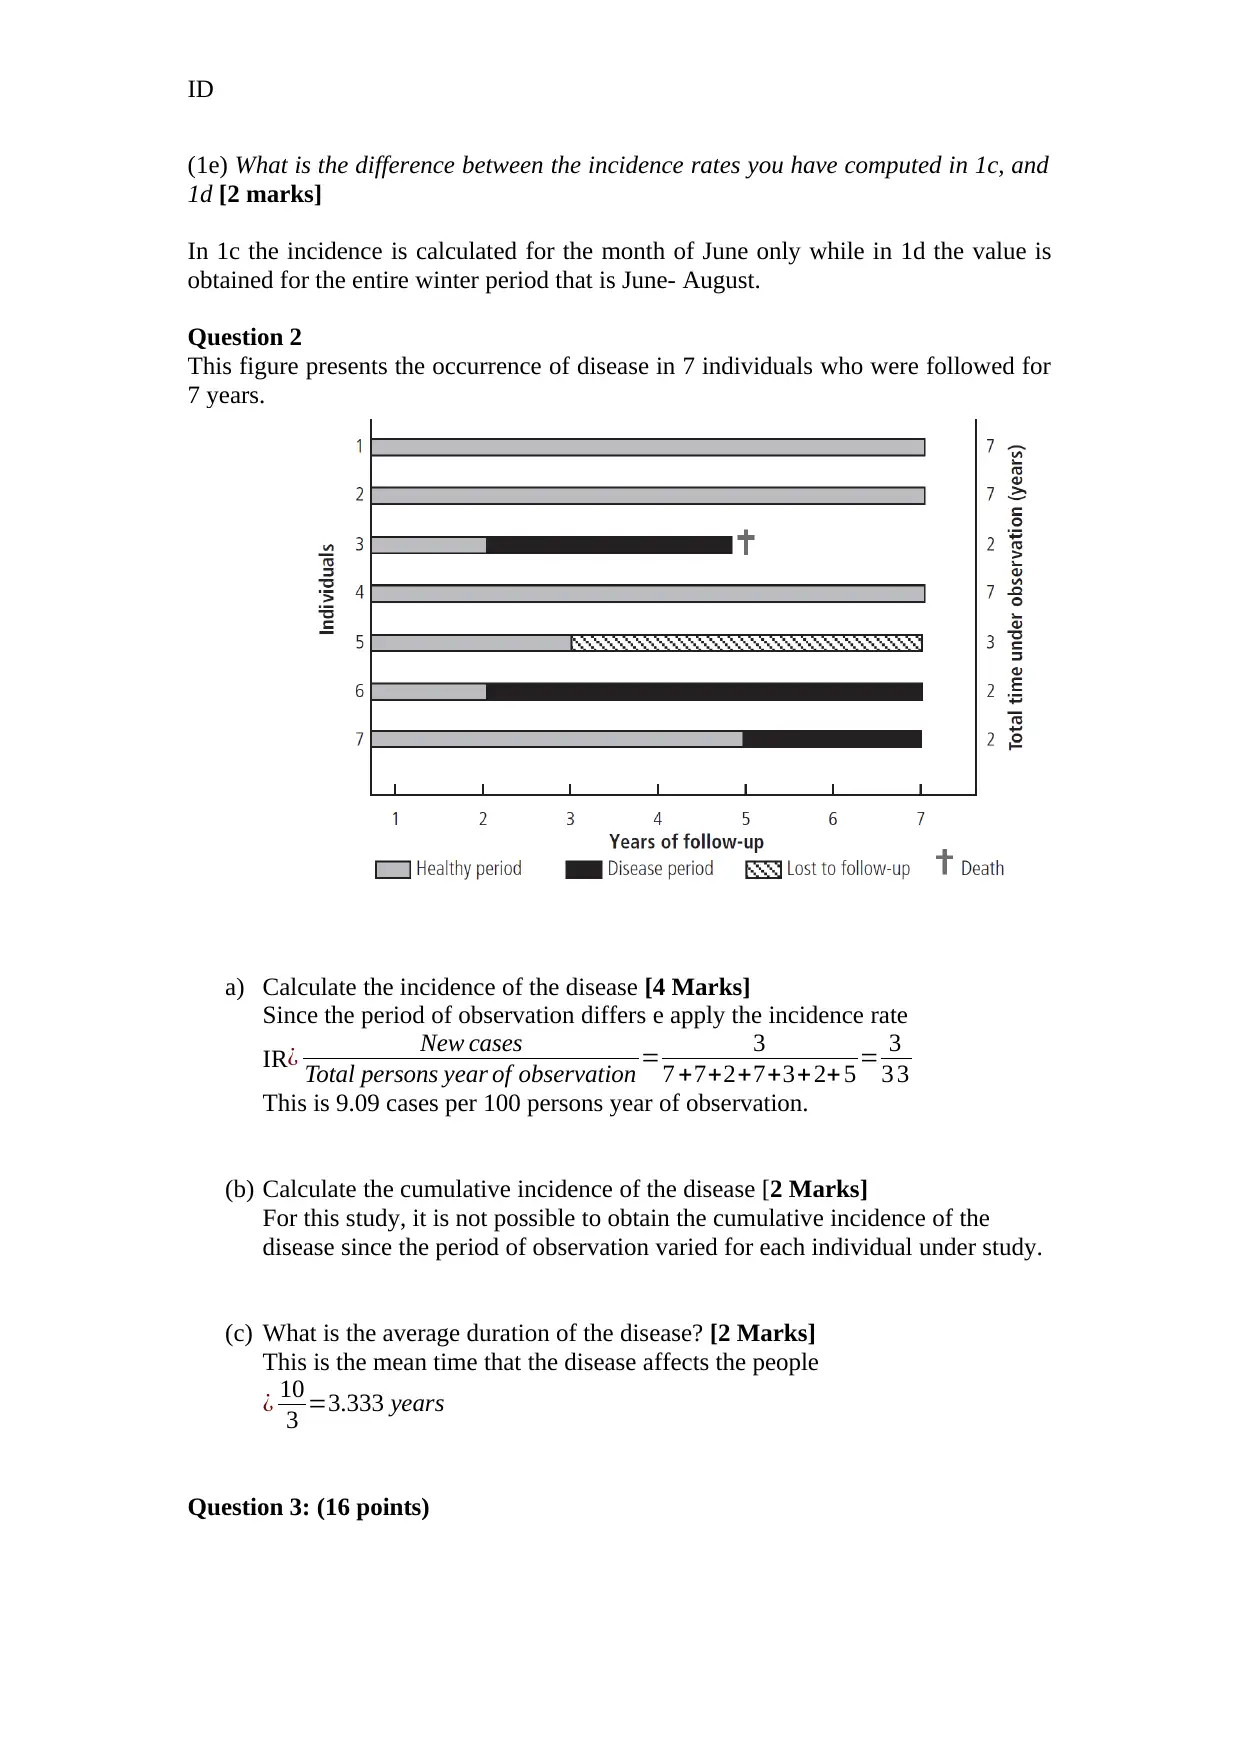
Question 2
This figure presents the occurrence of disease in 7 individuals who were followed for
7 years.
a) Calculate the incidence of the disease [4 Marks]
Since the period of observation differs e apply the incidence rate
IR¿ New cases
Total persons year of observation = 3
7 +7+2+7+3+2+ 5 = 3
3 3
This is 9.09 cases per 100 persons year of observation.
(b) Calculate the cumulative incidence of the disease [2 Marks]
For this study, it is not possible to obtain the cumulative incidence of the
disease since the period of observation varied for each individual under study.
(c) What is the average duration of the disease? [2 Marks]
This is the mean time that the disease affects the people
¿ 10
3 =3.333 years
Question 3: (16 points)
(1e) What is the difference between the incidence rates you have computed in 1c, and
1d [2 marks]
In 1c the incidence is calculated for the month of June only while in 1d the value is
obtained for the entire winter period that is June- August.
Question 2
This figure presents the occurrence of disease in 7 individuals who were followed for
7 years.
a) Calculate the incidence of the disease [4 Marks]
Since the period of observation differs e apply the incidence rate
IR¿ New cases
Total persons year of observation = 3
7 +7+2+7+3+2+ 5 = 3
3 3
This is 9.09 cases per 100 persons year of observation.
(b) Calculate the cumulative incidence of the disease [2 Marks]
For this study, it is not possible to obtain the cumulative incidence of the
disease since the period of observation varied for each individual under study.
(c) What is the average duration of the disease? [2 Marks]
This is the mean time that the disease affects the people
¿ 10
3 =3.333 years
Question 3: (16 points)
⊘ This is a preview!⊘
Do you want full access?
Subscribe today to unlock all pages.
Trusted by 1+ million students worldwide
ID
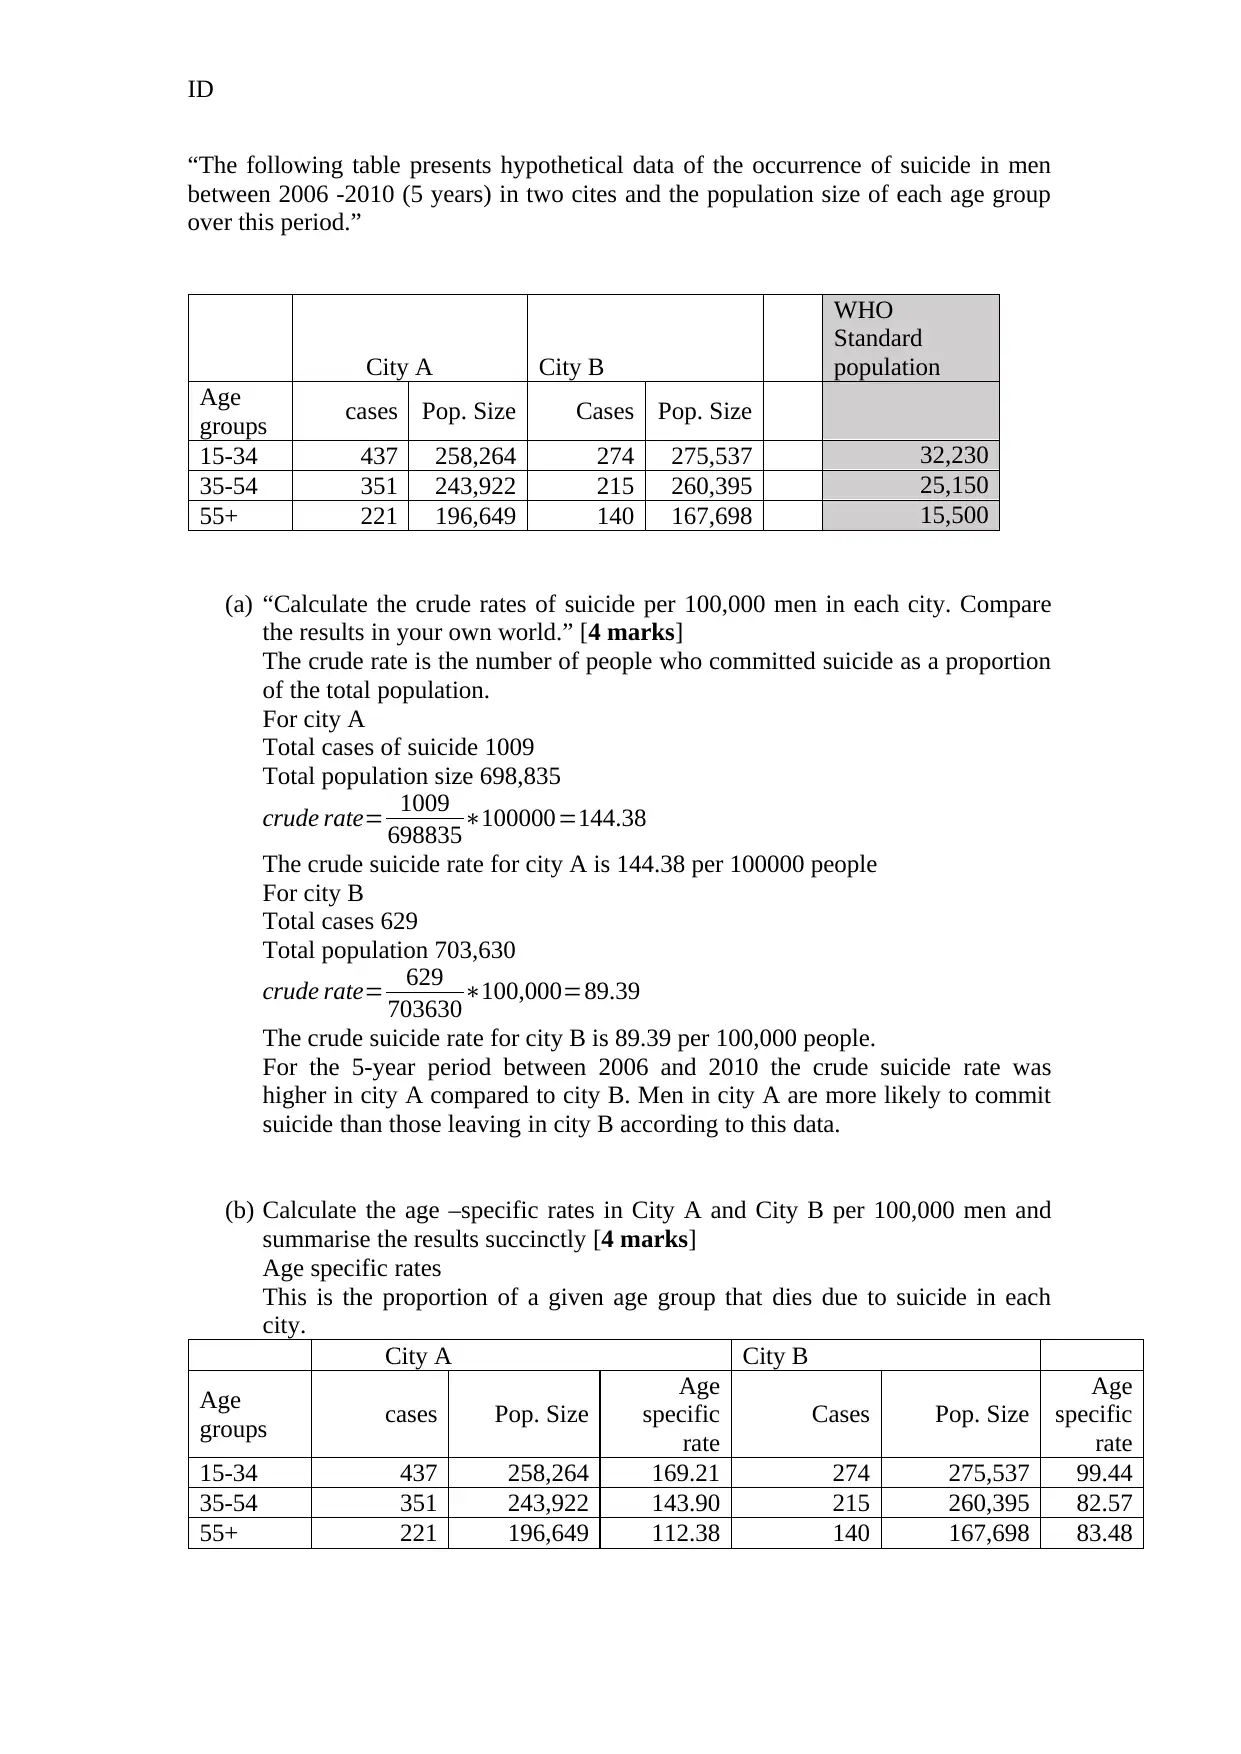
“The following table presents hypothetical data of the occurrence of suicide in men
between 2006 -2010 (5 years) in two cites and the population size of each age group
over this period.”
City A City B
WHO
Standard
population
Age
groups cases Pop. Size Cases Pop. Size
15-34 437 258,264 274 275,537 32,230
35-54 351 243,922 215 260,395 25,150
55+ 221 196,649 140 167,698 15,500
(a) “Calculate the crude rates of suicide per 100,000 men in each city. Compare
the results in your own world.” [4 marks]
The crude rate is the number of people who committed suicide as a proportion
of the total population.
For city A
Total cases of suicide 1009
Total population size 698,835
crude rate= 1009
698835∗100000=144.38
The crude suicide rate for city A is 144.38 per 100000 people
For city B
Total cases 629
Total population 703,630
crude rate= 629
703630∗100,000=89.39
The crude suicide rate for city B is 89.39 per 100,000 people.
For the 5-year period between 2006 and 2010 the crude suicide rate was
higher in city A compared to city B. Men in city A are more likely to commit
suicide than those leaving in city B according to this data.
(b) Calculate the age –specific rates in City A and City B per 100,000 men and
summarise the results succinctly [4 marks]
Age specific rates
This is the proportion of a given age group that dies due to suicide in each
city.
City A City B
Age
groups cases Pop. Size
Age
specific
rate
Cases Pop. Size
Age
specific
rate
15-34 437 258,264 169.21 274 275,537 99.44
35-54 351 243,922 143.90 215 260,395 82.57
55+ 221 196,649 112.38 140 167,698 83.48
Paraphrase This Document
Need a fresh take? Get an instant paraphrase of this document with our AI Paraphraser
ID
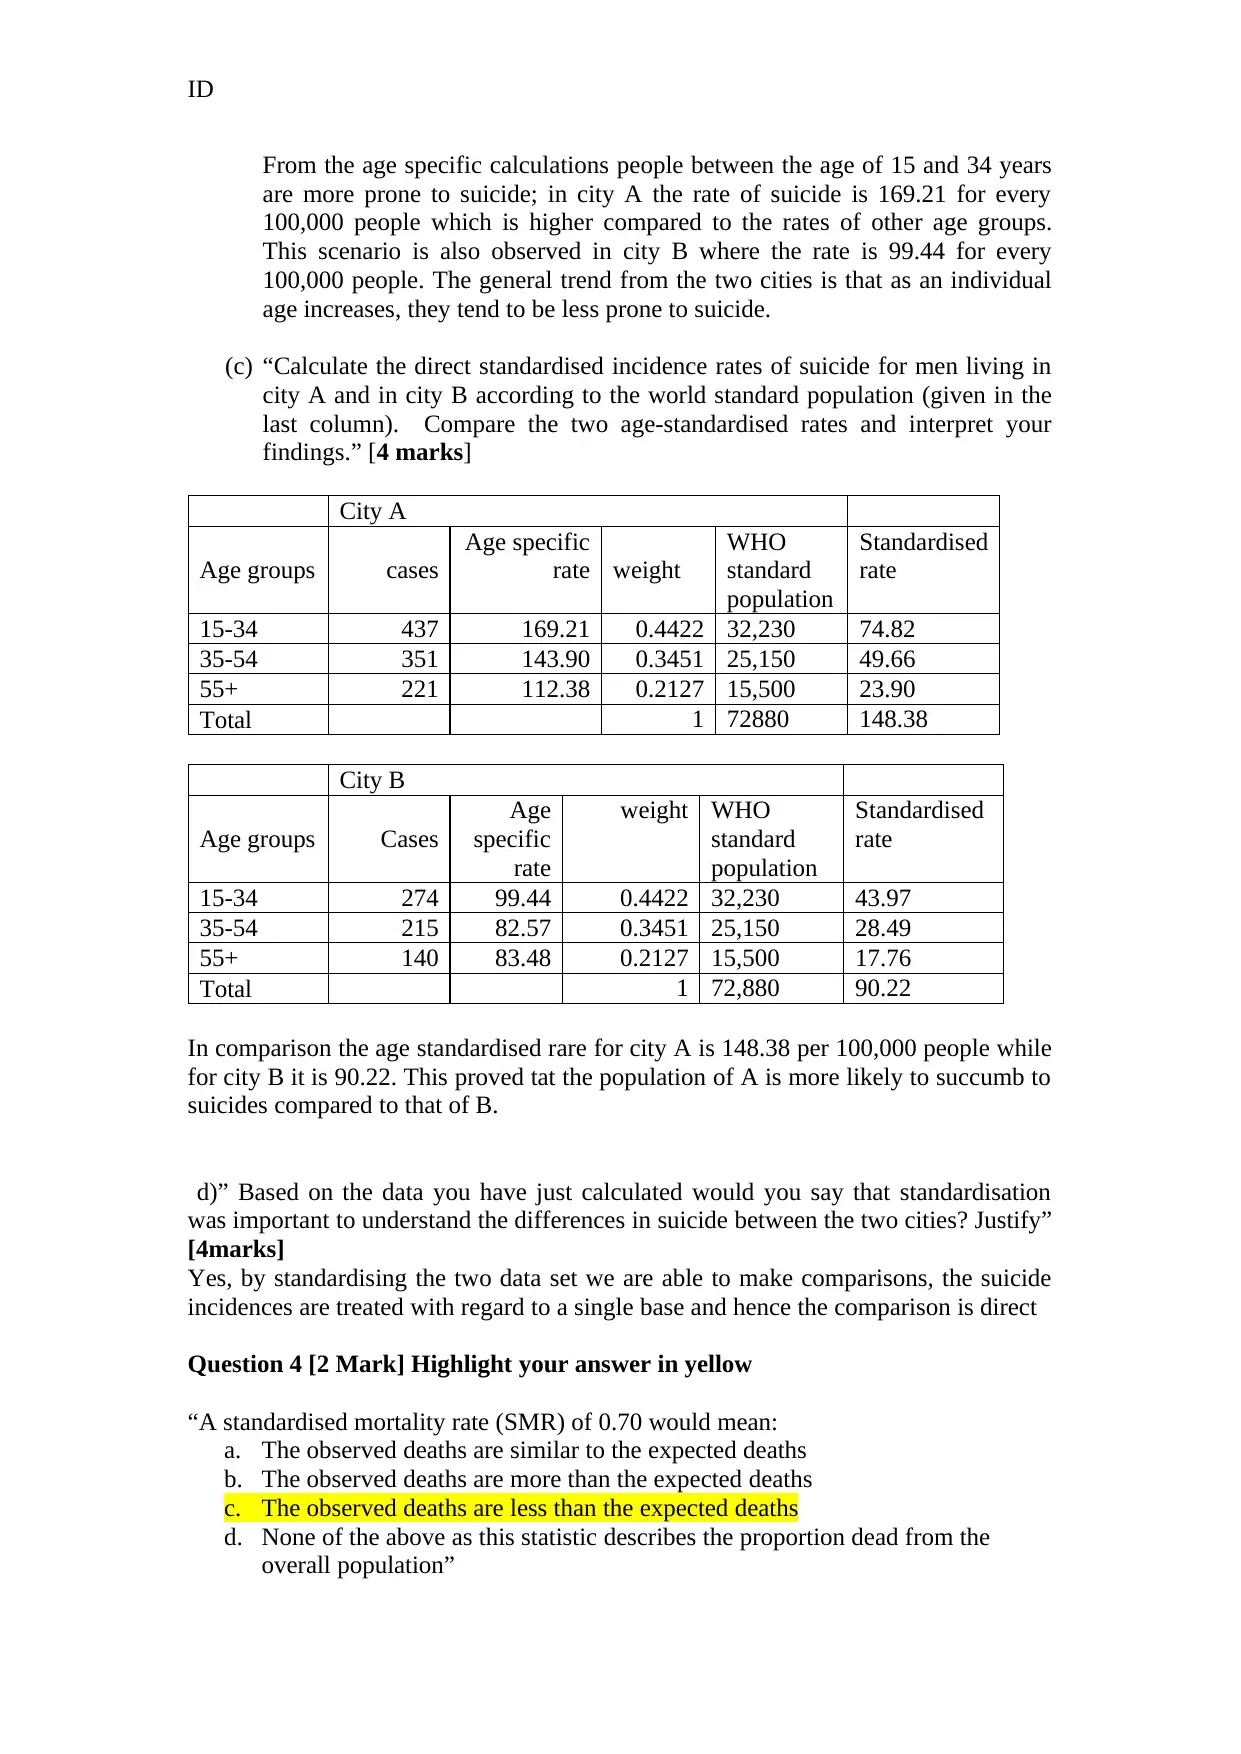
From the age specific calculations people between the age of 15 and 34 years
are more prone to suicide; in city A the rate of suicide is 169.21 for every
100,000 people which is higher compared to the rates of other age groups.
This scenario is also observed in city B where the rate is 99.44 for every
100,000 people. The general trend from the two cities is that as an individual
age increases, they tend to be less prone to suicide.
(c) “Calculate the direct standardised incidence rates of suicide for men living in
city A and in city B according to the world standard population (given in the
last column). Compare the two age-standardised rates and interpret your
findings.” [4 marks]
City A
Age groups cases
Age specific
rate weight
WHO
standard
population
Standardised
rate
15-34 437 169.21 0.4422 32,230 74.82
35-54 351 143.90 0.3451 25,150 49.66
55+ 221 112.38 0.2127 15,500 23.90
Total 1 72880 148.38
City B
Age groups Cases
Age
specific
rate
weight WHO
standard
population
Standardised
rate
15-34 274 99.44 0.4422 32,230 43.97
35-54 215 82.57 0.3451 25,150 28.49
55+ 140 83.48 0.2127 15,500 17.76
Total 1 72,880 90.22
In comparison the age standardised rare for city A is 148.38 per 100,000 people while
for city B it is 90.22. This proved tat the population of A is more likely to succumb to
suicides compared to that of B.
d)” Based on the data you have just calculated would you say that standardisation
was important to understand the differences in suicide between the two cities? Justify”
[4marks]
Yes, by standardising the two data set we are able to make comparisons, the suicide
incidences are treated with regard to a single base and hence the comparison is direct
Question 4 [2 Mark] Highlight your answer in yellow
“A standardised mortality rate (SMR) of 0.70 would mean:
a. The observed deaths are similar to the expected deaths
b. The observed deaths are more than the expected deaths
c. The observed deaths are less than the expected deaths
d. None of the above as this statistic describes the proportion dead from the
overall population”
ID
Question 5:
“Investigators wishes to examine the relationship between coffee consumption and
risk of throat cancer.”
a) What will be the most practical study design to explore this question and why?
[2 Marks]
Correlation study design, this is a type of quantitative study that provides
information on the nature of association between two variables. Being that the
study in this case is aimed at evaluating the association between throat cancer
and coffee consumption this design is the most practical.
b) Assuming you are one of the investigators – please provide a short description,
who will be the participants in the study and what information you will collect
to answer your research question [4 Marks] No more than 150 words
The participant is the study should be patients suffering from throat cancer
either in hospitals or those that are receiving homebased treatment. The
information that will be of interest to the study is the frequency of coffee
consumption. This can be measured in number of cups per day.
c) What other study design you can consider for this research question and
explain why you chose it [4 Marks
Case-Control study
Because it is also possible to consider coffee consumption as a causative
factor.
Hence observation will be on the exposure to coffee consumption.
The cases will be patients with a yes diagnosis of throat cancer
While the controls will be patients with a no diagnosis of throat cancer
Question 6:
“In 2010 the Road and Traffic Authority completed the construction of new cycleway
between Guilford and Cabramatta. A year before the completion of the cycleway the
Epidemiology department of the Area Health District (AHD) randomly sample 1500
people aged 18 to 65 years living in Guilford and Cabramatta and invited them to take
a survey, which included question on cycling and other recreational activity. In 2013
the AHD repeated the same survey on a random sample of another 1,500 people aged
18 to 65. They found that the prevalence of cycling in 2009 was 5% and in 2013 it
was 8%”.
⊘ This is a preview!⊘
Do you want full access?
Subscribe today to unlock all pages.
Trusted by 1+ million students worldwide
ID
a) “What do you think was the question or hypothesis that the Area Health
District try to answer” (no more than 30 words) [2 marks]
The question of the study was how often do an individual cycle in a month and
the reason for cycling whether for recreation or transport.
b) “What study type/design the paragraph described and why do you think this is
the type (in other words justify your answer from the text, no more than 60
words!!)” [4 marks]:
Case study design. This design applies a case study to obtain observations
which are later generalised to represent the scenario. In this study the
researcher might have used the cycleway as a case study to research on the
people s cycling trend.
c) “Think about a different study design that can answer the same research
question or hypothesis and describe succinctly what this study would involve”
[ no more than 100 words] [ 4 marks]
The alternative study design is the correlation design, in this design the study
will be focused on the relationship between establishment of the highway and
the cycling trend. A correlation study design is meant to study the association
between two variables that is the independent and the dependent variable. It
therefore can be recommended for this study
1 out of 7

Your All-in-One AI-Powered Toolkit for Academic Success.
+13062052269
info@desklib.com
Available 24*7 on WhatsApp / Email
![[object Object]](/_next/static/media/star-bottom.7253800d.svg)
Unlock your academic potential
Copyright © 2020–2026 A2Z Services. All Rights Reserved. Developed and managed by ZUCOL.