Introduction to Epidemiology (401076) Assignment 1 Analysis
VerifiedAdded on 2020/02/24
|7
|1944
|261
Homework Assignment
AI Summary
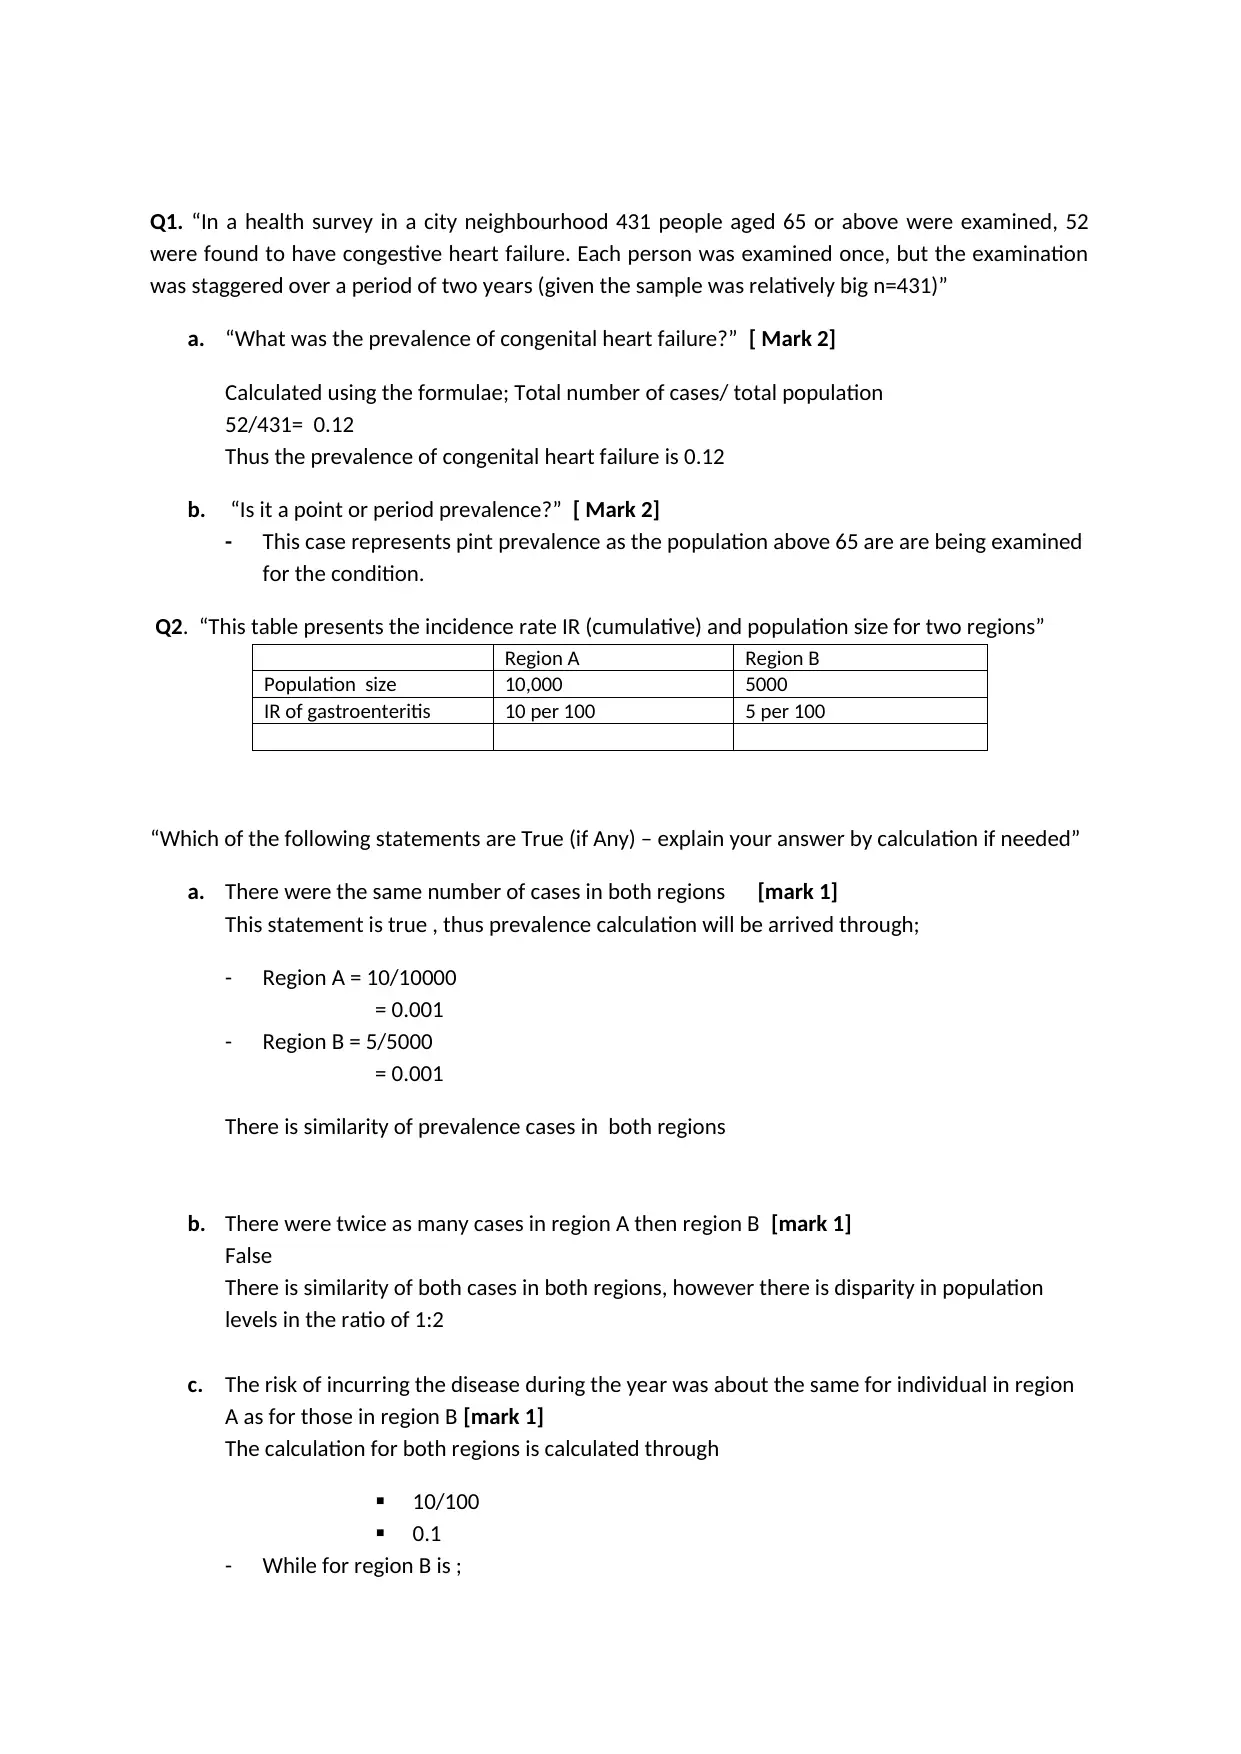
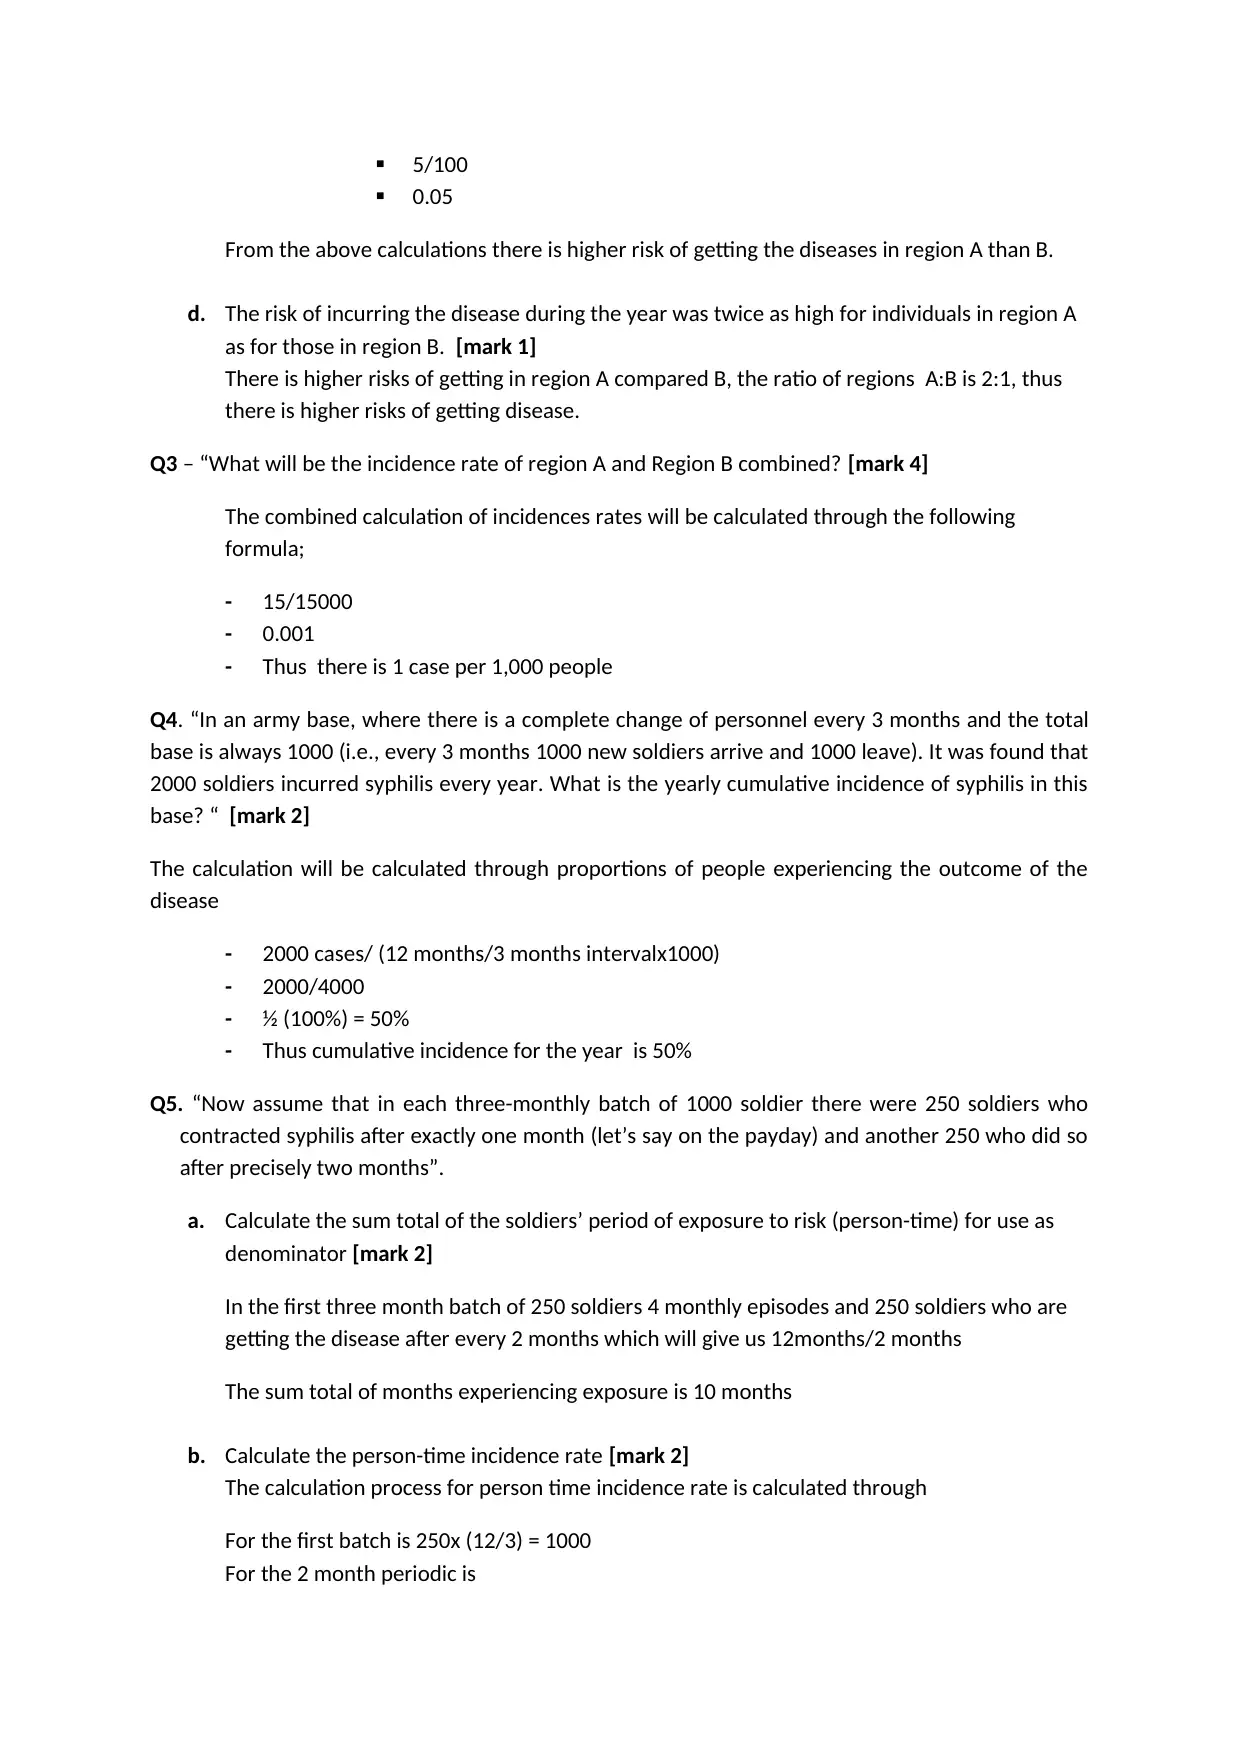
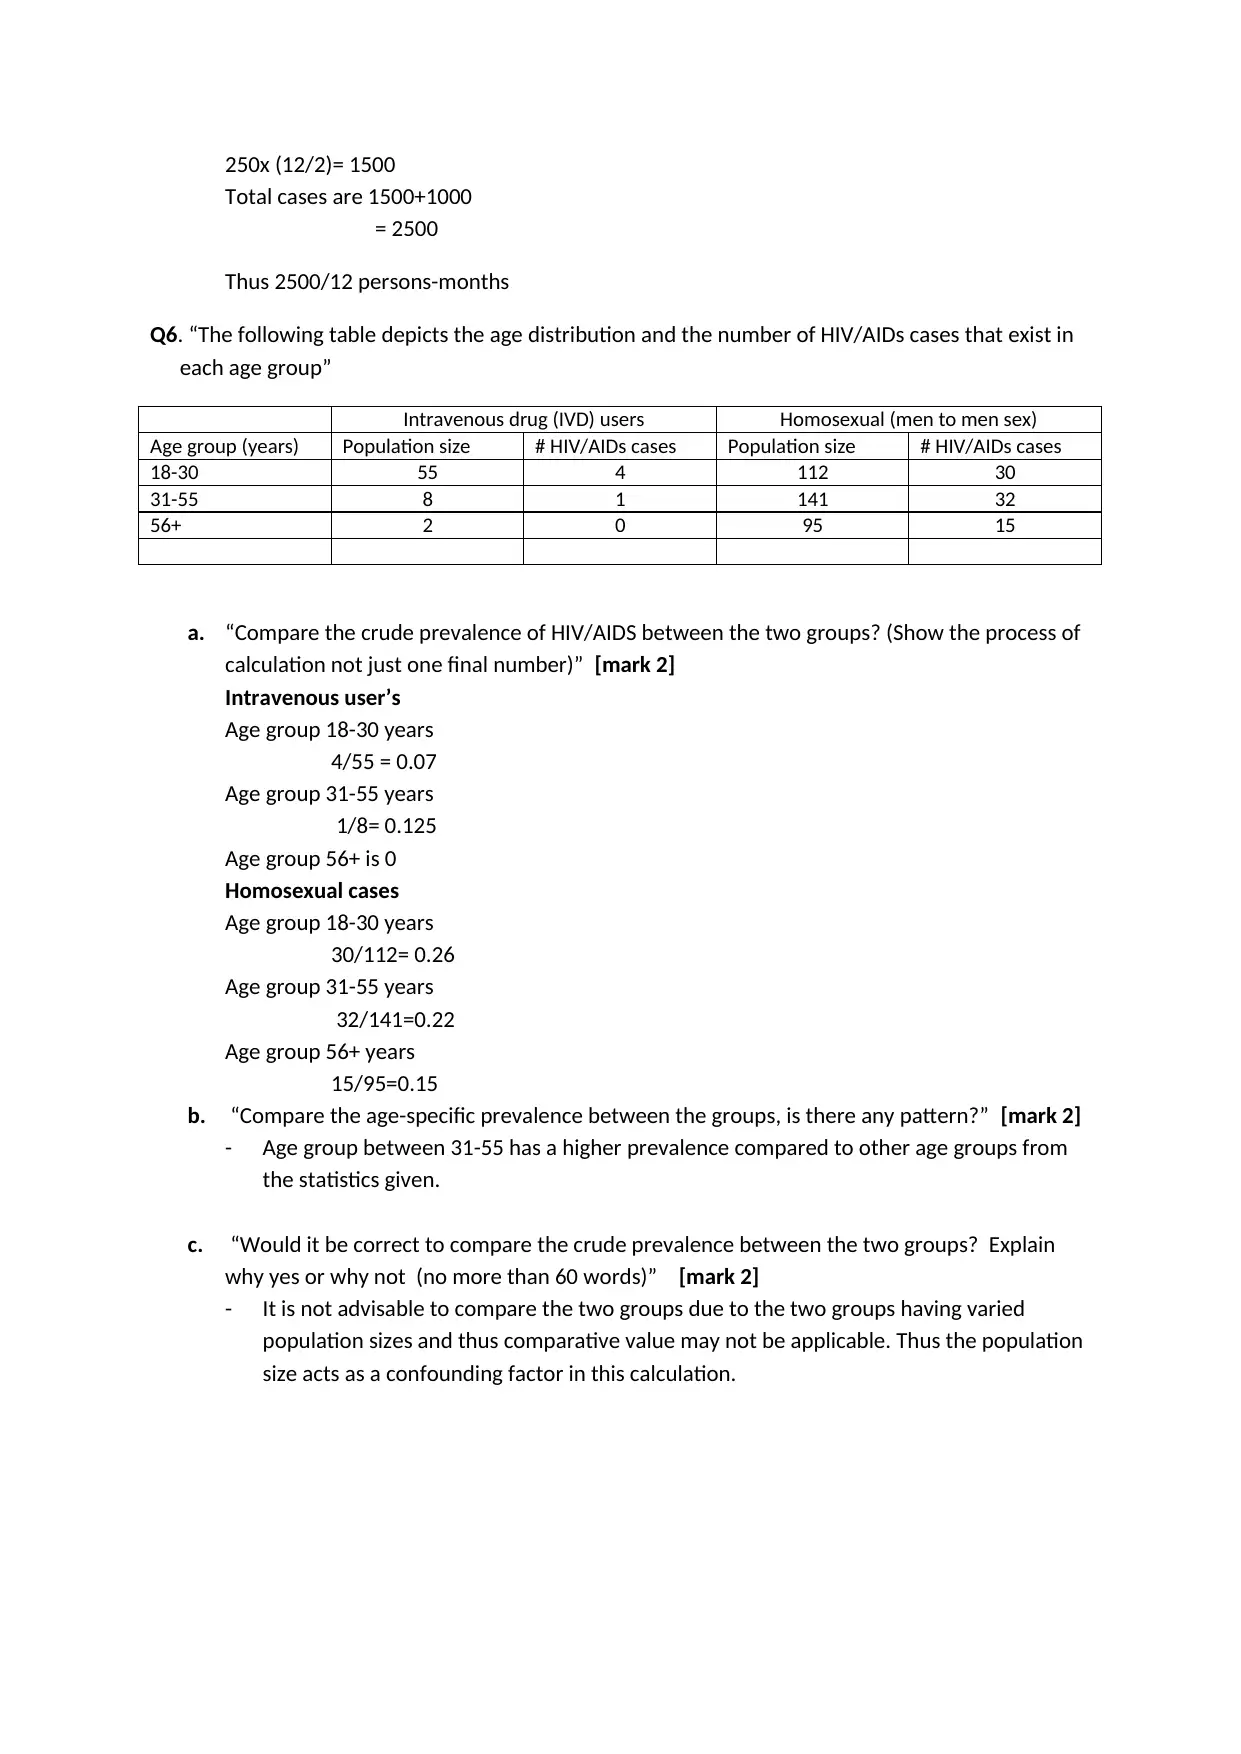
This document presents a complete solution to an Introduction to Epidemiology assignment from the University of Western Sydney. The assignment covers various epidemiological concepts, including calculating prevalence (both point and period), incidence rates (cumulative and person-time), and comparing prevalence between different groups. The solution includes detailed calculations for questions involving congenital heart failure, gastroenteritis, syphilis, and HIV/AIDS. Furthermore, the assignment explores different study designs, such as experimental and quasi-experimental designs, and requires analysis of research abstracts to identify research questions, exposures, outcomes, and study designs. The solution provides clear explanations and calculations for each question, demonstrating a strong understanding of epidemiological principles and their application in public health contexts.

The University of Western Sydney
School of Science and Health
Introduction to Epidemiology (401076)
ASSIGNMENT 1
Spring, 2017
Family name_First name_StudentID_Ass1
School of Science and Health
Introduction to Epidemiology (401076)
ASSIGNMENT 1
Spring, 2017
Family name_First name_StudentID_Ass1
Secure Best Marks with AI Grader
Need help grading? Try our AI Grader for instant feedback on your assignments.

Q1. “In a health survey in a city neighbourhood 431 people aged 65 or above were examined, 52
were found to have congestive heart failure. Each person was examined once, but the examination
was staggered over a period of two years (given the sample was relatively big n=431)”
a. “What was the prevalence of congenital heart failure?” [ Mark 2]
Calculated using the formulae; Total number of cases/ total population
52/431= 0.12
Thus the prevalence of congenital heart failure is 0.12
b. “Is it a point or period prevalence?” [ Mark 2]
- This case represents pint prevalence as the population above 65 are are being examined
for the condition.
Q2. “This table presents the incidence rate IR (cumulative) and population size for two regions”
“Which of the following statements are True (if Any) – explain your answer by calculation if needed”
a. There were the same number of cases in both regions [mark 1]
This statement is true , thus prevalence calculation will be arrived through;
- Region A = 10/10000
= 0.001
- Region B = 5/5000
= 0.001
There is similarity of prevalence cases in both regions
b. There were twice as many cases in region A then region B [mark 1]
False
There is similarity of both cases in both regions, however there is disparity in population
levels in the ratio of 1:2
c. The risk of incurring the disease during the year was about the same for individual in region
A as for those in region B [mark 1]
The calculation for both regions is calculated through
10/100
0.1
- While for region B is ;
Region A Region B
Population size 10,000 5000
IR of gastroenteritis 10 per 100 5 per 100

5/100
0.05
From the above calculations there is higher risk of getting the diseases in region A than B.
d. The risk of incurring the disease during the year was twice as high for individuals in region A
as for those in region B. [mark 1]
There is higher risks of getting in region A compared B, the ratio of regions A:B is 2:1, thus
there is higher risks of getting disease.
Q3 – “What will be the incidence rate of region A and Region B combined? [mark 4]
The combined calculation of incidences rates will be calculated through the following
formula;
- 15/15000
- 0.001
- Thus there is 1 case per 1,000 people
Q4. “In an army base, where there is a complete change of personnel every 3 months and the total
base is always 1000 (i.e., every 3 months 1000 new soldiers arrive and 1000 leave). It was found that
2000 soldiers incurred syphilis every year. What is the yearly cumulative incidence of syphilis in this
base? “ [mark 2]
The calculation will be calculated through proportions of people experiencing the outcome of the
disease
- 2000 cases/ (12 months/3 months intervalx1000)
- 2000/4000
- ½ (100%) = 50%
- Thus cumulative incidence for the year is 50%
Q5. “Now assume that in each three-monthly batch of 1000 soldier there were 250 soldiers who
contracted syphilis after exactly one month (let’s say on the payday) and another 250 who did so
after precisely two months”.
a. Calculate the sum total of the soldiers’ period of exposure to risk (person-time) for use as
denominator [mark 2]
In the first three month batch of 250 soldiers 4 monthly episodes and 250 soldiers who are
getting the disease after every 2 months which will give us 12months/2 months
The sum total of months experiencing exposure is 10 months
b. Calculate the person-time incidence rate [mark 2]
The calculation process for person time incidence rate is calculated through
For the first batch is 250x (12/3) = 1000
For the 2 month periodic is

250x (12/2)= 1500
Total cases are 1500+1000
= 2500
Thus 2500/12 persons-months
Q6. “The following table depicts the age distribution and the number of HIV/AIDs cases that exist in
each age group”
Intravenous drug (IVD) users Homosexual (men to men sex)
Age group (years) Population size # HIV/AIDs cases Population size # HIV/AIDs cases
18-30 55 4 112 30
31-55 8 1 141 32
56+ 2 0 95 15
a. “Compare the crude prevalence of HIV/AIDS between the two groups? (Show the process of
calculation not just one final number)” [mark 2]
Intravenous user’s
Age group 18-30 years
4/55 = 0.07
Age group 31-55 years
1/8= 0.125
Age group 56+ is 0
Homosexual cases
Age group 18-30 years
30/112= 0.26
Age group 31-55 years
32/141=0.22
Age group 56+ years
15/95=0.15
b. “Compare the age-specific prevalence between the groups, is there any pattern?” [mark 2]
- Age group between 31-55 has a higher prevalence compared to other age groups from
the statistics given.
c. “Would it be correct to compare the crude prevalence between the two groups? Explain
why yes or why not (no more than 60 words)” [mark 2]
- It is not advisable to compare the two groups due to the two groups having varied
population sizes and thus comparative value may not be applicable. Thus the population
size acts as a confounding factor in this calculation.
Secure Best Marks with AI Grader
Need help grading? Try our AI Grader for instant feedback on your assignments.

d. “Compute the direct standardised prevalence of HIV/AIDs for intravenous drug users using
the age distribution of homosexuals. Express your results in percent”. [4 marks]
Intravenous drug (IVD)
users
Homosexual (men to men
sex)
Age group
(years)
Population
size
# HIV/AIDs
cases
Rate of prev Population
size
#
HIV/AIDs
cases
18-30 55 4 (4/55)100
=7%
112 30 (30/112)100 =26%
31-55 8 1 (1/8)100
=12.5%
141 32 (32/141)100 =22.6%
56+ 2 0 (0/2)100= 0 95 15 (15/95)100=15 %
Total
prevalence
19.5%/3
= 6.3%
63%/3
= 21%
Hence standardized prevalence of HIV/AIDS for intravenous drug users using the age standard
distribution of homosexuals for
Ages 18-30 is 7%/26% = 0.26%
Age 31-55 is 12.5%/22.6%=0.54%
Age 56+ is 0%/15% = 0
e. Summarise the differences between the crude prevalence and the age-standardised rate.
(no more than 100 words) 2 marks
- Crude rates prevalence is calculated through dividing the total number of cases in a
specific period of time by the total number of persons in the population
- The standardized rates are those that account for difference in the age structure of the
populations being compared. Used for determining age difference in the population
structure.
Q7. “A random sample of middle-age sedentary overweight males was selected from four census
tracts in four countries, and each man was examined for coronary artery disease. All those having
the disease were excluded from the study. All other were randomly assigned to Mediterranean diet
group, which followed a 2-year program of this diet, or to a control group, which received
educational materials about healthy lifestyle. Both groups were observed half-yearly for any
difference in incidence of coronary artery disease”.
a) Study type/design [2 marks]:
- Study design used in this study is experimental design
b) Key feature(s) what led your decision of the study design from this text: [2 marks]

Key feature present are
- Presence of control groups with different treatments given
- The groups are randomized through random sampling
Q8. “The hypothesis that meat consumption can increase the risk of colon cancer was investigated
in 22 countries. Investigators checked the sales per-capita of meat (e.g., beef, lamb, pork and
chicken) and then looked at the number of colon cancer death per 100,000 in each country. They
found high correlation (r=0.82) between mortality from colon cancer and consumption of meat; the
higher the consumption of meat per capita in the country the higher the death rate from colon
cancer”
a) Study type/design [2 marks]:
- The design used is quasi experimental design
b) Key feature(s) what led your decision of the study design from this text: [2 marks]
- Key feature for this design is the presence of intervention factor, there is observation of
trend of meat intake which is correlated with occurrence of cancer cases
Q9. Read the following abstract and answer the following questions
Background: Although gait speed slows with age, the rate of slowing varies greatly. To date, little is
known about the trajectories of gait speed, their correlates, and their risk for mortality in older
adults.
Methods: Gait speed during a 20-m walk was measured for a period of 8 years in initially well-
functioning men and women aged 70–79 years participating in the Health, Aging and Body
Composition study. We described the trajectories of gait speed and examined their correlates using
a group-based mixture model. Also risk associated with different gait speed trajectories on all-cause
mortality was estimated using a Cox-proportional hazard model.
Results: Of 2,364 participants (mean age, 73.5±2.9 years; 52% women), we identified three gait
speed trajectories: slow (n = 637), moderate (n = 1,209), and fast decline (n = 518). Those with fast
decline slowed 0.030 m/s per year or 2.4% per year from baseline to the last follow-up visit. Women,
blacks, and participants who were obese, had limited knee extensor strength, and had low physical
activity were more likely to have fast decline than their counterparts. Participants with fast decline in
gait speed had a 90% greater risk of mortality than those with slow decline.
Conclusion: Despite being well-functioning at baseline, a quarter of older adults experienced fast
decline in gait speed, which was associated with an increased risk of mortality.
a) What is the research question/s [2 marks]
- What is the estimated rate of speed for gaited elderly adults?

b) What is the exposure [2 marks]
- Exposure is the speed for walking for 20 minutes for the period of 8 years
c) What is the outcome [2 marks]
- The observed outcome is the speed trajectories which are categorised into three
categories. Observable characteristics of fast decline of gaited speed have greater risks
of mortality among the elderly.
d) What is the study design - what led your decision of the study design from this text [2
marks]
- Quasi experimental design was utilised in this research, in order to maintain control of
confounding factors. A valid conclusion reached regarding relationship of gait speed and
elderly mortality among the elderly in this study.
1 out of 7
Related Documents

Your All-in-One AI-Powered Toolkit for Academic Success.
+13062052269
info@desklib.com
Available 24*7 on WhatsApp / Email
Unlock your academic potential
© 2024 | Zucol Services PVT LTD | All rights reserved.