Introduction to Epidemiology (401076) Assignment 2, Spring 2019
VerifiedAdded on 2022/11/10
|9
|2065
|278
Homework Assignment
AI Summary
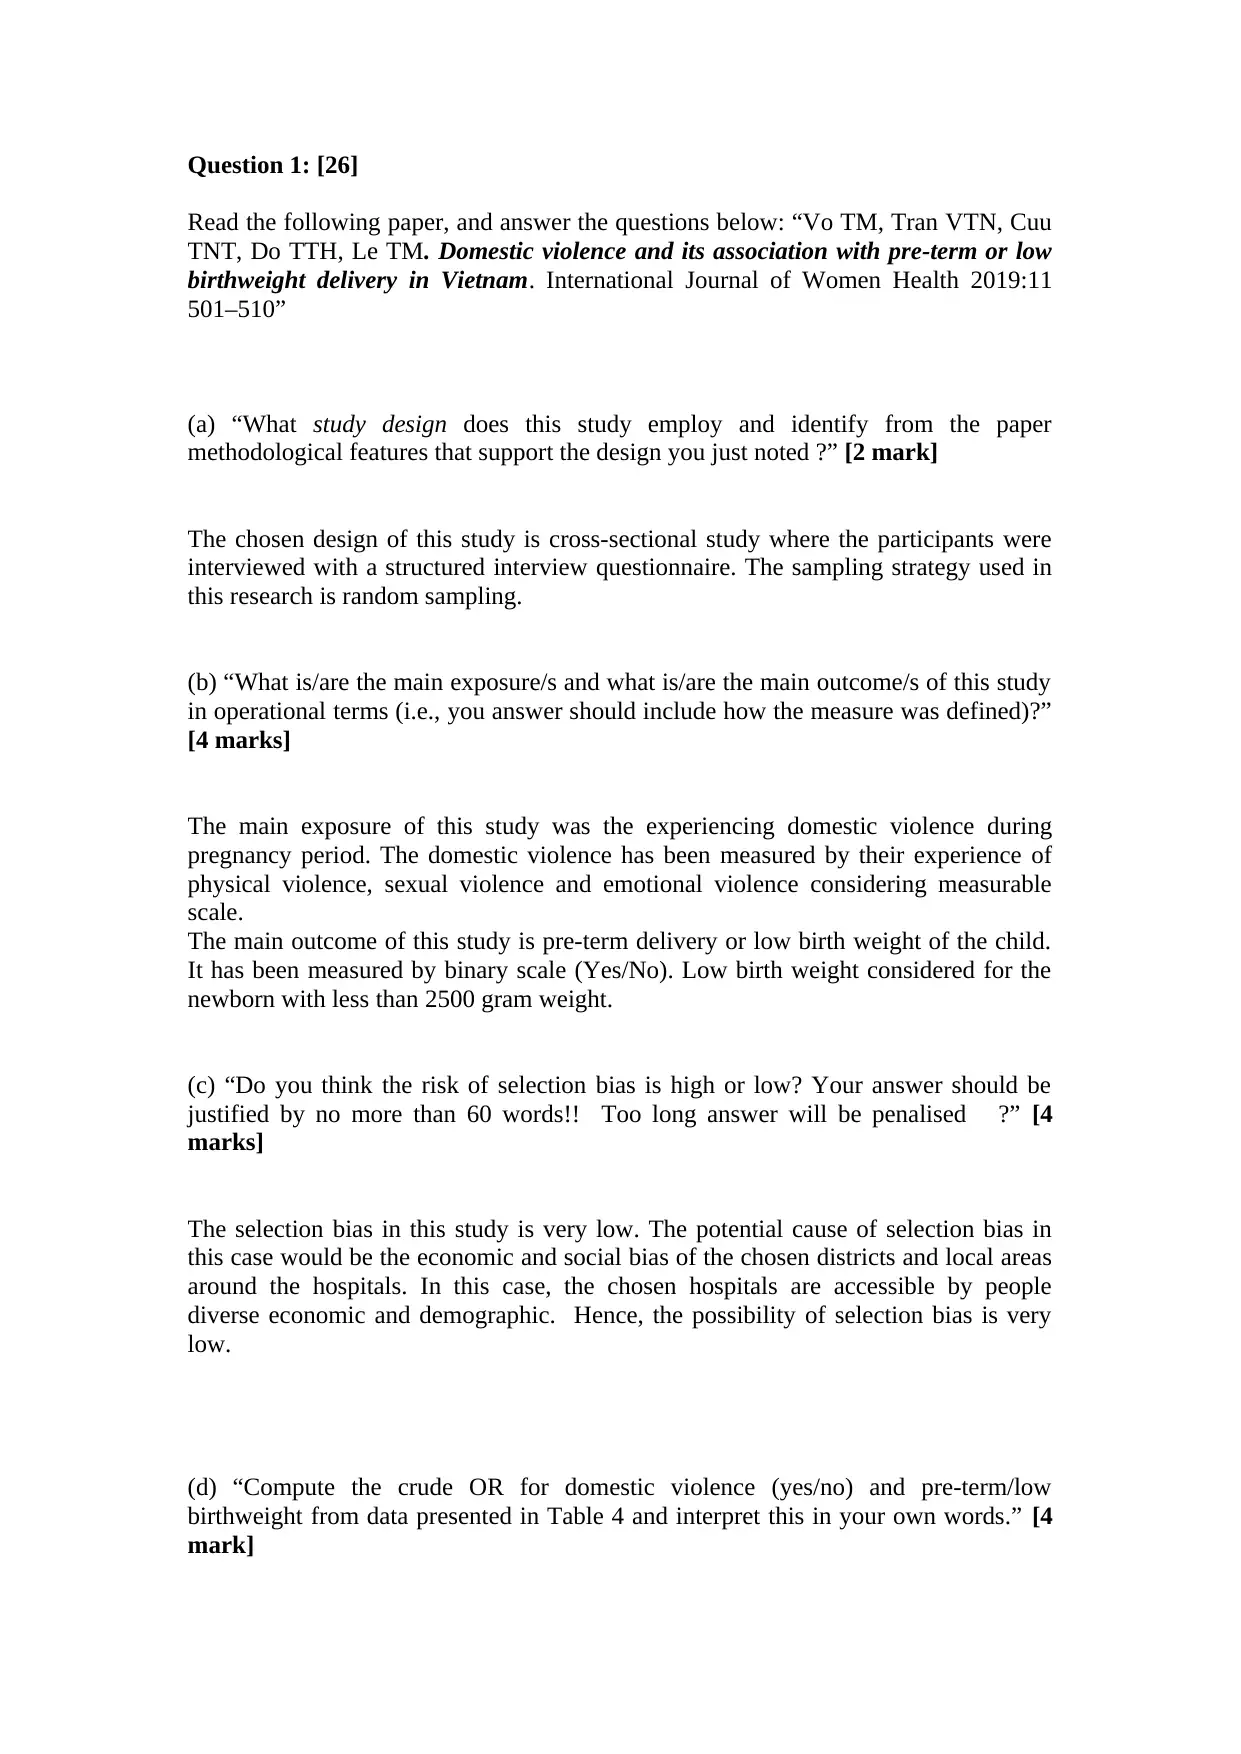
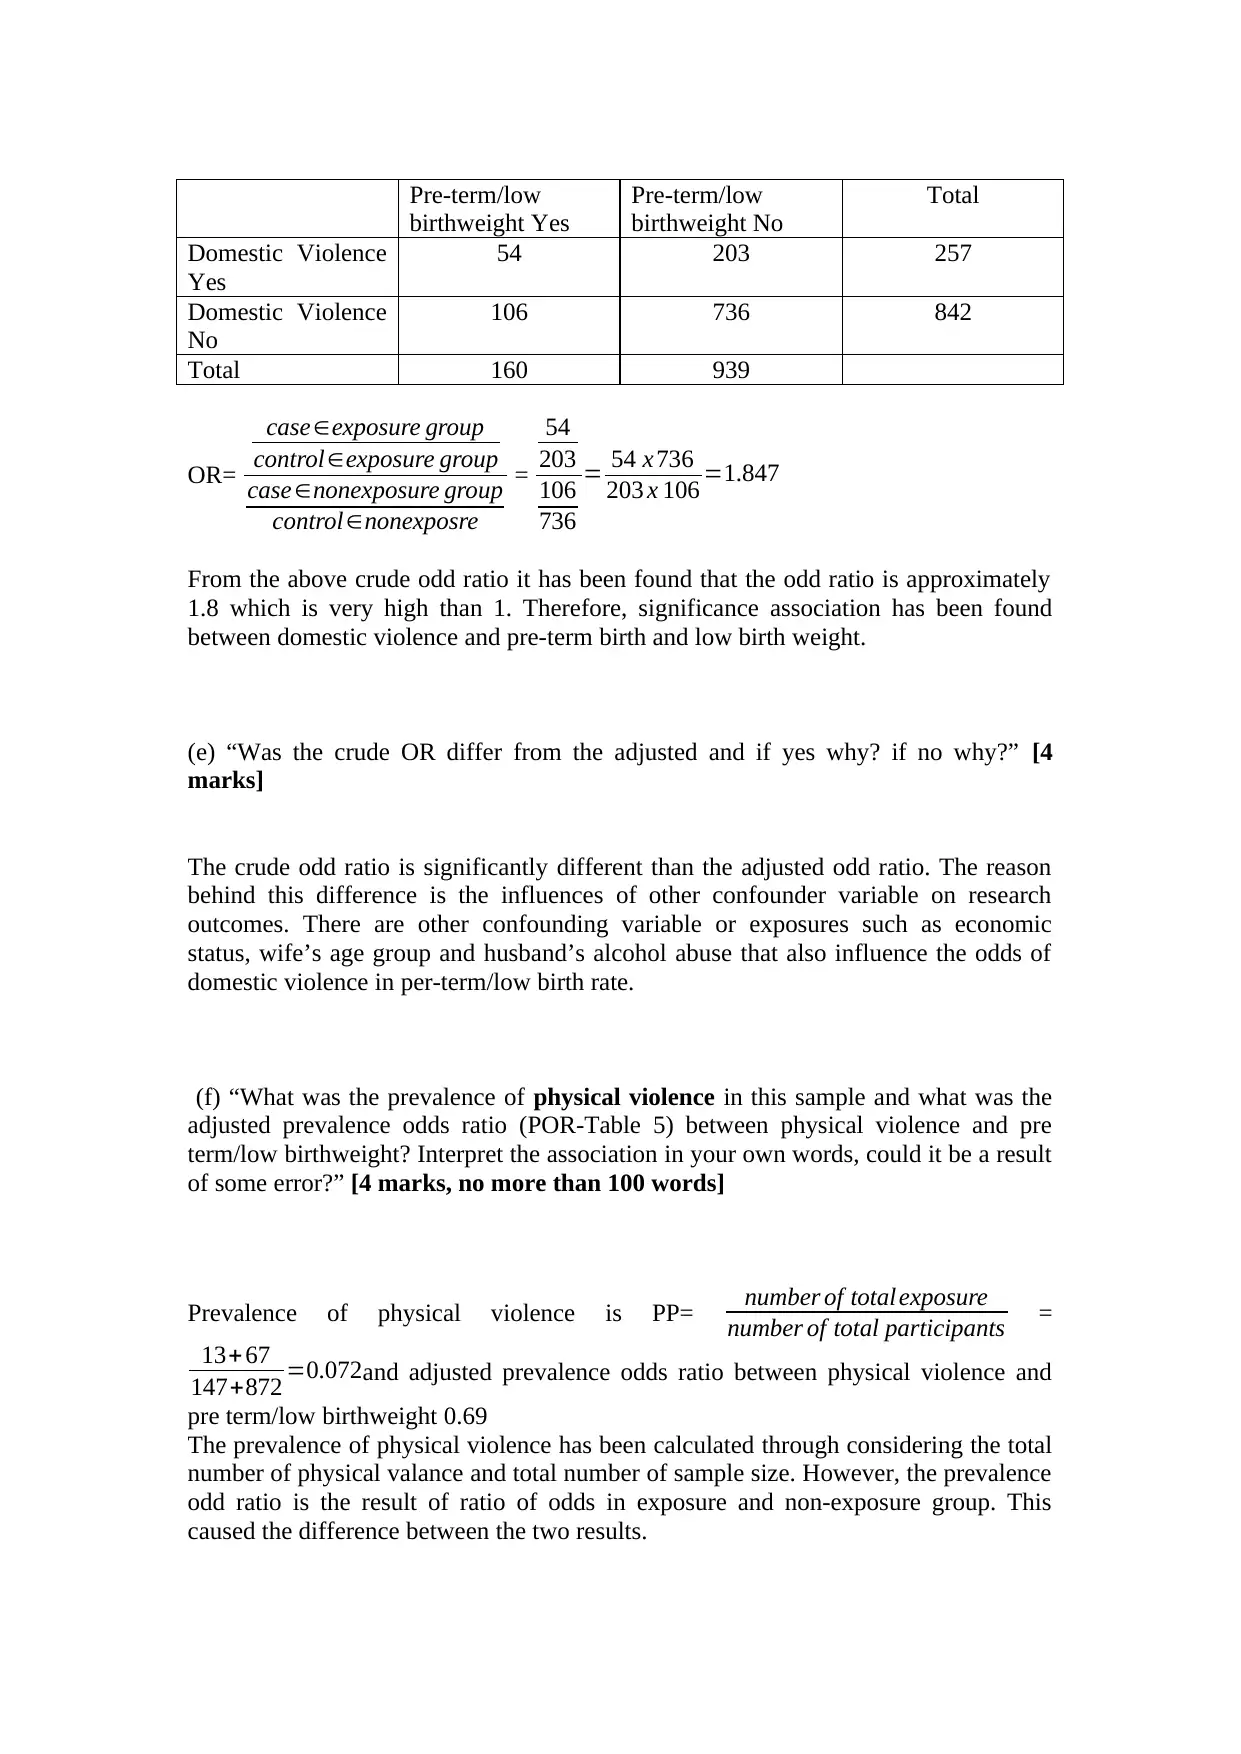
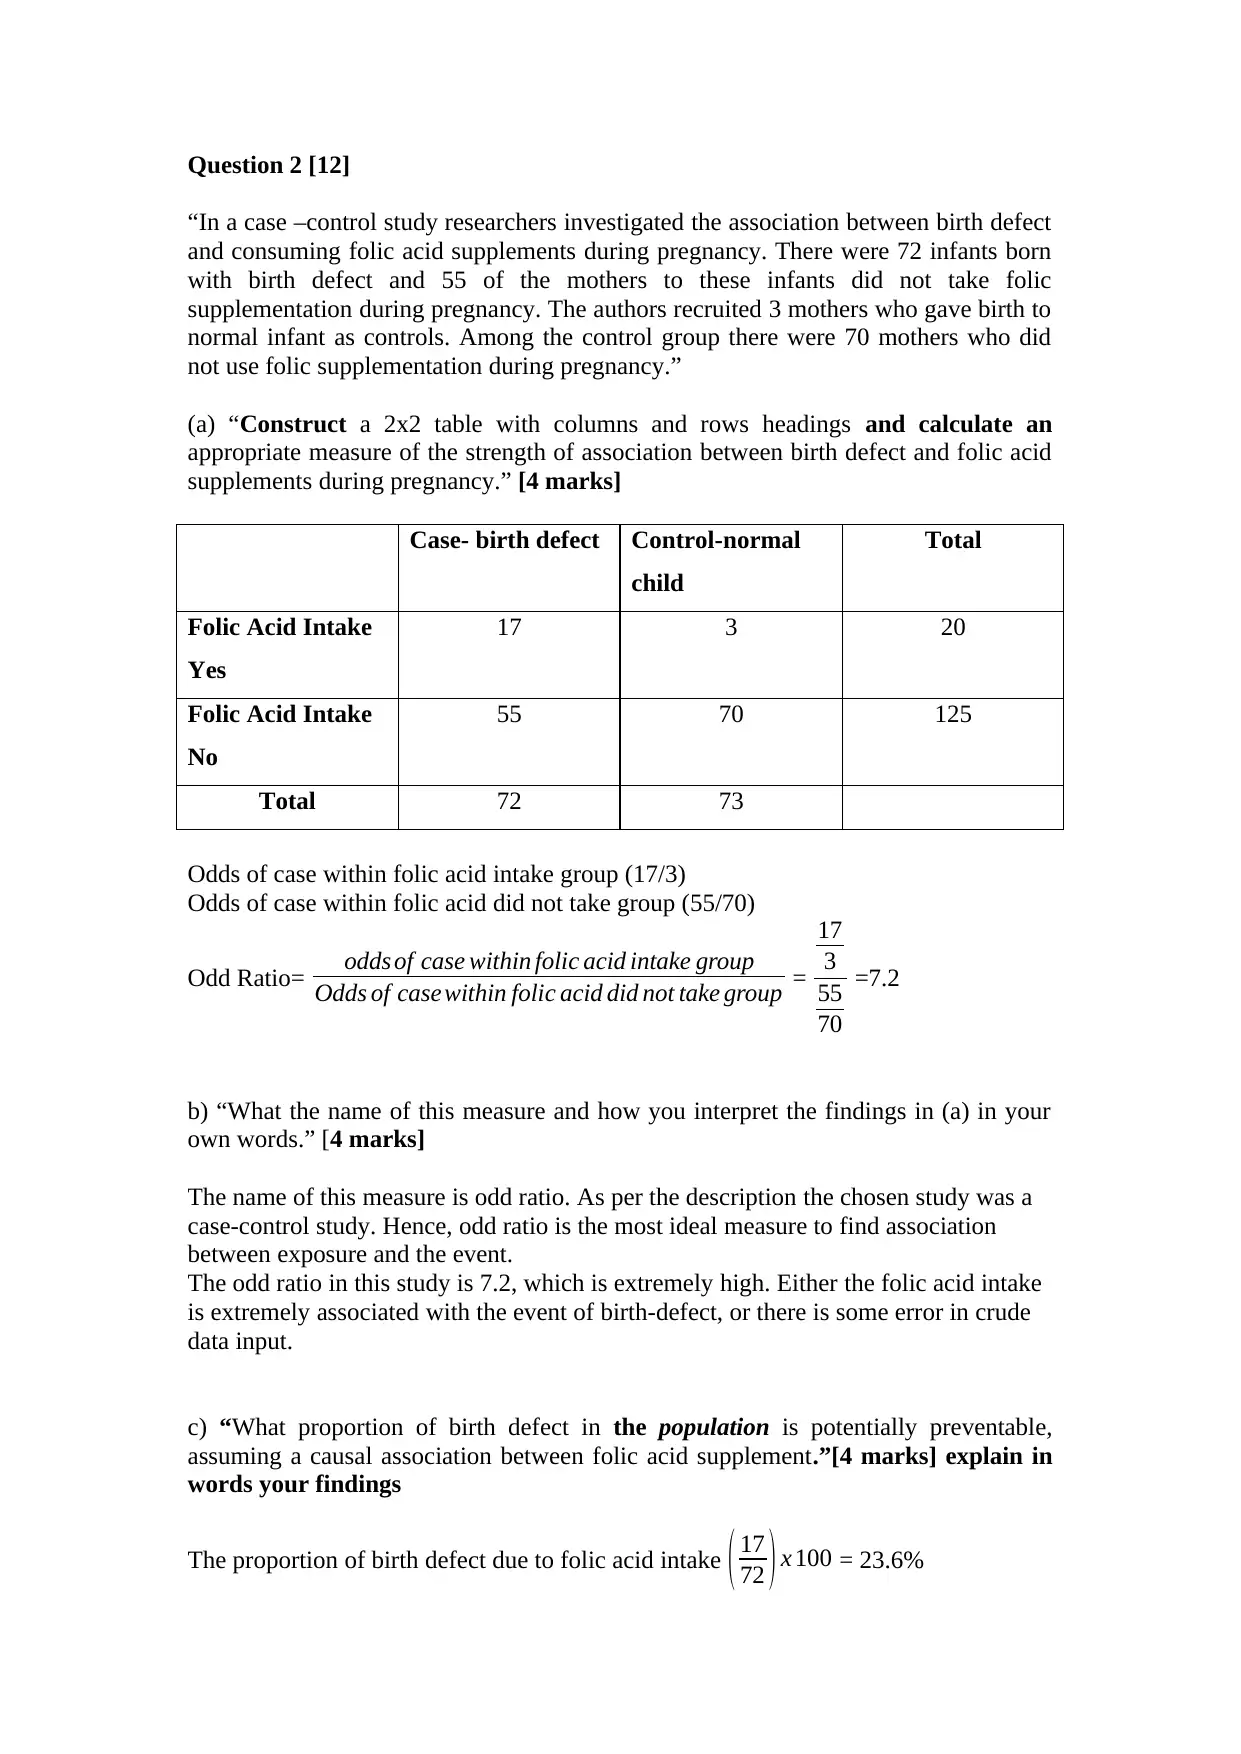
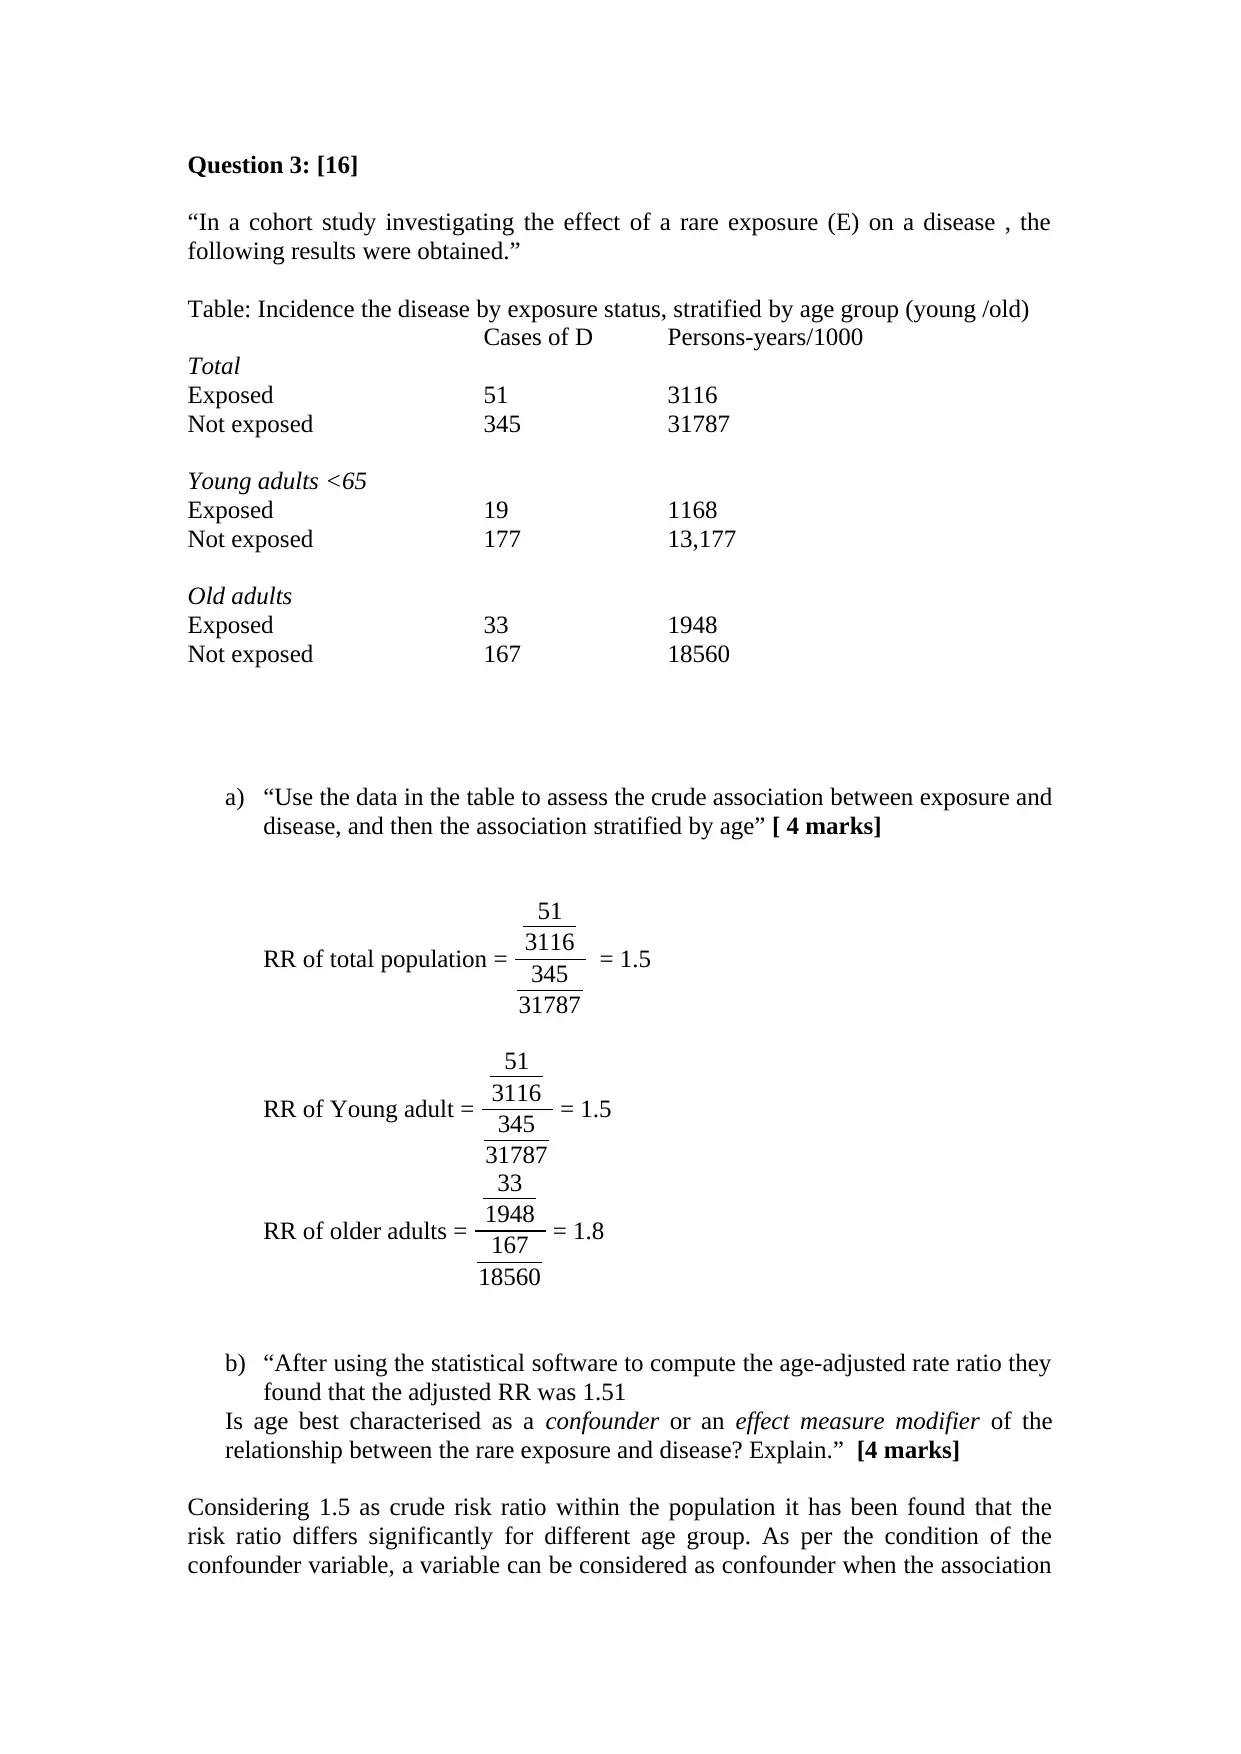
This assignment solution addresses an Epidemiology assignment involving the analysis of various study designs and epidemiological concepts. The assignment comprises four main questions. Question 1 focuses on a cross-sectional study investigating domestic violence and its association with preterm or low birthweight delivery, requiring the calculation and interpretation of odds ratios, assessing selection and measurement biases, and analyzing the impact of confounding variables. Question 2 examines a case-control study on folic acid supplementation and birth defects, including the construction of a 2x2 table, calculation of odds ratios, and interpretation of findings. Question 3 delves into a cohort study exploring the effect of a rare exposure on a disease, involving the calculation of risk ratios, assessment of confounding, and determination of attributable risk. Finally, Question 4 explores potential sources of error and bias in surveys assessing overweight and obesity, addressing measurement bias and differential misclassification. The student's responses demonstrate an understanding of epidemiological principles and their application to real-world health issues.
Contribute Materials
Your contribution can guide someone’s learning journey. Share your
documents today.

Introduction to Epidemiology (401076)
ASSIGNMENT 2
Spring, 2019
Due date: Midnight (11:55PM), 29 September 2019
This assignment is based on the learning objectives and concepts in Weeks 4-8, but
may also require knowledge from previous weeks as the knowledge is accumulated.
There are a total of 66 marks and this assignment will contribute 30% towards the
total assessment for this subject.
Your answers should be typed in the space provided between the questions! Don’t
erase the questions as there is adequate space left between questions.
Assignments should be submitted via vUWS (see specific instructions relating to
Assignment 2 on the 401076 vUWS web-site). Be as brief as possible in your
answers, and use the number of marks for a question as a guide to how much to write.
No answers need to be longer than a few short sentences or short paragraphs. Please
note this is an individual exercise.
Late assignments will not be accepted without prior approval.
Remember to save your assignment to make sure it is the final version and
submit only this. as:
Family name_First name_StudentID_Ass2_final
Secure Best Marks with AI Grader
Need help grading? Try our AI Grader for instant feedback on your assignments.

Question 1: [26]
Read the following paper, and answer the questions below: “Vo TM, Tran VTN, Cuu
TNT, Do TTH, Le TM. Domestic violence and its association with pre-term or low
birthweight delivery in Vietnam. International Journal of Women Health 2019:11
501–510”
(a) “What study design does this study employ and identify from the paper
methodological features that support the design you just noted ?” [2 mark]
The chosen design of this study is cross-sectional study where the participants were
interviewed with a structured interview questionnaire. The sampling strategy used in
this research is random sampling.
(b) “What is/are the main exposure/s and what is/are the main outcome/s of this study
in operational terms (i.e., you answer should include how the measure was defined)?”
[4 marks]
The main exposure of this study was the experiencing domestic violence during
pregnancy period. The domestic violence has been measured by their experience of
physical violence, sexual violence and emotional violence considering measurable
scale.
The main outcome of this study is pre-term delivery or low birth weight of the child.
It has been measured by binary scale (Yes/No). Low birth weight considered for the
newborn with less than 2500 gram weight.
(c) “Do you think the risk of selection bias is high or low? Your answer should be
justified by no more than 60 words!! Too long answer will be penalised ?” [4
marks]
The selection bias in this study is very low. The potential cause of selection bias in
this case would be the economic and social bias of the chosen districts and local areas
around the hospitals. In this case, the chosen hospitals are accessible by people
diverse economic and demographic. Hence, the possibility of selection bias is very
low.
(d) “Compute the crude OR for domestic violence (yes/no) and pre-term/low
birthweight from data presented in Table 4 and interpret this in your own words.” [4
mark]

Pre-term/low
birthweight Yes
Pre-term/low
birthweight No
Total
Domestic Violence
Yes
54 203 257
Domestic Violence
No
106 736 842
Total 160 939
OR=
case∈exposure group
control∈exposure group
case ∈nonexposure group
control∈nonexposre
=
54
203
106
736
= 54 x 736
203 x 106 =1.847
From the above crude odd ratio it has been found that the odd ratio is approximately
1.8 which is very high than 1. Therefore, significance association has been found
between domestic violence and pre-term birth and low birth weight.
(e) “Was the crude OR differ from the adjusted and if yes why? if no why?” [4
marks]
The crude odd ratio is significantly different than the adjusted odd ratio. The reason
behind this difference is the influences of other confounder variable on research
outcomes. There are other confounding variable or exposures such as economic
status, wife’s age group and husband’s alcohol abuse that also influence the odds of
domestic violence in per-term/low birth rate.
(f) “What was the prevalence of physical violence in this sample and what was the
adjusted prevalence odds ratio (POR-Table 5) between physical violence and pre
term/low birthweight? Interpret the association in your own words, could it be a result
of some error?” [4 marks, no more than 100 words]
Prevalence of physical violence is PP= number of total exposure
number of total participants =
13+ 67
147+872 =0.072and adjusted prevalence odds ratio between physical violence and
pre term/low birthweight 0.69
The prevalence of physical violence has been calculated through considering the total
number of physical valance and total number of sample size. However, the prevalence
odd ratio is the result of ratio of odds in exposure and non-exposure group. This
caused the difference between the two results.

(g) “What could be a source of measurement bias in this study and did the authors
tried to address this problem. Explain with evidence from the text.” [4 marks]
In this case the source of measurement bias could be the sense of confidentiality of
the participants. The data collected from the participants was not observational. The
data only considered the declaration of the participant about the domestic valance on
them. In any case if participants hide the trough the instrumental error would occur.
Avoiding this error or bias is very difficult in this research design and the author did
not try to address this issue.
Secure Best Marks with AI Grader
Need help grading? Try our AI Grader for instant feedback on your assignments.

Question 2 [12]
“In a case –control study researchers investigated the association between birth defect
and consuming folic acid supplements during pregnancy. There were 72 infants born
with birth defect and 55 of the mothers to these infants did not take folic
supplementation during pregnancy. The authors recruited 3 mothers who gave birth to
normal infant as controls. Among the control group there were 70 mothers who did
not use folic supplementation during pregnancy.”
(a) “Construct a 2x2 table with columns and rows headings and calculate an
appropriate measure of the strength of association between birth defect and folic acid
supplements during pregnancy.” [4 marks]
Case- birth defect Control-normal
child
Total
Folic Acid Intake
Yes
17 3 20
Folic Acid Intake
No
55 70 125
Total 72 73
Odds of case within folic acid intake group (17/3)
Odds of case within folic acid did not take group (55/70)
Odd Ratio= odds of case within folic acid intake group
Odds of case within folic acid did not take group =
17
3
55
70
=7.2
b) “What the name of this measure and how you interpret the findings in (a) in your
own words.” [4 marks]
The name of this measure is odd ratio. As per the description the chosen study was a
case-control study. Hence, odd ratio is the most ideal measure to find association
between exposure and the event.
The odd ratio in this study is 7.2, which is extremely high. Either the folic acid intake
is extremely associated with the event of birth-defect, or there is some error in crude
data input.
c) “What proportion of birth defect in the population is potentially preventable,
assuming a causal association between folic acid supplement.”[4 marks] explain in
words your findings
The proportion of birth defect due to folic acid intake ( 17
72 ) x 100 = 23.6%

Avoiding the folic acid intake during pregnancy 23.6% cases of child defect could be
preventable within the total population of child defect. In other words 23 child defect
can be prevented within 100 defected childbirth.
preventable within the total population of child defect. In other words 23 child defect
can be prevented within 100 defected childbirth.

Question 3: [16]
“In a cohort study investigating the effect of a rare exposure (E) on a disease , the
following results were obtained.”
Table: Incidence the disease by exposure status, stratified by age group (young /old)
Cases of D Persons-years/1000
Total
Exposed 51 3116
Not exposed 345 31787
Young adults <65
Exposed 19 1168
Not exposed 177 13,177
Old adults
Exposed 33 1948
Not exposed 167 18560
a) “Use the data in the table to assess the crude association between exposure and
disease, and then the association stratified by age” [ 4 marks]
RR of total population =
51
3116
345
31787
= 1.5
RR of Young adult =
51
3116
345
31787
= 1.5
RR of older adults =
33
1948
167
18560
= 1.8
b) “After using the statistical software to compute the age-adjusted rate ratio they
found that the adjusted RR was 1.51
Is age best characterised as a confounder or an effect measure modifier of the
relationship between the rare exposure and disease? Explain.” [4 marks]
Considering 1.5 as crude risk ratio within the population it has been found that the
risk ratio differs significantly for different age group. As per the condition of the
confounder variable, a variable can be considered as confounder when the association
Paraphrase This Document
Need a fresh take? Get an instant paraphrase of this document with our AI Paraphraser

between exposure and event changes depending on the variable. Hence, considering
the changes is RR depending on age group, the age can be considered as confounder
or an effect measure modifier.
c) “What is the attributable risk of the exposure in older people?” [4 marks]
Among older adult population:
Incident prevalence in exposed group = ( 33
1948 )
Incident prevalence in unexposed group = ( 167
18560 )
Attributable Risk = (Incident prevalence in exposed group - Incident in prevalence
unexposed group) = ( 33
1948 )− ( 167
18560 ) = 0.0079
Attributable Risk Percentage = (0.0079x100) = 0.79%
d) “How would you interpret the finding in 3 (c)?” [4 marks]
From the attributable risk percent, it can be interpreted that prevalence of incident in
exposed group is 0.79% higher than non-exposed group. Hence, the difference
between association of exposure and event is considerably low.
Question 4 [12]
“In a survey of the prevalence of overweight and obese participants were measure
once for their weight and once for their height in the same lab”
a) “What source of error/bias, if at all, it can introduce to the estimated
prevalence? (explain briefly)” [4 marks]
Because of measuring weight and height in different times, the synchronisation
between two data is essential. As an example misplacing the height data of participant
A with participant B and misplacing the weight data similarly can cause significant
error or bias in results. This type bias due to information gathering and processing is
known as informational bias.
“In another survey to estimate the prevalence of overweight and obesity
participants were asked to report on their weight and height from their head ”
b) What source of error/bias, if at all, in can introduce to the estimated
prevalence? Explain (you can use reference here) [4 marks]
This case the error could occur because of the data collection dependency of
individual opinions about their weight and height. A wrong perception of height

and weight of participants can lead to wrong information and resultant biases.
Hence, this case the bias presence in the estimated prevalence would be the
informational bias.
c) “if you were told that women were more likely to underestimate their weight
and men accurately report their weight what source of bias it is : [4 marks]
i) Differential misclassification.
ii) Non-differential misclassification.
iii) Recall bias.
iv) Confounding.”
Explain your answer briefly
In this case, the differential misclassification occurs because of the opinion
differences based on the gender differences of the group. When the probability of
being misclassified differs between two or more groups differential misclassification
occurs. In this case the probability of misclassifying the BMI is different between
male and female group because women were more likely to underestimate their
weight.
1 out of 9
Related Documents

Your All-in-One AI-Powered Toolkit for Academic Success.
+13062052269
info@desklib.com
Available 24*7 on WhatsApp / Email
Unlock your academic potential
© 2024 | Zucol Services PVT LTD | All rights reserved.