University Finance: Introduction to Accounts and Finance Assignment 2
VerifiedAdded on 2020/05/08
|18
|4414
|70
Report
AI Summary
This report provides a comprehensive analysis of financial concepts, focusing on debt and equity valuation, cost of capital, and market analysis. The report examines the debt structure of a firm, differentiating between short-term and long-term debts, and assesses its consistency within the industry. It calculates the cost of debt and discusses the factors influencing it. The assignment delves into the cost of equity, explaining its calculation using the Capital Asset Pricing Model (CAPM), and evaluates a firm's revenue, earnings, and dividends. The report also values the company's stock using comparable approaches and the dividend growth model, considering factors that affect stock prices. Furthermore, it calculates the Weighted Average Cost of Capital (WACC), explaining the role of tax rates and the difference between the cost of equity and debt. The report also discusses the application of WACC in investment decision-making, capital structure, and its consistency with industry standards, along with the optimal capital structure and factors influencing it. Finally, the report comments on the firm's financial performance, summarizes the results of the financial analysis, and reviews important items covered in the annual report. This assignment is a student submission to Desklib, a platform offering AI-based study tools.
INTRODUCTION TO
ACCOUNTS AND
FINANCE
ACCOUNTS AND
FINANCE
Paraphrase This Document
Need a fresh take? Get an instant paraphrase of this document with our AI Paraphraser
TABLE OF CONTENTS
ASSIGNMENT 2.......................................................................................................................1
PART B......................................................................................................................................1
DEBT VALUATION.................................................................................................................1
Short term and long term debts used by the firm...................................................................1
Checking debt structure consistency of the firm within the industry.....................................1
How does industry influences the proportion of long term and short term debt used by the
firm.........................................................................................................................................2
What is company’s cost of debt..............................................................................................2
SHARE VALUATION..............................................................................................................3
What is cost of equity of an entity?........................................................................................3
Evaluate and discuss firm’s revenue, earnings, and EPS, dividend and growth expectations
................................................................................................................................................7
Valuing company’s stock using comparable approach and dividend growth model and also
state some factors influencing stock price along with the reasons.........................................9
State additional information required in valuing the stock of firm with reasons.................11
COST OF CAPITAL................................................................................................................11
Calculate WACC..................................................................................................................11
Explain importance of tax rate in the calculation of WACC................................................12
Explain the difference between cost of equity and cost of debt...........................................12
Inclusion of current liabilities in the cost of capital calculation and its advantages and
disadvantages........................................................................................................................13
What is the role of WACC in an entity and its application decision making while
evaluating various investments.............................................................................................13
Provide examples about the application of WACC in analyzing two investments..............13
Define capital structure and explain its consistency with the industry................................13
Discuss optimal capital structure and state economic circumstances in changing the capitals
structure of the firm..............................................................................................................14
MARKET ANALYSIS............................................................................................................14
Comment on the financial performance of the firm with the industry.................................14
Summarize the results of financial analysis of the firm.......................................................14
Comment on important items covered in the annual report of an entity..............................14
REFERENCES.........................................................................................................................16
ASSIGNMENT 2
PART B
DEBT VALUATION
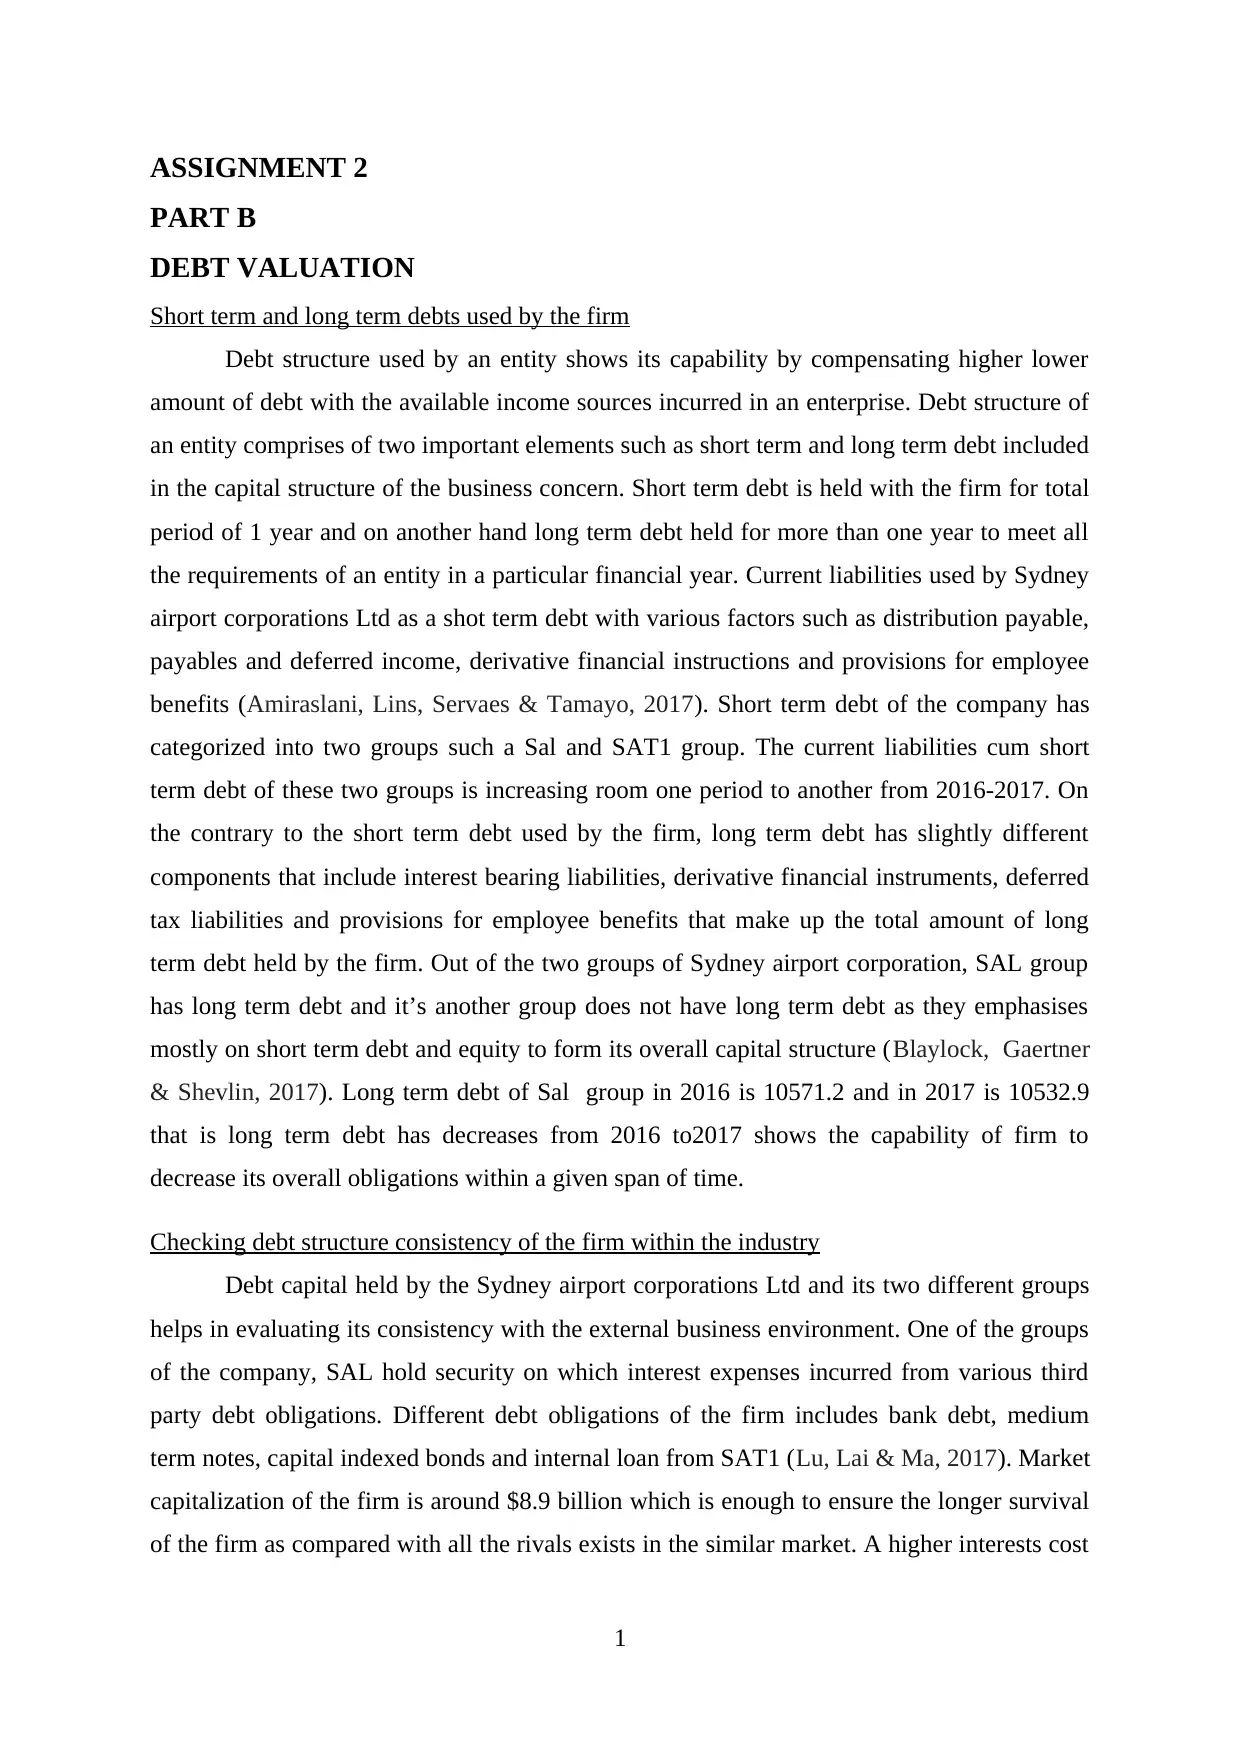
Short term and long term debts used by the firm
Debt structure used by an entity shows its capability by compensating higher lower
amount of debt with the available income sources incurred in an enterprise. Debt structure of
an entity comprises of two important elements such as short term and long term debt included
in the capital structure of the business concern. Short term debt is held with the firm for total
period of 1 year and on another hand long term debt held for more than one year to meet all
the requirements of an entity in a particular financial year. Current liabilities used by Sydney
airport corporations Ltd as a shot term debt with various factors such as distribution payable,
payables and deferred income, derivative financial instructions and provisions for employee
benefits (Amiraslani, Lins, Servaes & Tamayo, 2017). Short term debt of the company has
categorized into two groups such a Sal and SAT1 group. The current liabilities cum short
term debt of these two groups is increasing room one period to another from 2016-2017. On
the contrary to the short term debt used by the firm, long term debt has slightly different
components that include interest bearing liabilities, derivative financial instruments, deferred
tax liabilities and provisions for employee benefits that make up the total amount of long
term debt held by the firm. Out of the two groups of Sydney airport corporation, SAL group
has long term debt and it’s another group does not have long term debt as they emphasises
mostly on short term debt and equity to form its overall capital structure (Blaylock, Gaertner
& Shevlin, 2017). Long term debt of Sal group in 2016 is 10571.2 and in 2017 is 10532.9
that is long term debt has decreases from 2016 to2017 shows the capability of firm to
decrease its overall obligations within a given span of time.
Checking debt structure consistency of the firm within the industry
Debt capital held by the Sydney airport corporations Ltd and its two different groups
helps in evaluating its consistency with the external business environment. One of the groups
of the company, SAL hold security on which interest expenses incurred from various third
party debt obligations. Different debt obligations of the firm includes bank debt, medium
term notes, capital indexed bonds and internal loan from SAT1 (Lu, Lai & Ma, 2017). Market
capitalization of the firm is around $8.9 billion which is enough to ensure the longer survival
of the firm as compared with all the rivals exists in the similar market. A higher interests cost
1
PART B
DEBT VALUATION
Short term and long term debts used by the firm
Debt structure used by an entity shows its capability by compensating higher lower
amount of debt with the available income sources incurred in an enterprise. Debt structure of
an entity comprises of two important elements such as short term and long term debt included
in the capital structure of the business concern. Short term debt is held with the firm for total
period of 1 year and on another hand long term debt held for more than one year to meet all
the requirements of an entity in a particular financial year. Current liabilities used by Sydney
airport corporations Ltd as a shot term debt with various factors such as distribution payable,
payables and deferred income, derivative financial instructions and provisions for employee
benefits (Amiraslani, Lins, Servaes & Tamayo, 2017). Short term debt of the company has
categorized into two groups such a Sal and SAT1 group. The current liabilities cum short
term debt of these two groups is increasing room one period to another from 2016-2017. On
the contrary to the short term debt used by the firm, long term debt has slightly different
components that include interest bearing liabilities, derivative financial instruments, deferred
tax liabilities and provisions for employee benefits that make up the total amount of long
term debt held by the firm. Out of the two groups of Sydney airport corporation, SAL group
has long term debt and it’s another group does not have long term debt as they emphasises
mostly on short term debt and equity to form its overall capital structure (Blaylock, Gaertner
& Shevlin, 2017). Long term debt of Sal group in 2016 is 10571.2 and in 2017 is 10532.9
that is long term debt has decreases from 2016 to2017 shows the capability of firm to
decrease its overall obligations within a given span of time.
Checking debt structure consistency of the firm within the industry
Debt capital held by the Sydney airport corporations Ltd and its two different groups
helps in evaluating its consistency with the external business environment. One of the groups
of the company, SAL hold security on which interest expenses incurred from various third
party debt obligations. Different debt obligations of the firm includes bank debt, medium
term notes, capital indexed bonds and internal loan from SAT1 (Lu, Lai & Ma, 2017). Market
capitalization of the firm is around $8.9 billion which is enough to ensure the longer survival
of the firm as compared with all the rivals exists in the similar market. A higher interests cost
1
⊘ This is a preview!⊘
Do you want full access?
Subscribe today to unlock all pages.
Trusted by 1+ million students worldwide
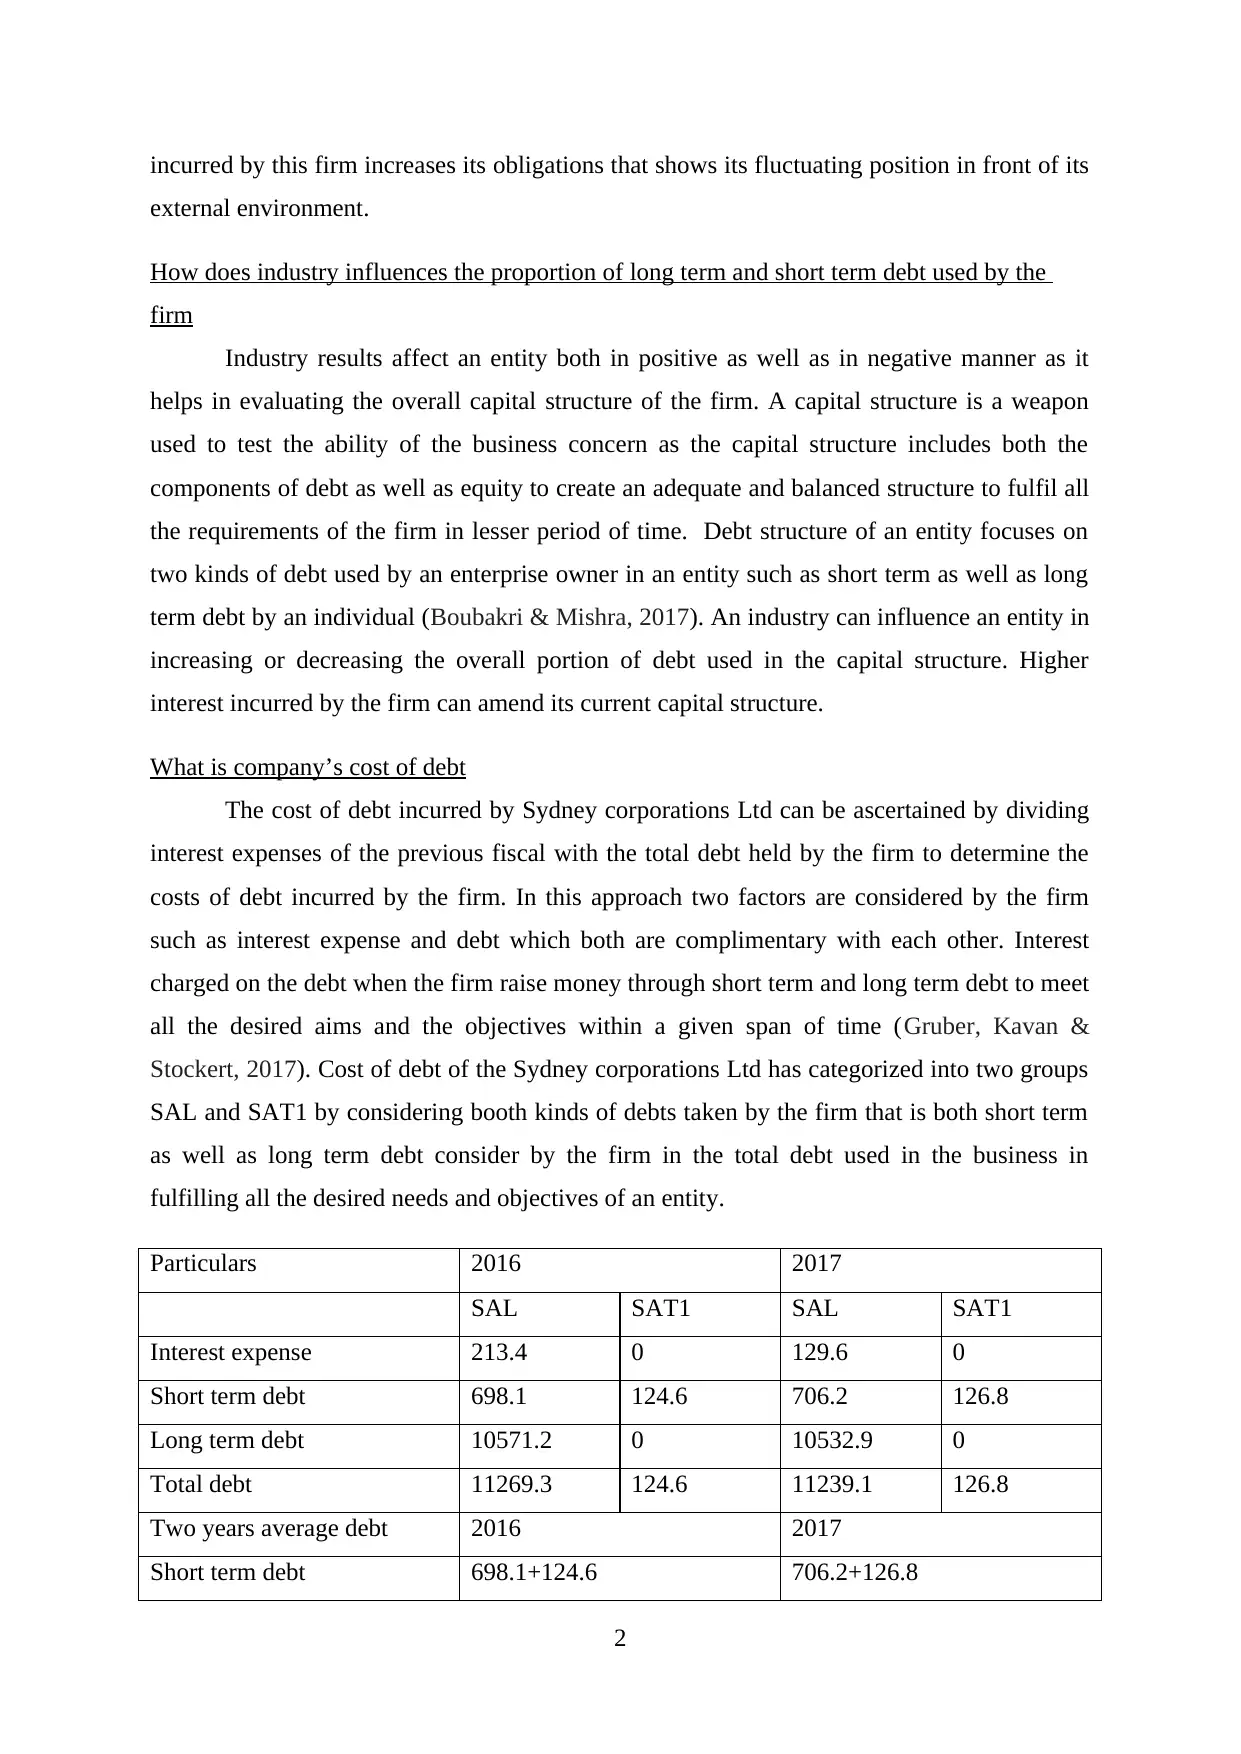
incurred by this firm increases its obligations that shows its fluctuating position in front of its
external environment.
How does industry influences the proportion of long term and short term debt used by the
firm
Industry results affect an entity both in positive as well as in negative manner as it
helps in evaluating the overall capital structure of the firm. A capital structure is a weapon
used to test the ability of the business concern as the capital structure includes both the
components of debt as well as equity to create an adequate and balanced structure to fulfil all
the requirements of the firm in lesser period of time. Debt structure of an entity focuses on
two kinds of debt used by an enterprise owner in an entity such as short term as well as long
term debt by an individual (Boubakri & Mishra, 2017). An industry can influence an entity in
increasing or decreasing the overall portion of debt used in the capital structure. Higher
interest incurred by the firm can amend its current capital structure.
What is company’s cost of debt
The cost of debt incurred by Sydney corporations Ltd can be ascertained by dividing
interest expenses of the previous fiscal with the total debt held by the firm to determine the
costs of debt incurred by the firm. In this approach two factors are considered by the firm
such as interest expense and debt which both are complimentary with each other. Interest
charged on the debt when the firm raise money through short term and long term debt to meet
all the desired aims and the objectives within a given span of time (Gruber, Kavan &
Stockert, 2017). Cost of debt of the Sydney corporations Ltd has categorized into two groups
SAL and SAT1 by considering booth kinds of debts taken by the firm that is both short term
as well as long term debt consider by the firm in the total debt used in the business in
fulfilling all the desired needs and objectives of an entity.
Particulars 2016 2017
SAL SAT1 SAL SAT1
Interest expense 213.4 0 129.6 0
Short term debt 698.1 124.6 706.2 126.8
Long term debt 10571.2 0 10532.9 0
Total debt 11269.3 124.6 11239.1 126.8
Two years average debt 2016 2017
Short term debt 698.1+124.6 706.2+126.8
2
Paraphrase This Document
Need a fresh take? Get an instant paraphrase of this document with our AI Paraphraser
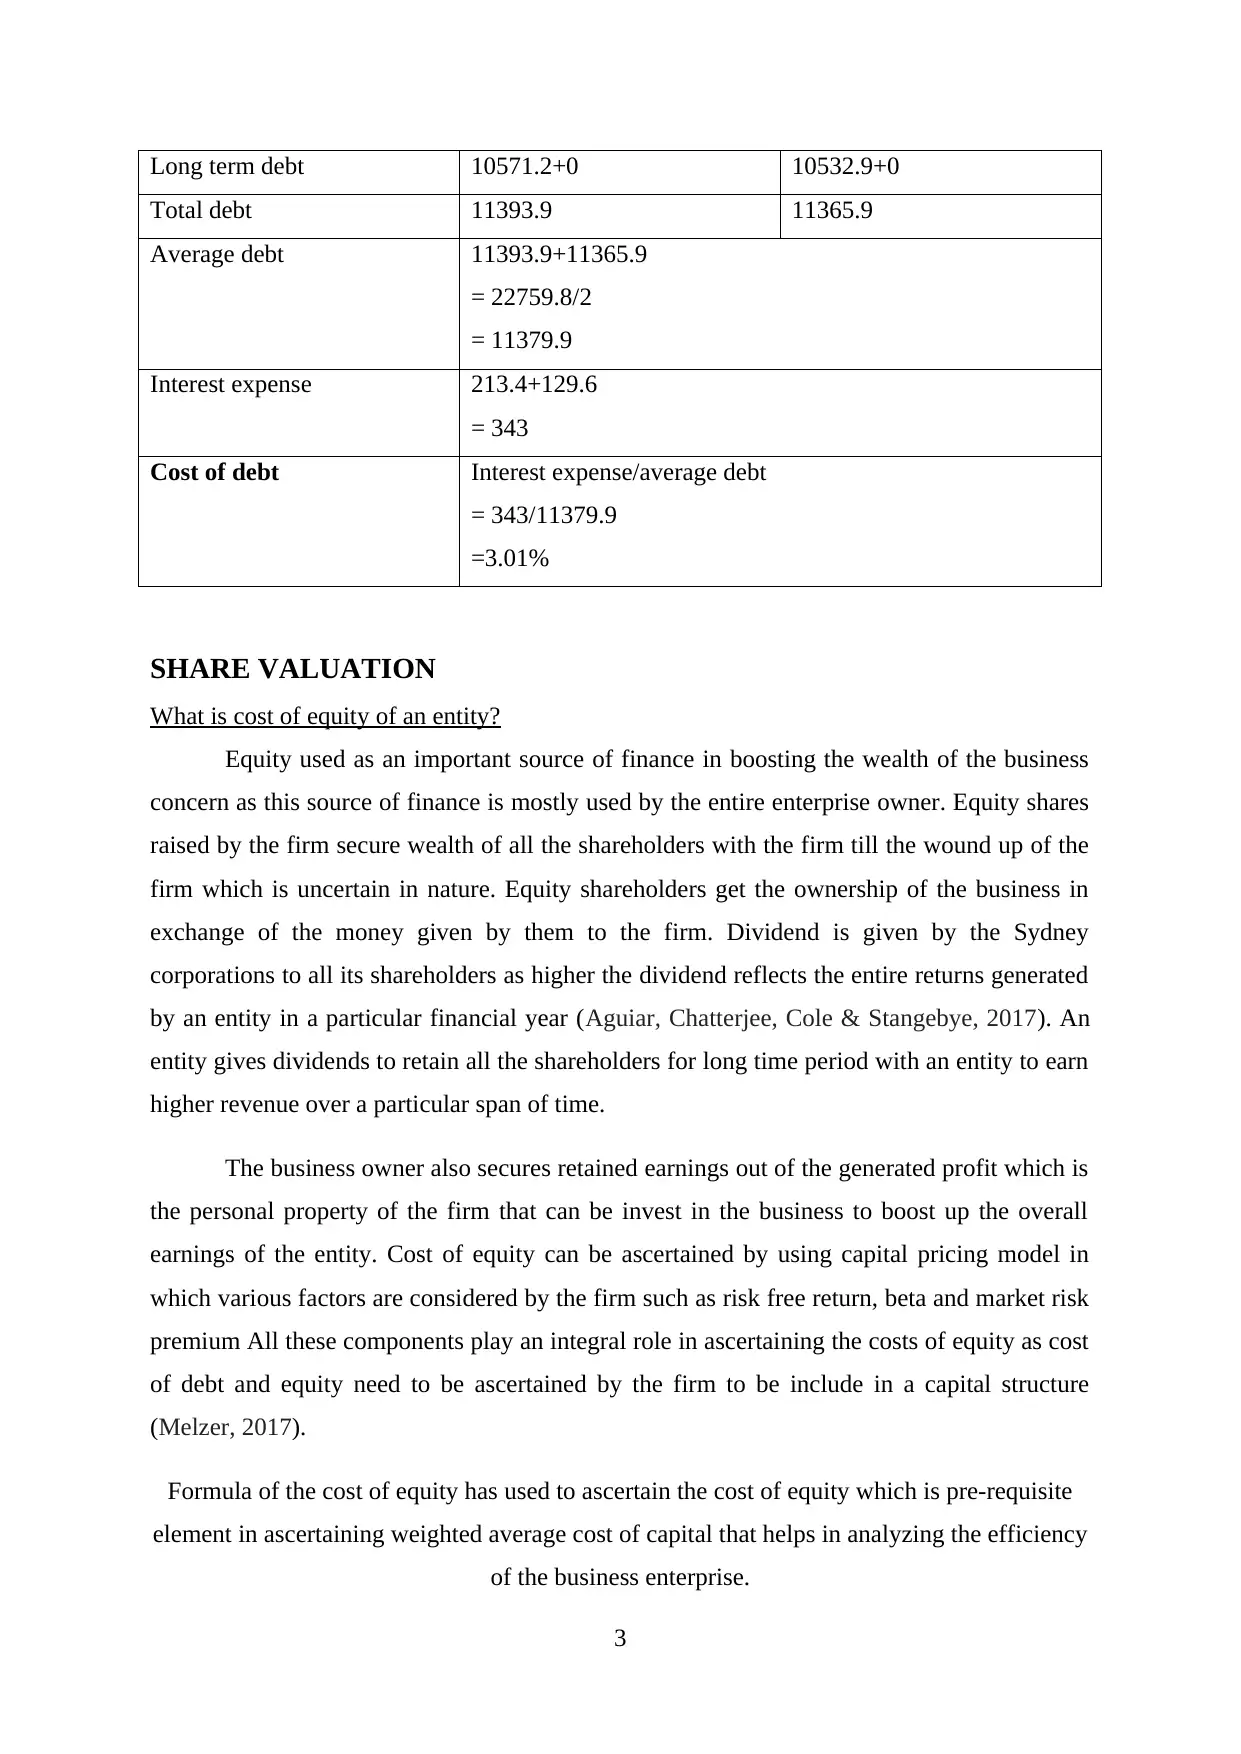
Long term debt 10571.2+0 10532.9+0
Total debt 11393.9 11365.9
Average debt 11393.9+11365.9
= 22759.8/2
= 11379.9
Interest expense 213.4+129.6
= 343
Cost of debt Interest expense/average debt
= 343/11379.9
=3.01%
SHARE VALUATION
What is cost of equity of an entity?
Equity used as an important source of finance in boosting the wealth of the business
concern as this source of finance is mostly used by the entire enterprise owner. Equity shares
raised by the firm secure wealth of all the shareholders with the firm till the wound up of the
firm which is uncertain in nature. Equity shareholders get the ownership of the business in
exchange of the money given by them to the firm. Dividend is given by the Sydney
corporations to all its shareholders as higher the dividend reflects the entire returns generated
by an entity in a particular financial year (Aguiar, Chatterjee, Cole & Stangebye, 2017). An
entity gives dividends to retain all the shareholders for long time period with an entity to earn
higher revenue over a particular span of time.
The business owner also secures retained earnings out of the generated profit which is
the personal property of the firm that can be invest in the business to boost up the overall
earnings of the entity. Cost of equity can be ascertained by using capital pricing model in
which various factors are considered by the firm such as risk free return, beta and market risk
premium All these components play an integral role in ascertaining the costs of equity as cost
of debt and equity need to be ascertained by the firm to be include in a capital structure
(Melzer, 2017).
Formula of the cost of equity has used to ascertain the cost of equity which is pre-requisite
element in ascertaining weighted average cost of capital that helps in analyzing the efficiency
of the business enterprise.
3
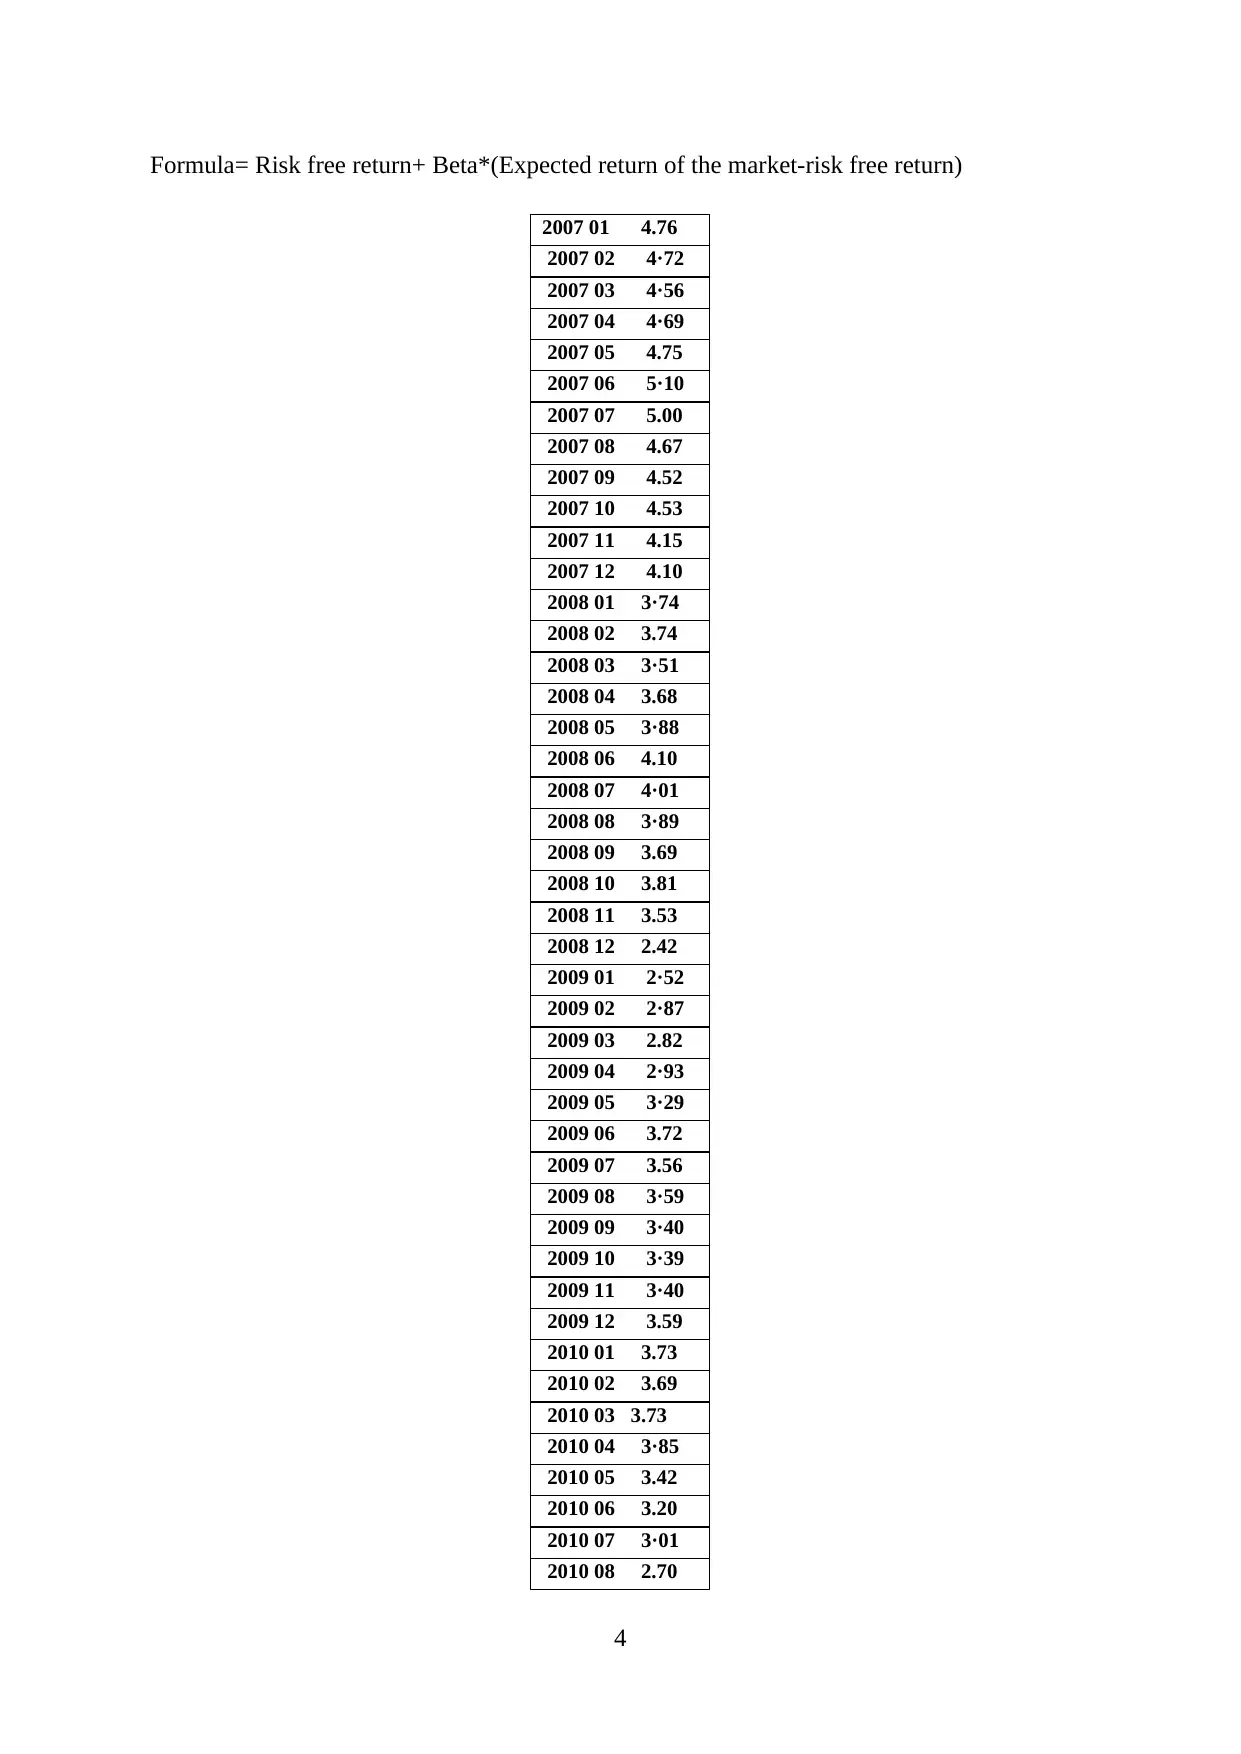
Formula= Risk free return+ Beta*(Expected return of the market-risk free return)
2007 01 244.76
2007 02 294·72
2007 03 774·56
2007 04 114·69
2007 05 304.75
2007 06 915·10
2007 07 395.00
2007 08 554.67
2007 09 344.52
2007 10 864.53
2007 11 634.15
2007 12 104.10
2008 01 443·74
2008 02 513.74
2008 03 173·51
2008 04 763.68
2008 05 913·88
2008 06 504.10
2008 07 964·01
2008 08 793·89
2008 09 323.69
2008 10 693.81
2008 11 193.53
2008 12 692.42
2009 01 482·52
2009 02 232·87
2009 03 302.82
2009 04 222·93
2009 05 463·29
2009 06 493.72
2009 07 993.56
2009 08 373·59
2009 09 583·40
2009 10 103·39
2009 11 183·40
2009 12 403.59
2010 01 413.73
2010 02 943.69
2010 03 93.73
2010 04 823·85
2010 05 753.42
2010 06 133.20
2010 07 143·01
2010 08 382.70
4
⊘ This is a preview!⊘
Do you want full access?
Subscribe today to unlock all pages.
Trusted by 1+ million students worldwide
2010 09 682·65
2010 10 62.54
2010 11 32.76
2010 12 93.29
2011 01 513.39
2011 02 353·58
2011 03 693·41
2011 04 193·46
2011 05 823.17
2011 06 893·00
2011 07 333·00
2011 08 192.30
2011 09 401.98
2011 10 802·15
2011 11 382·01
2011 12 851.98
2012 01 341.97
2012 02 461.97
2012 03 542.17
2012 04 172.05
2012 05 951.80
2012 06 501·62
2012 07 741.53
2012 08 401·68
2012 09 791·72
2012 10 801.75
2012 11 181.65
2012 12 51·72
2013 01 681.91
2013 02 491.98
2013 03 291.96
2013 04 871·76
2013 05 691.93
2013 06 942.30
2013 07 782.58
2013 08 872.74
2013 09 142.81
2013 10 792.62
2013 11 572·72
2013 12 292·90
2014 01 582.86
2014 02 922.71
2014 03 872.72
2014 04 652.71
2014 05 842.56
2014 06 442·60
5
Paraphrase This Document
Need a fresh take? Get an instant paraphrase of this document with our AI Paraphraser
2014 07 112.54
2014 08 692·42
2014 09 992·53
2014 10 752.30
2014 11 992·33
2014 12 432.21
2015 01 331·88
2015 02 481.98
2015 03 442·04
2015 04 111·94
2015 05 442.20
2015 06 492.36
2015 07 662·32
2015 08 242·17
2015 09 132.17
2015 10 922.07
2015 11 92.26
2015 12 572·24
2016 01 472.09
2016 02 151·78
2016 03 421·89
2016 04 111.81
2016 05 781·81
2016 06 811·64
2016 07 601.50
2016 08 101·56
2016 09 621·63
2016 10 771·76
2016 11 802.14
2016 12 62.49
2017 01 802·43
2017 02 172.42
2017 03 482·48
2017 04 742.30
2017 05 402.30
2017 06 382.19
2017 07 332.32
2017 08 152.21
2017 09 742.20
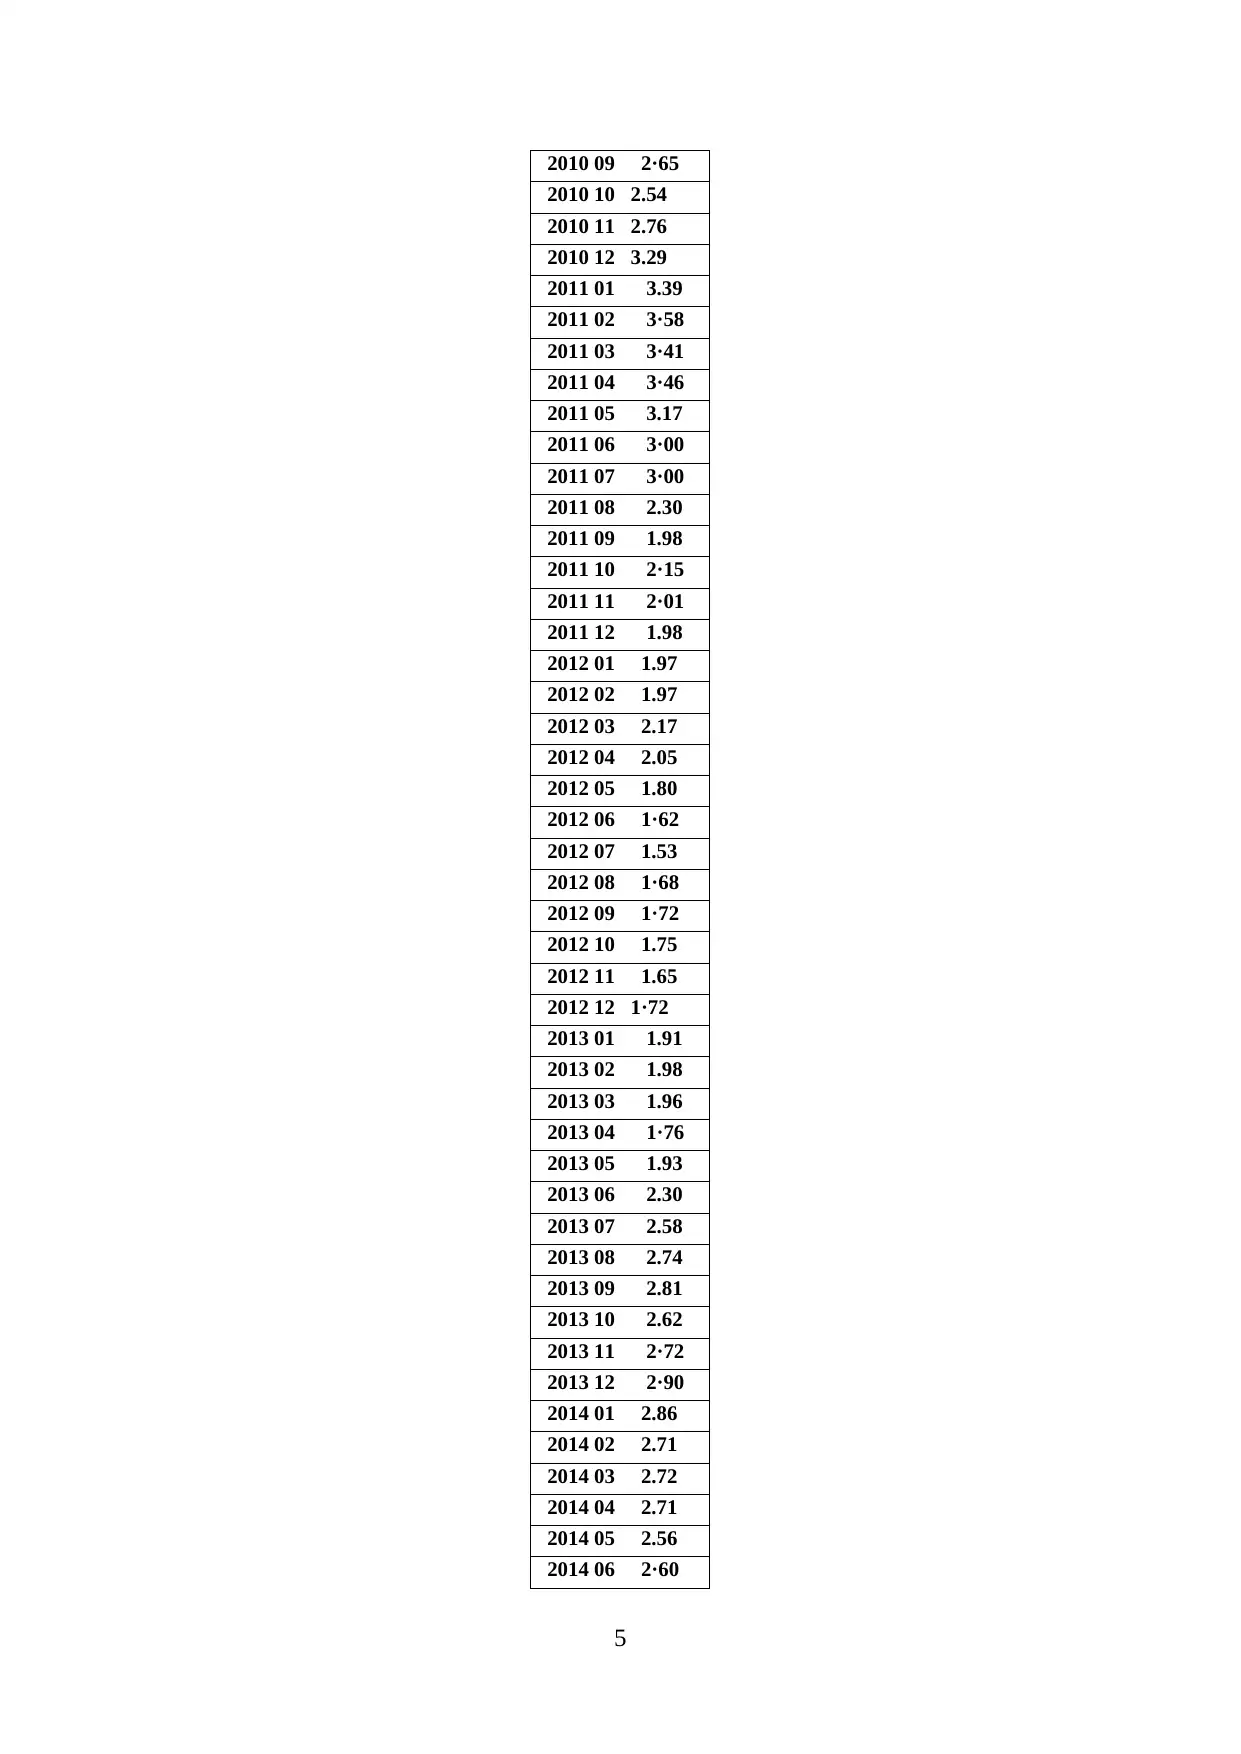
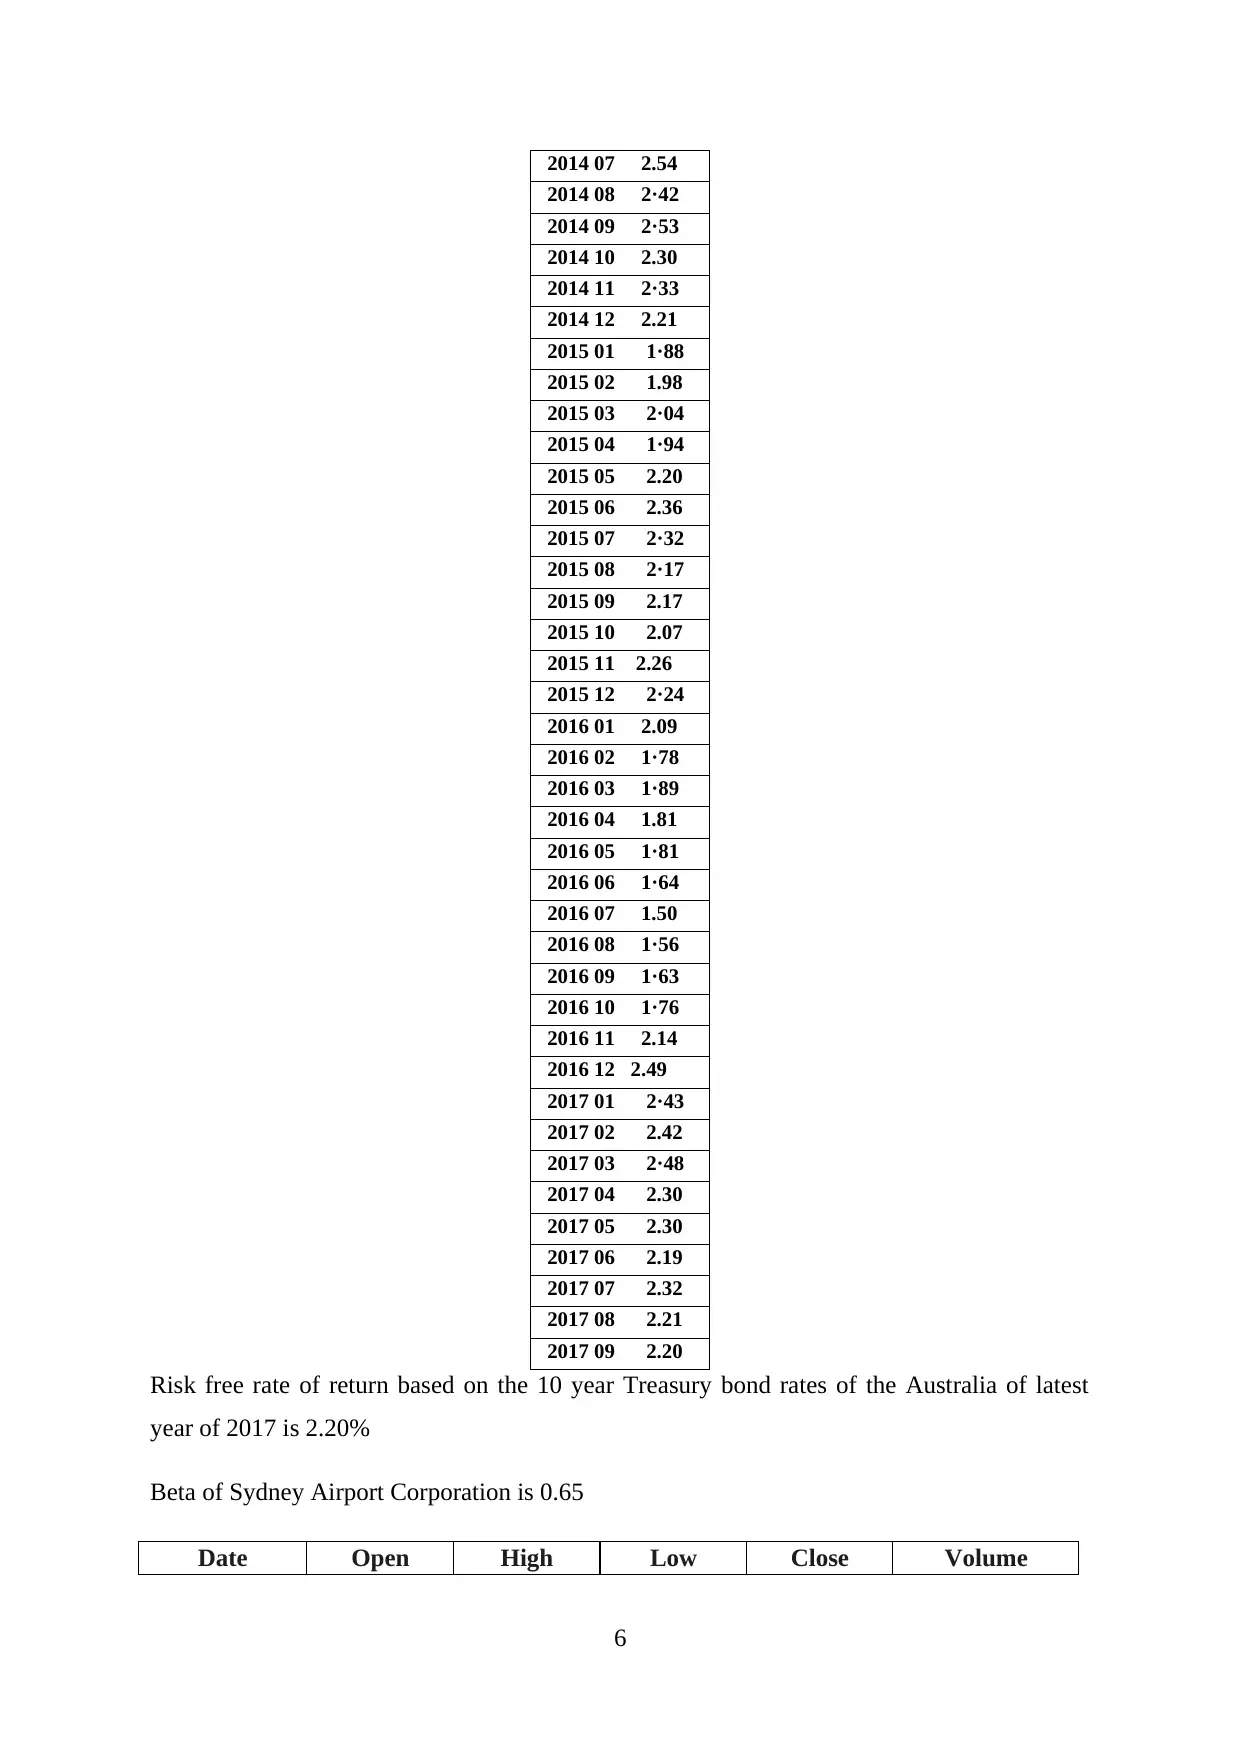
Risk free rate of return based on the 10 year Treasury bond rates of the Australia of latest
year of 2017 is 2.20%
Beta of Sydney Airport Corporation is 0.65
Date Open High Low Close Volume
6
2014 08 692·42
2014 09 992·53
2014 10 752.30
2014 11 992·33
2014 12 432.21
2015 01 331·88
2015 02 481.98
2015 03 442·04
2015 04 111·94
2015 05 442.20
2015 06 492.36
2015 07 662·32
2015 08 242·17
2015 09 132.17
2015 10 922.07
2015 11 92.26
2015 12 572·24
2016 01 472.09
2016 02 151·78
2016 03 421·89
2016 04 111.81
2016 05 781·81
2016 06 811·64
2016 07 601.50
2016 08 101·56
2016 09 621·63
2016 10 771·76
2016 11 802.14
2016 12 62.49
2017 01 802·43
2017 02 172.42
2017 03 482·48
2017 04 742.30
2017 05 402.30
2017 06 382.19
2017 07 332.32
2017 08 152.21
2017 09 742.20
Risk free rate of return based on the 10 year Treasury bond rates of the Australia of latest
year of 2017 is 2.20%
Beta of Sydney Airport Corporation is 0.65
Date Open High Low Close Volume
6
13-Oct-17 7.3 7.32 7.245 7.29 2,452,142
12-Oct-17 7.2 7.31 7.18 7.3 3,768,798
11-Oct-17 7.13 7.2 7.13 7.18 4,031,687
10-Oct-17 7.12 7.19 7.115 7.14 4,207,929
9-Oct-17 7.12 7.155 7.1 7.12 3,496,682
6-Oct-17 6.98 7.065 6.96 7.05 3,465,365
5-Oct-17 6.96 6.99 6.95 6.95 3,677,799
4-Oct-17 7.02 7.08 6.955 6.97 3,705,190
3-Oct-17 7.09 7.11 7 7.02 3,583,947
2-Oct-17 7.11 7.195 7.08 7.08 3,015,701
Total 71.1 35,405,240
Average 497963.99
0.0140647
Expected market return 1.4064698
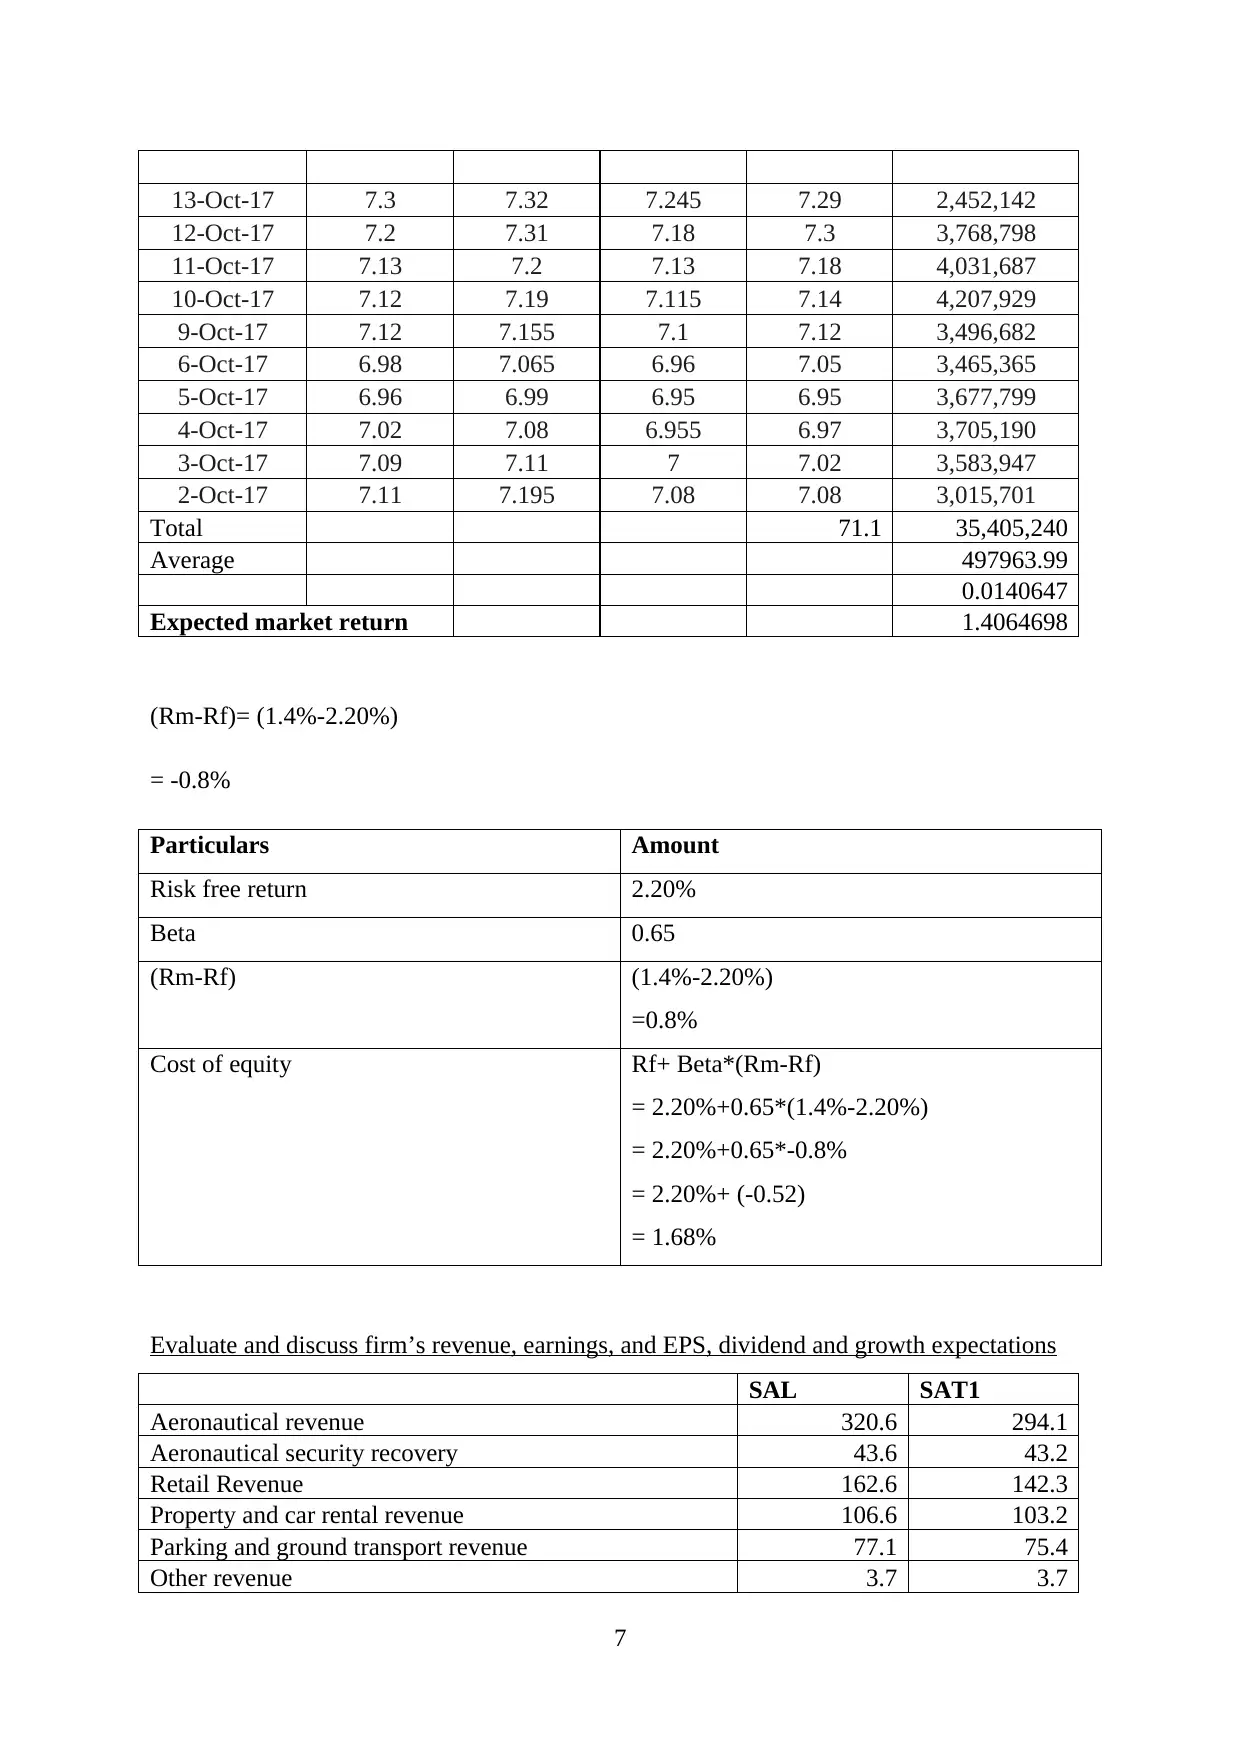
(Rm-Rf)= (1.4%-2.20%)
= -0.8%
Particulars Amount
Risk free return 2.20%
Beta 0.65
(Rm-Rf) (1.4%-2.20%)
=0.8%
Cost of equity Rf+ Beta*(Rm-Rf)
= 2.20%+0.65*(1.4%-2.20%)
= 2.20%+0.65*-0.8%
= 2.20%+ (-0.52)
= 1.68%
Evaluate and discuss firm’s revenue, earnings, and EPS, dividend and growth expectations
SAL SAT1
Aeronautical revenue 320.6 294.1
Aeronautical security recovery 43.6 43.2
Retail Revenue 162.6 142.3
Property and car rental revenue 106.6 103.2
Parking and ground transport revenue 77.1 75.4
Other revenue 3.7 3.7
7
12-Oct-17 7.2 7.31 7.18 7.3 3,768,798
11-Oct-17 7.13 7.2 7.13 7.18 4,031,687
10-Oct-17 7.12 7.19 7.115 7.14 4,207,929
9-Oct-17 7.12 7.155 7.1 7.12 3,496,682
6-Oct-17 6.98 7.065 6.96 7.05 3,465,365
5-Oct-17 6.96 6.99 6.95 6.95 3,677,799
4-Oct-17 7.02 7.08 6.955 6.97 3,705,190
3-Oct-17 7.09 7.11 7 7.02 3,583,947
2-Oct-17 7.11 7.195 7.08 7.08 3,015,701
Total 71.1 35,405,240
Average 497963.99
0.0140647
Expected market return 1.4064698
(Rm-Rf)= (1.4%-2.20%)
= -0.8%
Particulars Amount
Risk free return 2.20%
Beta 0.65
(Rm-Rf) (1.4%-2.20%)
=0.8%
Cost of equity Rf+ Beta*(Rm-Rf)
= 2.20%+0.65*(1.4%-2.20%)
= 2.20%+0.65*-0.8%
= 2.20%+ (-0.52)
= 1.68%
Evaluate and discuss firm’s revenue, earnings, and EPS, dividend and growth expectations
SAL SAT1
Aeronautical revenue 320.6 294.1
Aeronautical security recovery 43.6 43.2
Retail Revenue 162.6 142.3
Property and car rental revenue 106.6 103.2
Parking and ground transport revenue 77.1 75.4
Other revenue 3.7 3.7
7
⊘ This is a preview!⊘
Do you want full access?
Subscribe today to unlock all pages.
Trusted by 1+ million students worldwide
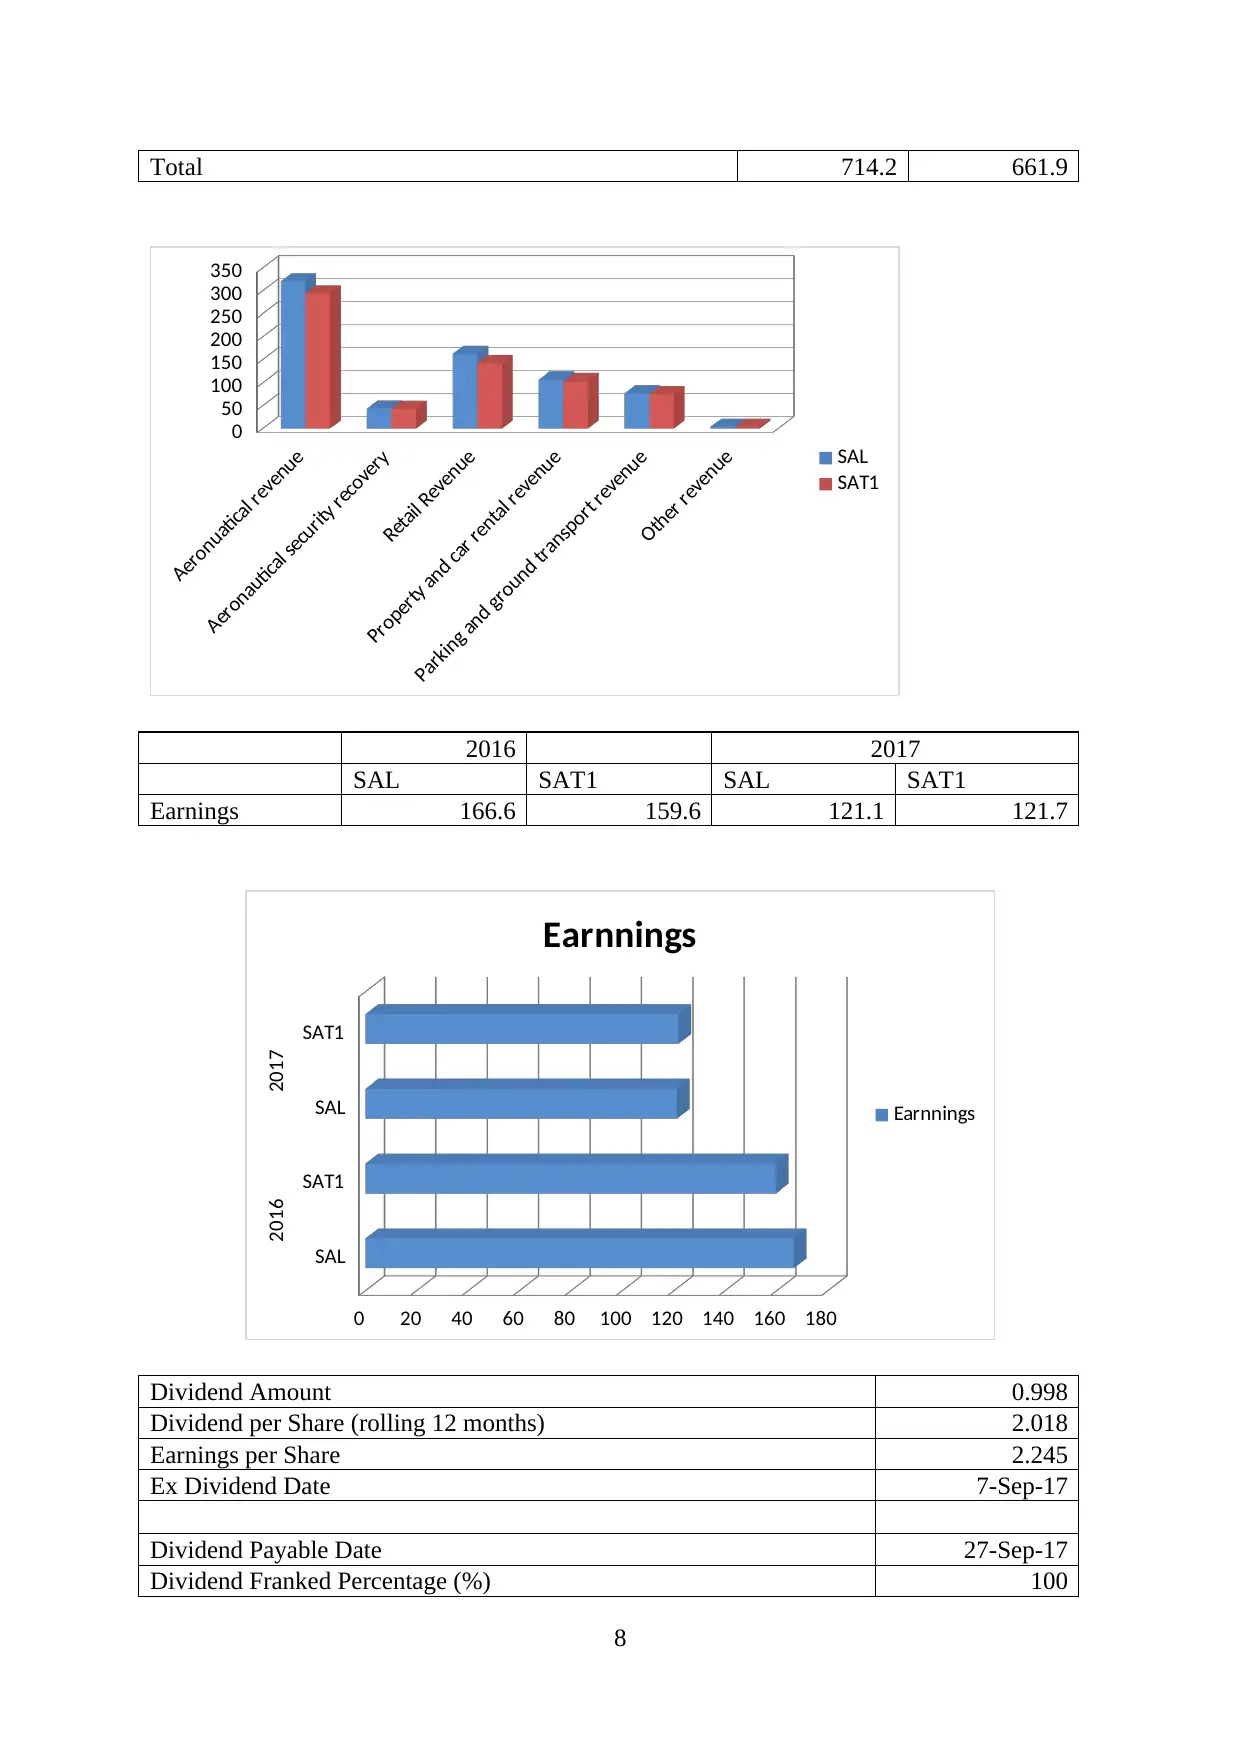
Total 714.2 661.9
Aeronuatical revenue
Aeronautical security recovery
Retail Revenue
Property and car rental revenue
Parking and ground transport revenue
Other revenue
0
50
100
150
200
250
300
350
SAL
SAT1
2016 2017
SAL SAT1 SAL SAT1
Earnings 166.6 159.6 121.1 121.7
SAL
SAT1
SAL
SAT1
2016 2017
0 20 40 60 80 100 120 140 160 180
Earnnings
Earnnings
Dividend Amount 0.998
Dividend per Share (rolling 12 months) 2.018
Earnings per Share 2.245
Ex Dividend Date 7-Sep-17
Dividend Payable Date 27-Sep-17
Dividend Franked Percentage (%) 100
8
Paraphrase This Document
Need a fresh take? Get an instant paraphrase of this document with our AI Paraphraser
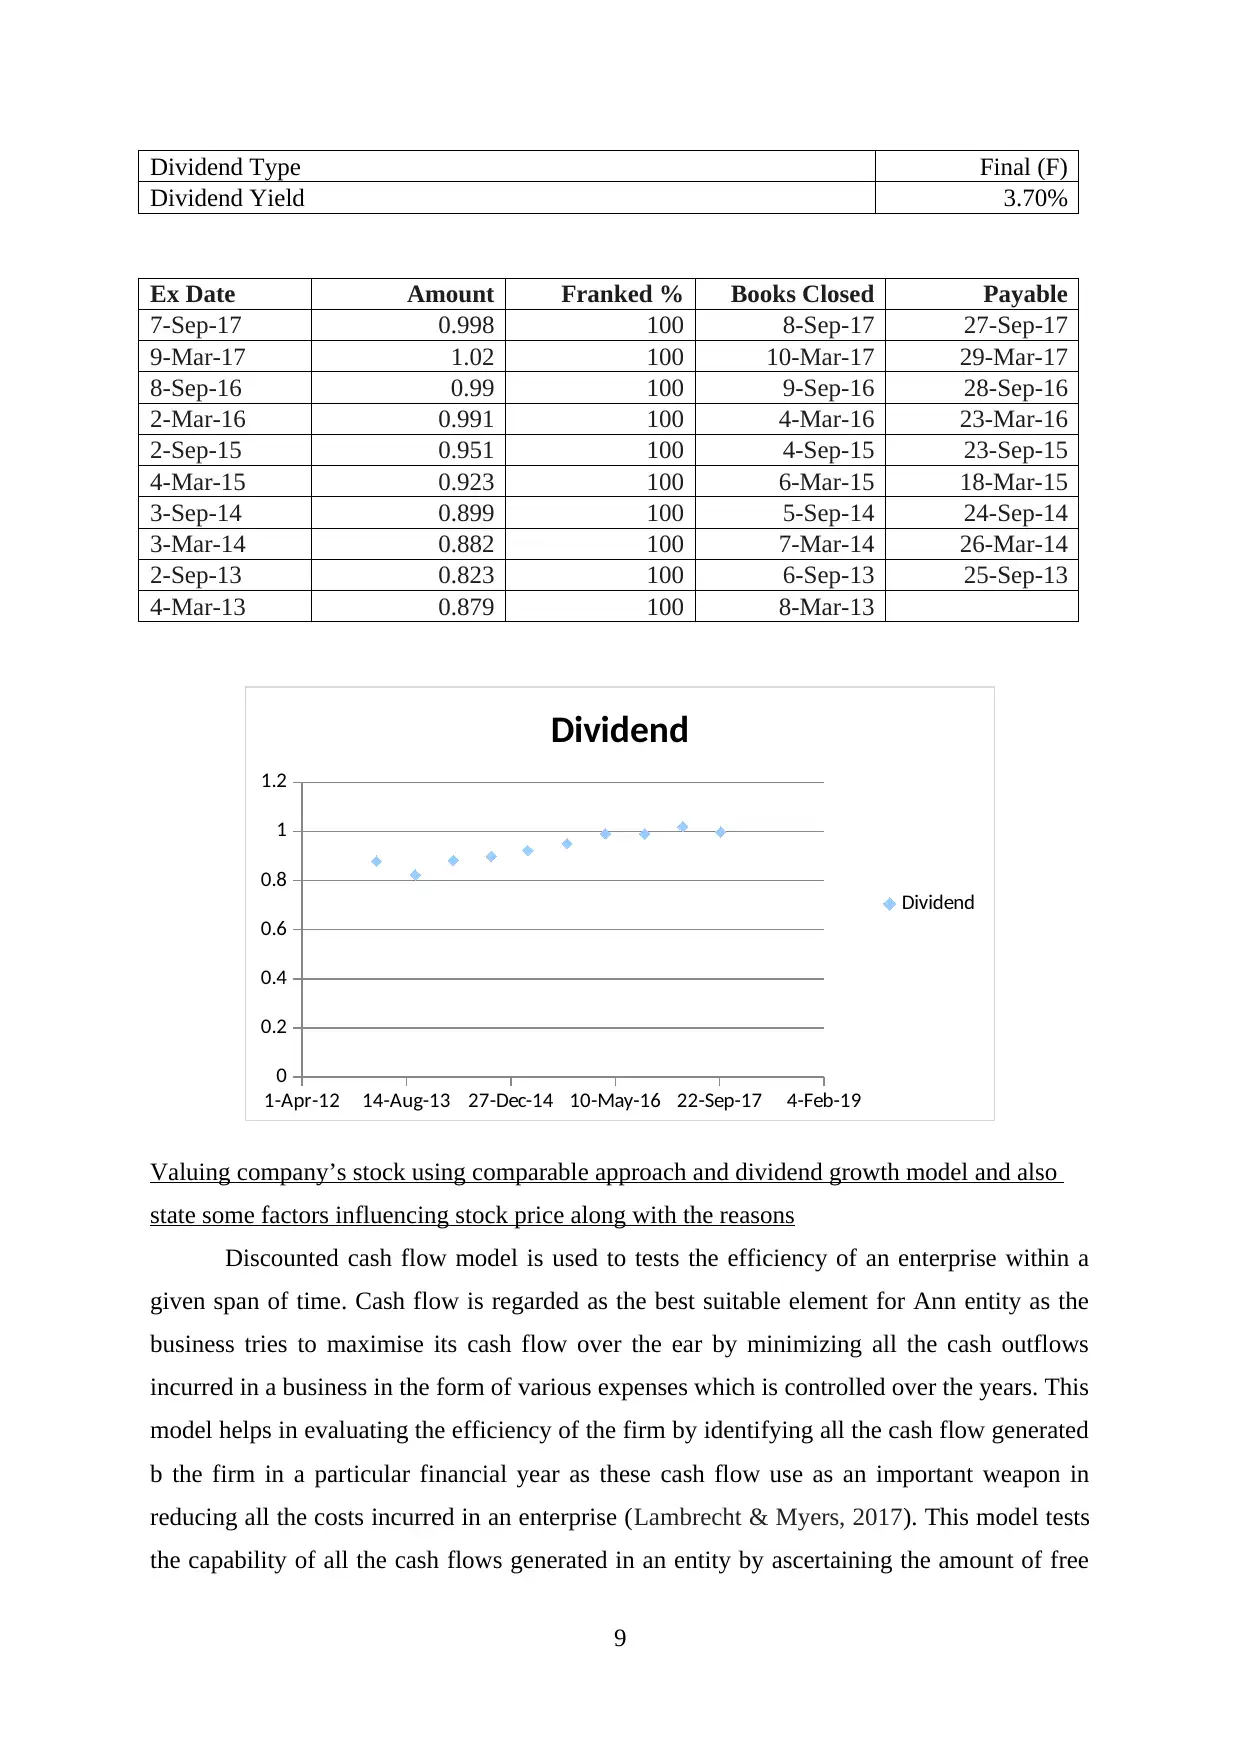
Dividend Type Final (F)
Dividend Yield 3.70%
Ex Date Amount Franked % Books Closed Payable
7-Sep-17 0.998 100 8-Sep-17 27-Sep-17
9-Mar-17 1.02 100 10-Mar-17 29-Mar-17
8-Sep-16 0.99 100 9-Sep-16 28-Sep-16
2-Mar-16 0.991 100 4-Mar-16 23-Mar-16
2-Sep-15 0.951 100 4-Sep-15 23-Sep-15
4-Mar-15 0.923 100 6-Mar-15 18-Mar-15
3-Sep-14 0.899 100 5-Sep-14 24-Sep-14
3-Mar-14 0.882 100 7-Mar-14 26-Mar-14
2-Sep-13 0.823 100 6-Sep-13 25-Sep-13
4-Mar-13 0.879 100 8-Mar-13
1-Apr-12 14-Aug-13 27-Dec-14 10-May-16 22-Sep-17 4-Feb-19
0
0.2
0.4
0.6
0.8
1
1.2
Dividend
Dividend
Valuing company’s stock using comparable approach and dividend growth model and also
state some factors influencing stock price along with the reasons
Discounted cash flow model is used to tests the efficiency of an enterprise within a
given span of time. Cash flow is regarded as the best suitable element for Ann entity as the
business tries to maximise its cash flow over the ear by minimizing all the cash outflows
incurred in a business in the form of various expenses which is controlled over the years. This
model helps in evaluating the efficiency of the firm by identifying all the cash flow generated
b the firm in a particular financial year as these cash flow use as an important weapon in
reducing all the costs incurred in an enterprise (Lambrecht & Myers, 2017). This model tests
the capability of all the cash flows generated in an entity by ascertaining the amount of free
9
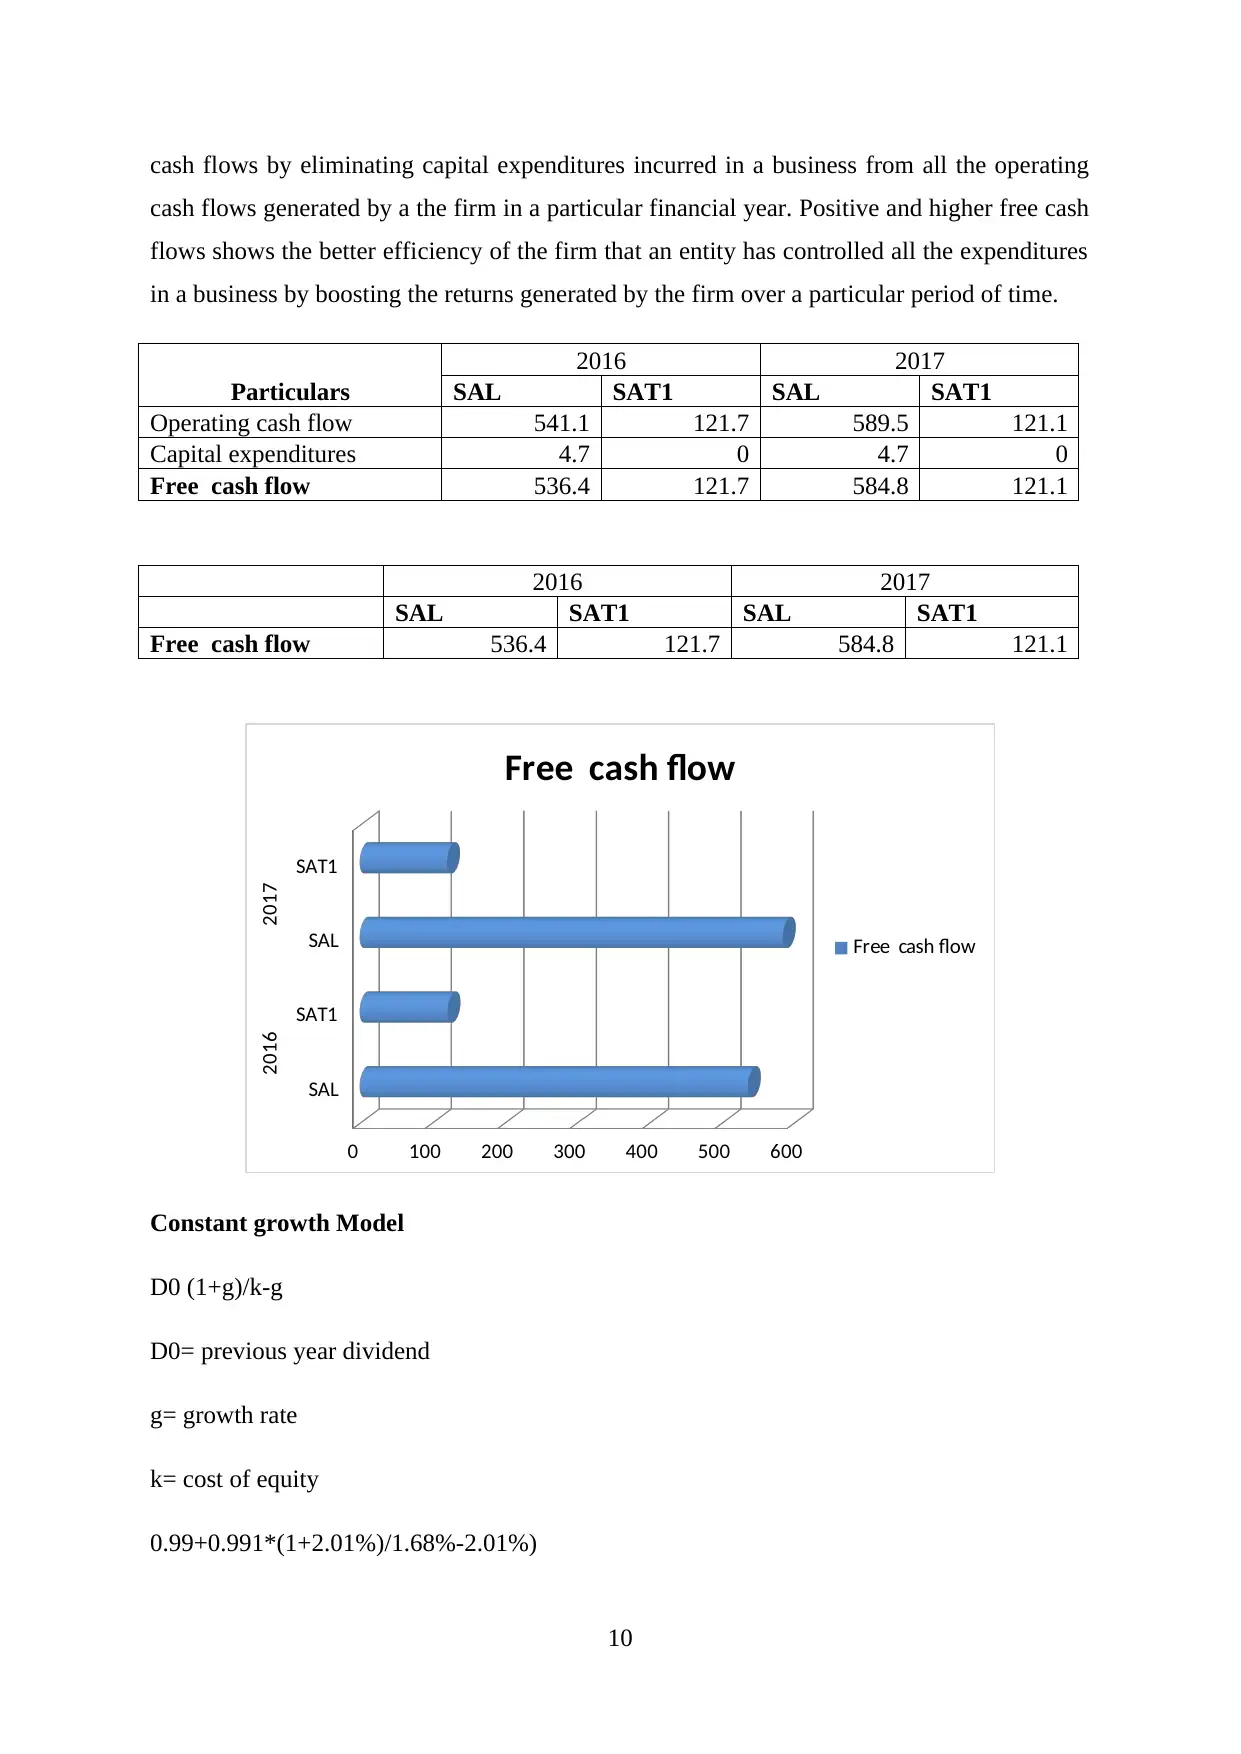
cash flows by eliminating capital expenditures incurred in a business from all the operating
cash flows generated by a the firm in a particular financial year. Positive and higher free cash
flows shows the better efficiency of the firm that an entity has controlled all the expenditures
in a business by boosting the returns generated by the firm over a particular period of time.
Particulars
2016 2017
SAL SAT1 SAL SAT1
Operating cash flow 541.1 121.7 589.5 121.1
Capital expenditures 4.7 0 4.7 0
Free cash flow 536.4 121.7 584.8 121.1
2016 2017
SAL SAT1 SAL SAT1
Free cash flow 536.4 121.7 584.8 121.1
SAL
SAT1
SAL
SAT1
2016 2017
0 100 200 300 400 500 600
Free cash flow
Free cash flow
Constant growth Model
D0 (1+g)/k-g
D0= previous year dividend
g= growth rate
k= cost of equity
0.99+0.991*(1+2.01%)/1.68%-2.01%)
10
⊘ This is a preview!⊘
Do you want full access?
Subscribe today to unlock all pages.
Trusted by 1+ million students worldwide
1 out of 18
Related Documents


Your All-in-One AI-Powered Toolkit for Academic Success.
+13062052269
info@desklib.com
Available 24*7 on WhatsApp / Email
![[object Object]](/_next/static/media/star-bottom.7253800d.svg)
Unlock your academic potential
Copyright © 2020–2026 A2Z Services. All Rights Reserved. Developed and managed by ZUCOL.