University Inventory Management and ABC Analysis Report, Semester 2

Verified

Added on  2021/04/21

|8
|1543
|148
Report
AI Summary
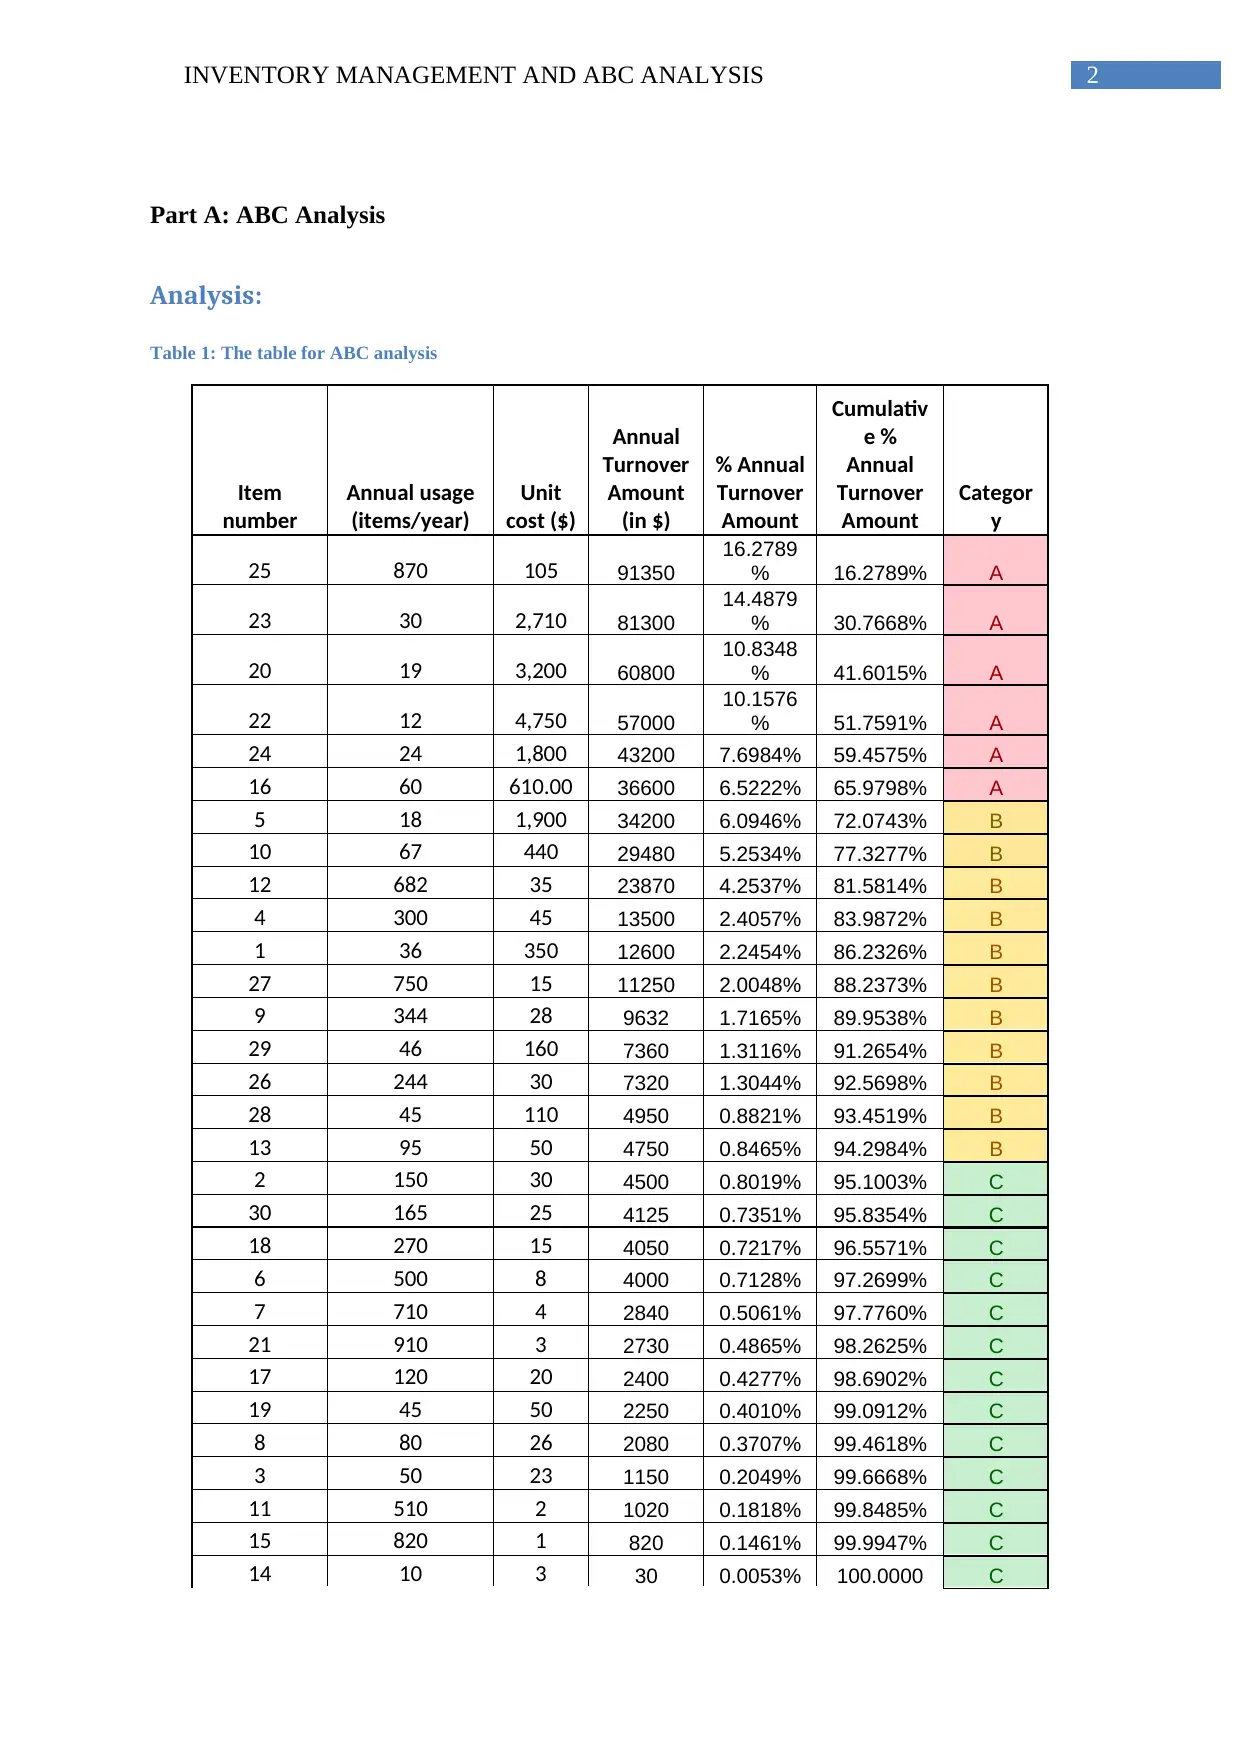
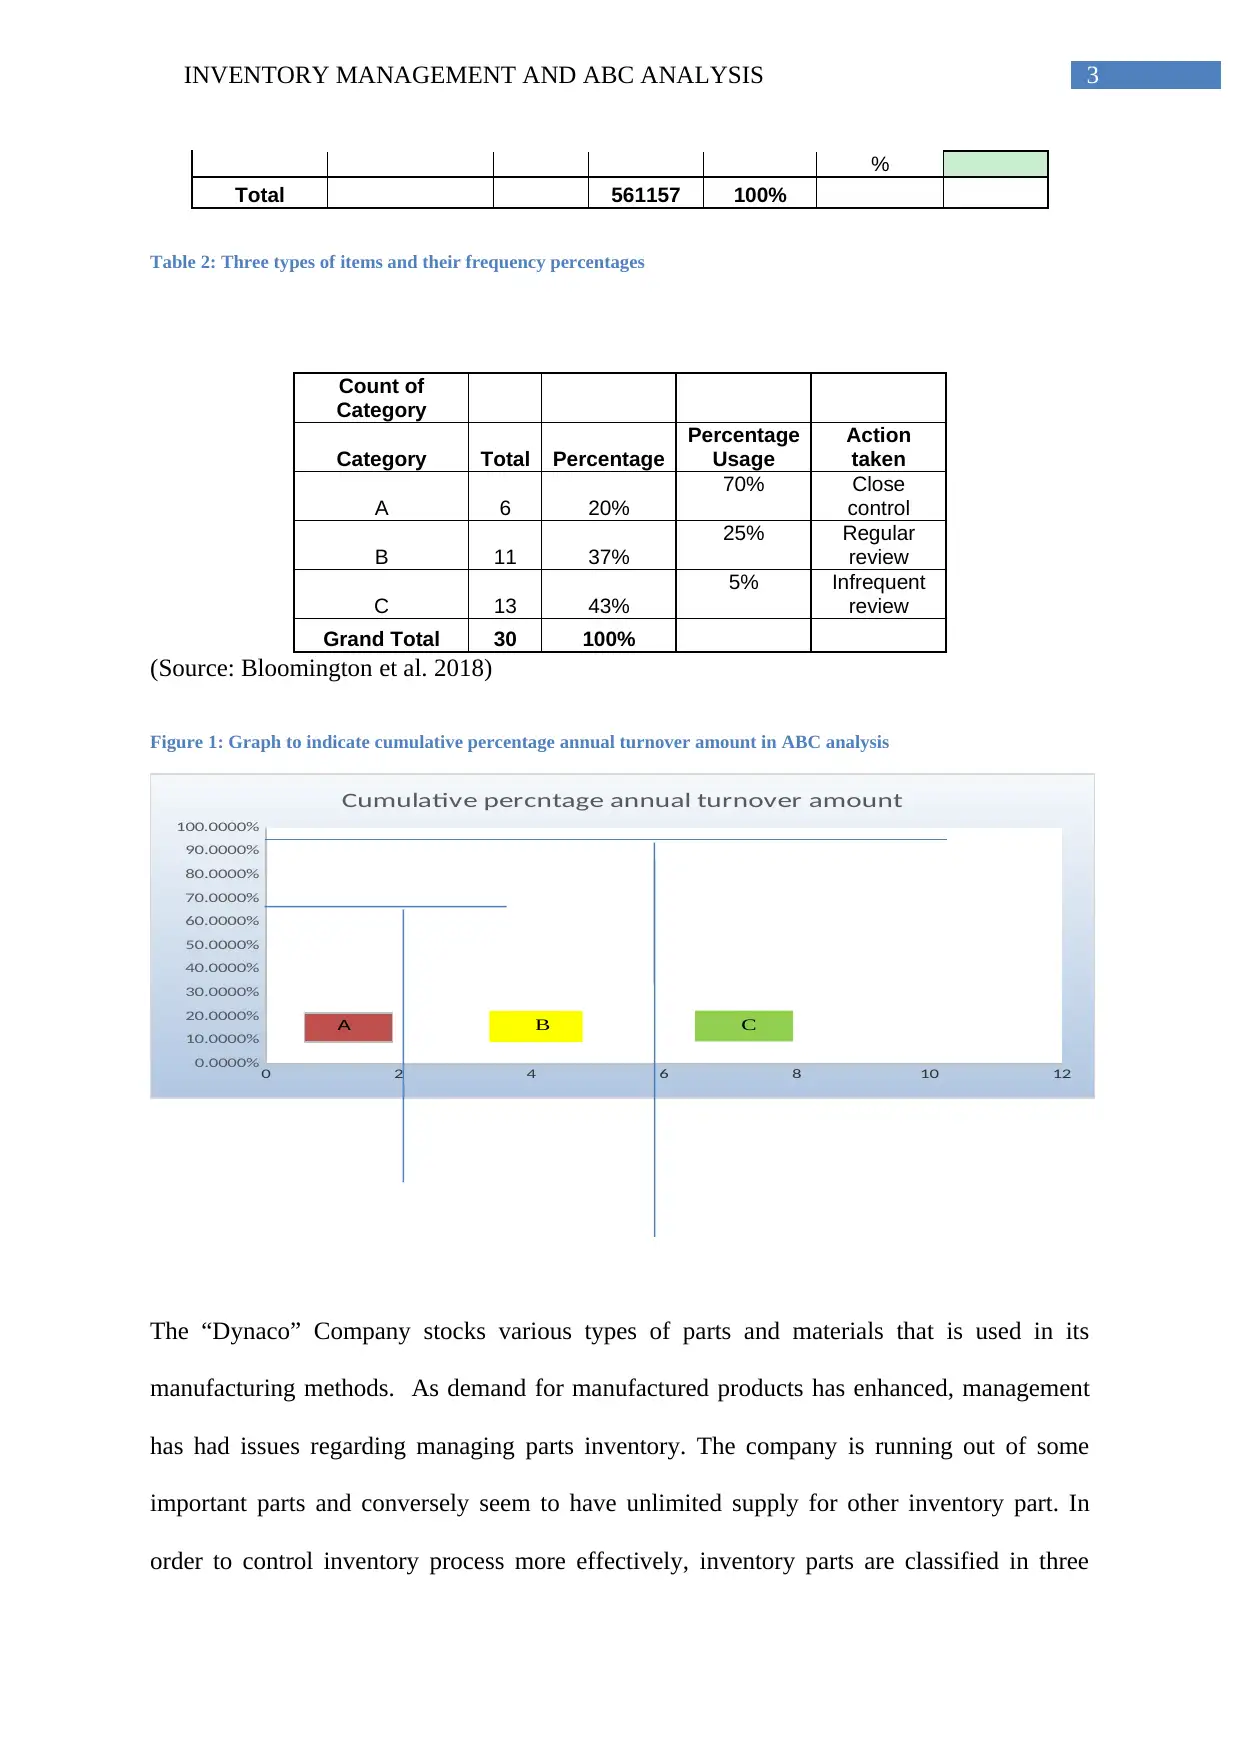
This report provides a comprehensive analysis of inventory management, focusing on ABC analysis and its application within a manufacturing context. Part A of the report delves into the classification of inventory items based on their annual turnover amount, categorizing them into A, B, and C groups. The analysis includes a detailed table illustrating item numbers, annual usage, unit costs, and the resulting annual turnover amounts, along with their cumulative percentages. Recommendations are provided for each category, emphasizing close control for A items, regular review for B items, and infrequent review for C items. Part B shifts the focus to the supply network, using Amcor Limited as a case study. It examines the company's product supply chain, from raw material procurement to customer delivery, highlighting the relationships between suppliers and customers. The report identifies key challenges related to globalization and technological compatibility and suggests improvements, such as maintaining an agile supply chain to adapt to market changes and fluctuating demand. References to academic sources and industry publications support the analysis and recommendations.
Document Page
Running head: INVENTORY MANAGEMENT AND ABC ANALYSIS
Inventory Management and ABC analysis
Name of the Student:
Name of the University:
Author’s Note:
tabler-icon-diamond-filled.svg

Paraphrase This Document

Need a fresh take? Get an instant paraphrase of this document with our AI Paraphraser
Document Page
1INVENTORY MANAGEMENT AND ABC ANALYSIS
Table of Contents
Part A: ABC Analysis................................................................................................................2
Analysis:.................................................................................................................................2
Recommendation:..................................................................................................................4
Part B: Supply Network.............................................................................................................4
Introduction............................................................................................................................4
Company overview, product overview, major competitors...................................................4
Stages of the product supply chain.........................................................................................5
The relationship between suppliers and customers................................................................5
Problems and suggestions for further improvements.............................................................5
Conclusion..............................................................................................................................6
References:.................................................................................................................................7
Document Page
2INVENTORY MANAGEMENT AND ABC ANALYSIS
Part A: ABC Analysis
Analysis:
Table 1: The table for ABC analysis
Item
number
Annual usage
(items/year)
Unit
cost ($)
Annual
Turnover
Amount
(in $)
% Annual
Turnover
Amount
Cumulativ
e %
Annual
Turnover
Amount
Categor
y
25 870 105 91350
16.2789
% 16.2789% A
23 30 2,710 81300
14.4879
% 30.7668% A
20 19 3,200 60800
10.8348
% 41.6015% A
22 12 4,750 57000
10.1576
% 51.7591% A
24 24 1,800 43200 7.6984% 59.4575% A
16 60 610.00 36600 6.5222% 65.9798% A
5 18 1,900 34200 6.0946% 72.0743% B
10 67 440 29480 5.2534% 77.3277% B
12 682 35 23870 4.2537% 81.5814% B
4 300 45 13500 2.4057% 83.9872% B
1 36 350 12600 2.2454% 86.2326% B
27 750 15 11250 2.0048% 88.2373% B
9 344 28 9632 1.7165% 89.9538% B
29 46 160 7360 1.3116% 91.2654% B
26 244 30 7320 1.3044% 92.5698% B
28 45 110 4950 0.8821% 93.4519% B
13 95 50 4750 0.8465% 94.2984% B
2 150 30 4500 0.8019% 95.1003% C
30 165 25 4125 0.7351% 95.8354% C
18 270 15 4050 0.7217% 96.5571% C
6 500 8 4000 0.7128% 97.2699% C
7 710 4 2840 0.5061% 97.7760% C
21 910 3 2730 0.4865% 98.2625% C
17 120 20 2400 0.4277% 98.6902% C
19 45 50 2250 0.4010% 99.0912% C
8 80 26 2080 0.3707% 99.4618% C
3 50 23 1150 0.2049% 99.6668% C
11 510 2 1020 0.1818% 99.8485% C
15 820 1 820 0.1461% 99.9947% C
14 10 3 30 0.0053% 100.0000 C
Document Page
3INVENTORY MANAGEMENT AND ABC ANALYSIS
%
Total 561157 100%
Table 2: Three types of items and their frequency percentages
Count of
Category
Category Total Percentage
Percentage
Usage
Action
taken
A 6 20%
70% Close
control
B 11 37%
25% Regular
review
C 13 43%
5% Infrequent
review
Grand Total 30 100%
(Source: Bloomington et al. 2018)
Figure 1: Graph to indicate cumulative percentage annual turnover amount in ABC analysis
0 2 4 6 8 10 12
0.0000%
10.0000%
20.0000%
30.0000%
40.0000%
50.0000%
60.0000%
70.0000%
80.0000%
90.0000%
100.0000%
Cumulative percntage annual turnover amount
CBA
The “Dynaco” Company stocks various types of parts and materials that is used in its
manufacturing methods. As demand for manufactured products has enhanced, management
has had issues regarding managing parts inventory. The company is running out of some
important parts and conversely seem to have unlimited supply for other inventory part. In
order to control inventory process more effectively, inventory parts are classified in three
tabler-icon-diamond-filled.svg

Paraphrase This Document

Need a fresh take? Get an instant paraphrase of this document with our AI Paraphraser
Document Page
4INVENTORY MANAGEMENT AND ABC ANALYSIS
groups (“A”, “B” and “C”) in the previous table. The inventory items are grouped in ABC
approach according to the yearly annual turnover amount.
Recommendation:
It could be recommended that “A” items which accounts 70% of the annual consumption
should be reduced by their annual usage amount. The items should have close control. “B”
items that accounts 25% of the annual consumption values should be maintained accordingly.
These need regular review. The “C” items that accounts 5% of the annual consumption value
of the items should be increased by their annual usage amount. The items should have
infrequent review.
Avoiding “A” items is a priority (Source: Lokad.com. 2018). “C” items present both low
demand and higher risk of extra inventory costs (Ng 2007).
Part B: Supply Network
Introduction
The study has explained the supply chain of Amcor Limited based on the stages
involved in product supply for procurement of raw materials till it reaches the customer. The
important form of the processes of Amcor has been explained in terms of the recent purchase
of the raw materials considered for packaging. The study has illustrated the relationship of
“suppliers, customers and the level of inventory” where it is held.
Document Page
5INVENTORY MANAGEMENT AND ABC ANALYSIS
Company overview, product overview, major competitors
Amcor mainly specialises in producing high quality packaging products related to
“food, beverage, pharmaceutical, medical-device, home and personal-care and other
products”. The main produce of the company is depicted in terms of manufacturing of
packaging material. The main competitors of Amcor are discerned with “Georgia-Pacific
LLC and Silgan Holdings Inc” (Amcor.com. 2018).
Stages of the product supply chain
As discussed by Monczka et al. (2015), the initial application of the supply chain
model is depicted in terms of applying appropriate operations strategy. The sourcing of the
components and raw materials are seen with setting the best possible price in the “right
quality and at the right time”. The next stage is includes scheduling the “production activities,
testing of the products, packing and release”. Amcor has been able to manage the rules for the
performance, storage of data and maintenance of the regulatory compliance. This stage is
followed by the delivery process to the customers and making the necessary enquiries for the
selection and distribution strategies. The next stage is involves recognizing the product
condition and sanctioning of the returns. In addition to this, some of the other considerations
for the study are included with replacing defective items and making provision for refunds.
The relationship between suppliers and customers
The relationship between the supplier and customer is considered with “product
quality, services, handling and making complaints”. The main aspect of the customer is taken
with sharing of information, flexibility and making timely payments. The customer and
supplier relation are observed with significant importance in the quality management across
the organizations that are to be maintained as per the level of supply chain. In addition to this,
Document Page
6INVENTORY MANAGEMENT AND ABC ANALYSIS
the inventory level is considered with the inventory planning stage of supply chain (Sorbi et
al. 2017).
Problems and suggestions for further improvements
The key issue for Amcor supply chain is inferred with the globalization aspect. The
main form of the issues requires to be understood with reducing the cost in the supply chain
and minimizing the cost of raw materials, taxes and labour costs. The change in the market
environment along with the compatibility with the technology is seen as another important
challenge. The resolution for these issues needs to be addressed with maintaining an agile
supply chain which should be considered as per the production needs and changes in demand
(Hugos 2018).
Conclusion
The main assertions in the stages of the supply chain is explained in an efficient
manner which has been able to state on the information needed for planning of the material
requirement. Some of the other considerations made in the report is related to other aspects
such as scheduling, delivery and making provisions for the returns.
tabler-icon-diamond-filled.svg

Paraphrase This Document

Need a fresh take? Get an instant paraphrase of this document with our AI Paraphraser
Document Page
7INVENTORY MANAGEMENT AND ABC ANALYSIS
References:
Amcor.com. (2018). Amcor - Investor Relations - financial information and ASX
announcements . [online] Available at: https://www.amcor.com/investor-relations/about-us
[Accessed 20 Mar. 2018].
Bloomington, I., Bloomington, I., Bloomington, I. and University, I. (2018). Observing
Behavior Using A-B-C Data. [online] Iidc.indiana.edu. Available at:
https://www.iidc.indiana.edu/pages/Observing-Behavior-Using-A-B-C-Data [Accessed 20
Mar. 2018].
Hugos, M.H., 2018. Essentials of supply chain management. John Wiley & Sons.
Lokad.com. (2018). ABC analysis (Inventory) Definition - Inventory Optimization Software -
Lokad. [online] Available at: https://www.lokad.com/abc-analysis-(inventory)-definition
[Accessed 20 Mar. 2018].
Monczka, R.M., Handfield, R.B., Giunipero, L.C. and Patterson, J.L., 2015. Purchasing and
supply chain management. Cengage Learning.
Ng, W.L., 2007. A simple classifier for multiple criteria ABC analysis. European Journal of
Operational Research, 177(1), pp.344-353.
Sorbi, S., Zorrieh, S., Jalilian, I. and Sani, M.M.S., 2017. THE ROLE OF MANAGEMENT
IN THE EVOLUTION OF THE COMPANY'S SUPPLY CHAIN. European Journal of
Management and Marketing Studies
chevron_up_icon
1 out of 8
circle_padding
hide_on_mobile
zoom_out_icon
[object Object]