Fundamentals of Inventory Management: A Detailed Overview
VerifiedAdded on 2019/09/30
|26
|11025
|134
Report
AI Summary
This report provides a comprehensive overview of inventory management, beginning with a definition of inventory and the reasons for maintaining it, such as meeting demand, keeping operations running, managing lead times, hedging against price increases, and taking advantage of quantity discounts. It then delves into inventory control methods, including the ABC approach and cycle counting, which help firms manage large numbers of inventory items efficiently. The report also addresses the critical aspect of balancing inventory levels with costs, detailing the three main types of costs: holding costs, set-up costs, and purchasing costs. Holding costs include storage, personnel, taxes, and obsolescence, while set-up costs involve preparing machines for production or order costs for purchased items. Purchasing costs are simply the cost of the items themselves. By understanding these costs and applying effective control methods, firms can optimize their inventory management strategies to minimize expenses and ensure adequate supply.
Inventory Management
Inventory management, or inventory control, is an attempt to balance inventory needs and
requirements with the need to minimize costs resulting from obtaining and holding inventory.
There are several schools of thought that view inventory and its function differently. These will
be addressed later, but first we present a foundation to facilitate the reader's understanding of
inventory and its function.
WHAT IS INVENTORY?
Inventory is a quantity or store of goods that is held for some purpose or use (the term may also
be used as a verb, meaning to take inventory or to count all goods held in inventory). Inventory
may be kept “in-house,” meaning on the premises or nearby for immediate use; or it may be held
in a distant warehouse or distribution center for future use. With the exception of firms utilizing
just-in-time methods, the term “inventory” typically implies a stored quantity of goods that
exceeds what is needed for the firm to function at the current time (e.g., within the next few
hours).
WHY KEEP INVENTORY?
Why would a firm hold more inventory than is currently necessary to ensure the firm's
operation? The following is a list of reasons for maintaining what would appear to be “excess”
inventory.
Meet Demand. In order for a retailer to stay in business, it must have the products that the
customer wants on hand when the customer wants them. If not, the retailer will have to back-
order the product. If the customer can get the good from some other source, he or she may
choose to do so rather than electing to allow the original retailer to meet demand later (through
back-order). Hence, in many instances, if a good is not in inventory, a sale is lost forever.
Keep Operations Running. A manufacturer must have certain purchased items (raw materials,
components, or subassemblies) in order to manufacture its product. Running out of only one item
can prevent a manufacturer from completing the production of its finished goods.
Inventory between successive dependent operations also serves to decouple the dependency of
the operations. A machine or workcenter is often dependent upon the previous operation to
provide it with parts to work on. If work ceases at a workcenter, then all subsequent centers will
shut down for lack of work. If a supply of work-in-process inventory is kept between each
ASCM 629 - Week 5 Page 1
Paraphrase This Document
Need a fresh take? Get an instant paraphrase of this document with our AI Paraphraser
workcenter, then each machine can maintain its operations for a limited time, hopefully until
operations resume at the original center.
Lead Time. Lead time is the time that elapses between the placing of an order (either a purchase
order or a production order issued to the shop or the factory floor) and actually receiving the
goods ordered.
If a supplier (an external firm or an internal department or plant) cannot supply the required
goods on demand, then the client firm must keep an inventory of the needed goods. The longer
the lead time, the larger the quantity of goods the firm must carry in inventory.
A just-in-time (JIT) manufacturing firm, such as Nissan in Smyrna, Tennessee, can maintain
extremely low levels of inventory. Nissan takes delivery on truck seats as many as 18 times per
day. However, steel mills may have a lead time of up to three months. That means that a firm
that uses steel produced at the mill must place orders at least three months in advance of their
need. In order to keep their operations running in the meantime, an on-hand inventory of three
months' steel requirements would be necessary.
Hedge. Inventory can also be used as a hedge against price increases and inflation. Salesmen
routinely call purchasing agents shortly before a price increase goes into effect. This gives the
buyer a chance to purchase material, in excess of current need, at a price that is lower than it
would be if the buyer waited until after the price increase occurs.
Quantity Discount. Often firms are given a price discount when purchasing large quantities of a
good. This also frequently results in inventory in excess of what is currently needed to meet
demand. However, if the discount is sufficient to offset the extra holding cost incurred as a result
of the excess inventory, the decision to buy the large quantity is justified.
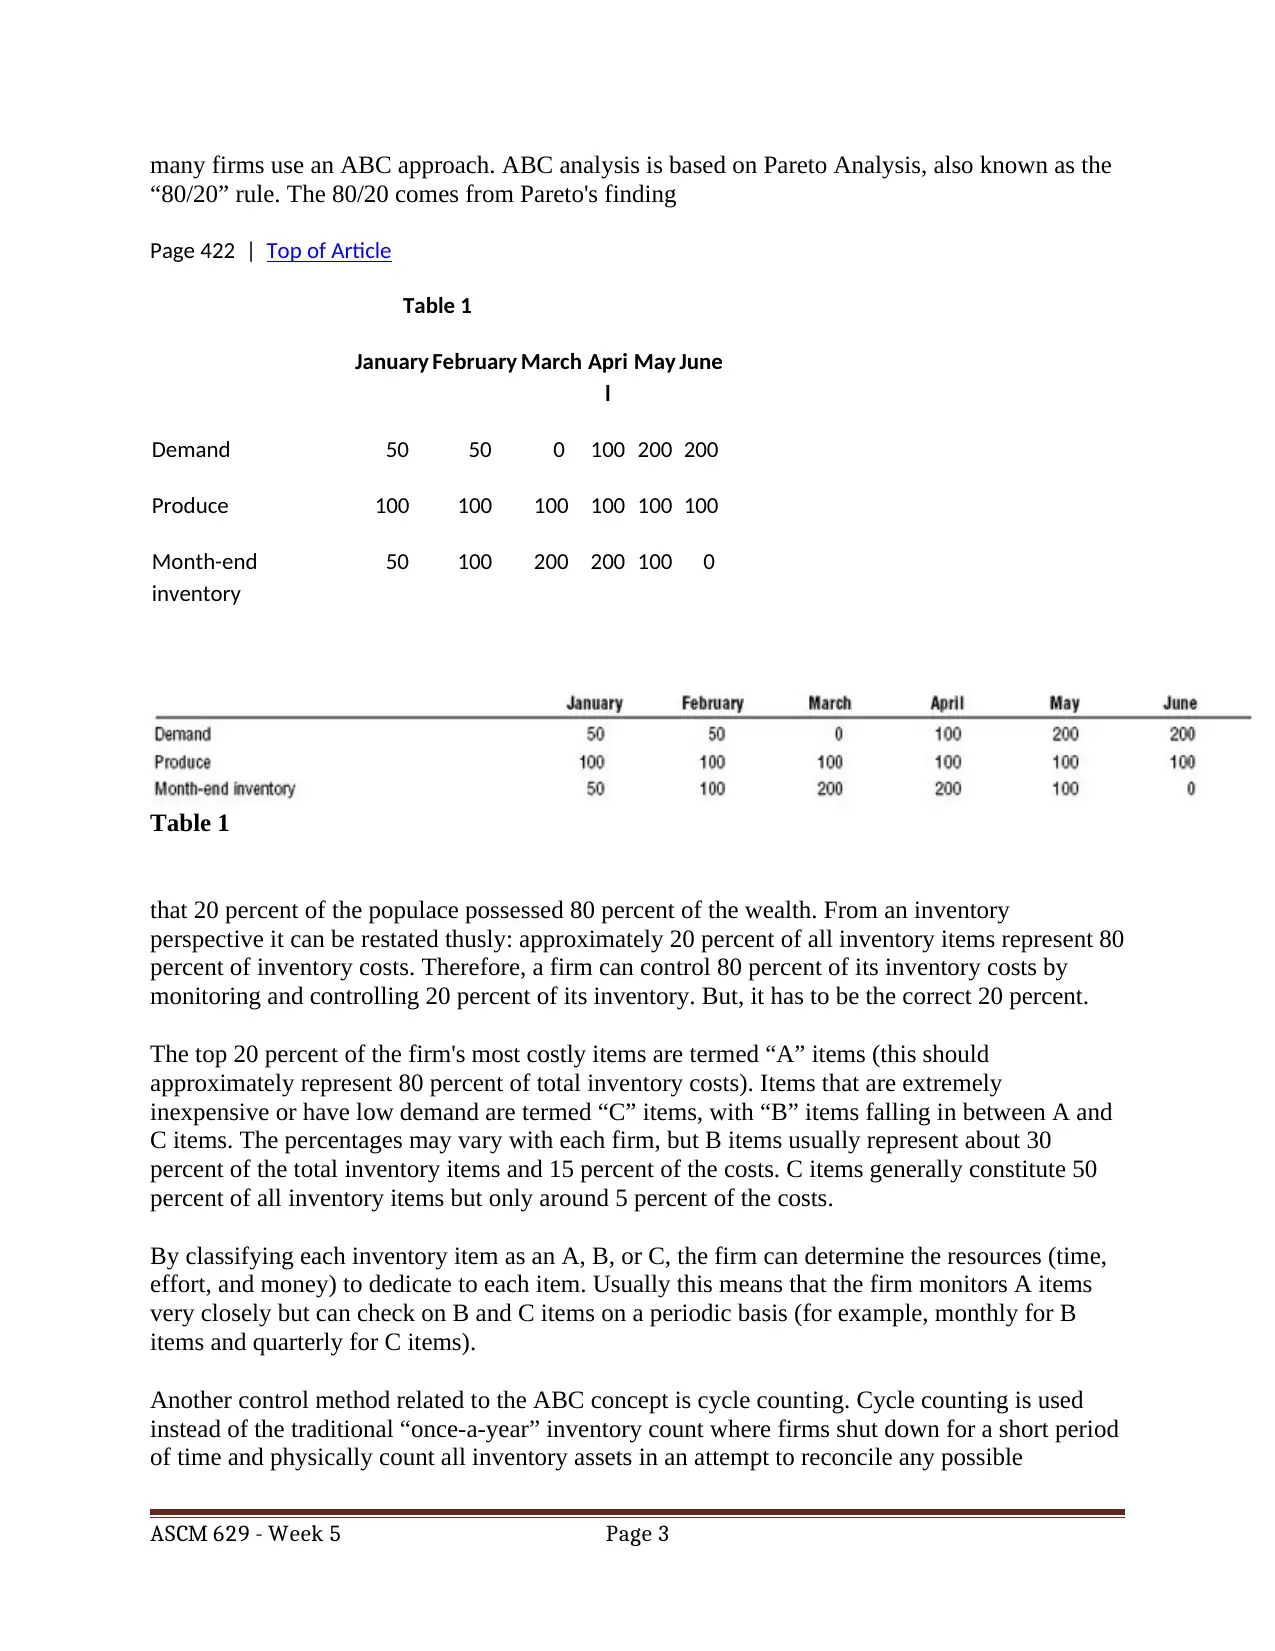
Smoothing Requirements. Sometimes inventory is used to smooth demand requirements in a
market where demand is somewhat erratic. Consider the demand forecast and production
schedule outlined in Table 1.
Notice how the use of inventory has allowed the firm to maintain a steady rate of output (thus
avoiding the cost of hiring and training new personnel), while building up inventory in
anticipation of an increase in demand. In fact, this is often called anticipation inventory. In
essence, the use of inventory has allowed the firm to move demand requirements to earlier
periods, thus smoothing the demand.
CONTROLLING INVENTORY
Firms that carry hundreds or even thousands of different part numbers can be faced with the
impossible task of monitoring the inventory levels of each part number. In order to facilitate this,
ASCM 629 - Week 5 Page 2
operations resume at the original center.
Lead Time. Lead time is the time that elapses between the placing of an order (either a purchase
order or a production order issued to the shop or the factory floor) and actually receiving the
goods ordered.
If a supplier (an external firm or an internal department or plant) cannot supply the required
goods on demand, then the client firm must keep an inventory of the needed goods. The longer
the lead time, the larger the quantity of goods the firm must carry in inventory.
A just-in-time (JIT) manufacturing firm, such as Nissan in Smyrna, Tennessee, can maintain
extremely low levels of inventory. Nissan takes delivery on truck seats as many as 18 times per
day. However, steel mills may have a lead time of up to three months. That means that a firm
that uses steel produced at the mill must place orders at least three months in advance of their
need. In order to keep their operations running in the meantime, an on-hand inventory of three
months' steel requirements would be necessary.
Hedge. Inventory can also be used as a hedge against price increases and inflation. Salesmen
routinely call purchasing agents shortly before a price increase goes into effect. This gives the
buyer a chance to purchase material, in excess of current need, at a price that is lower than it
would be if the buyer waited until after the price increase occurs.
Quantity Discount. Often firms are given a price discount when purchasing large quantities of a
good. This also frequently results in inventory in excess of what is currently needed to meet
demand. However, if the discount is sufficient to offset the extra holding cost incurred as a result
of the excess inventory, the decision to buy the large quantity is justified.
Smoothing Requirements. Sometimes inventory is used to smooth demand requirements in a
market where demand is somewhat erratic. Consider the demand forecast and production
schedule outlined in Table 1.
Notice how the use of inventory has allowed the firm to maintain a steady rate of output (thus
avoiding the cost of hiring and training new personnel), while building up inventory in
anticipation of an increase in demand. In fact, this is often called anticipation inventory. In
essence, the use of inventory has allowed the firm to move demand requirements to earlier
periods, thus smoothing the demand.
CONTROLLING INVENTORY
Firms that carry hundreds or even thousands of different part numbers can be faced with the
impossible task of monitoring the inventory levels of each part number. In order to facilitate this,
ASCM 629 - Week 5 Page 2
many firms use an ABC approach. ABC analysis is based on Pareto Analysis, also known as the
“80/20” rule. The 80/20 comes from Pareto's finding
Page 422 | Top of Article
Table 1
January February March Apri
l
May June
Demand 50 50 0 100 200 200
Produce 100 100 100 100 100 100
Month-end
inventory
50 100 200 200 100 0
Table 1
that 20 percent of the populace possessed 80 percent of the wealth. From an inventory
perspective it can be restated thusly: approximately 20 percent of all inventory items represent 80
percent of inventory costs. Therefore, a firm can control 80 percent of its inventory costs by
monitoring and controlling 20 percent of its inventory. But, it has to be the correct 20 percent.
The top 20 percent of the firm's most costly items are termed “A” items (this should
approximately represent 80 percent of total inventory costs). Items that are extremely
inexpensive or have low demand are termed “C” items, with “B” items falling in between A and
C items. The percentages may vary with each firm, but B items usually represent about 30
percent of the total inventory items and 15 percent of the costs. C items generally constitute 50
percent of all inventory items but only around 5 percent of the costs.
By classifying each inventory item as an A, B, or C, the firm can determine the resources (time,
effort, and money) to dedicate to each item. Usually this means that the firm monitors A items
very closely but can check on B and C items on a periodic basis (for example, monthly for B
items and quarterly for C items).
Another control method related to the ABC concept is cycle counting. Cycle counting is used
instead of the traditional “once-a-year” inventory count where firms shut down for a short period
of time and physically count all inventory assets in an attempt to reconcile any possible
ASCM 629 - Week 5 Page 3
⊘ This is a preview!⊘
Do you want full access?
Subscribe today to unlock all pages.
Trusted by 1+ million students worldwide
discrepancies in their inventory records. When cycle counting is used the firm is continually
taking a physical count but not of total inventory.
A firm may physically count a certain section of the plant or warehouse, moving on to other
sections upon completion, until the entire facility is counted. Then the process starts all over
again.
The firm may also choose to count all the A items, then the B items, and finally the C items.
Certainly, the counting frequency will vary with the classification of each item. In other words,
A items may be counted monthly, B items quarterly, and C items yearly. In addition, the required
accuracy of inventory records may vary according to classification, with A items requiring the
most accurate record keeping.
BALANCING INVENTORYAND COSTS
As stated earlier, inventory management is an attempt to maintain an adequate supply of goods
while minimizing inventory costs. We saw a variety of reasons companies hold inventory and
these reasons dictate what is deemed to be an adequate supply of inventory. Now, how do we
balance this supply with its costs? First let's look at what kind of costs we are talking about.
There are three types of costs that together constitute total inventory costs: holding costs, set-up
costs, and purchasing costs.
Holding costs. Holding costs, also called carrying costs, are the costs that result from
maintaining the inventory. Inventory in excess of current demand frequently means that its
holder must provide a place for its storage when not in use. This could range from a small
storage area near the production line to a huge warehouse or distribution center. A storage
facility requires personnel to move the inventory when needed and to keep track of what is stored
and where it is stored. If the inventory is heavy or bulky, forklifts may be necessary to move it
around.
Storage facilities also require heating, cooling, lighting, and water. The firm must pay taxes on
the inventory, and opportunity costs occur from the lost use of the funds that were spent on the
inventory. Also, obsolescence, pilferage (theft), and shrinkage are problems. All of these things
add cost to holding or carrying inventory.
If the firm can determine the cost of holding one unit of inventory for one year (H) it can
determine its annual holding cost by multiplying the cost of holding one unit by the average
inventory held for a one-year period. Average inventory can be computed by dividing the
amount of goods that are ordered every time an order is placed (Q) by two. Thus, average
inventory is expressed as Q/2. Annual holding cost, then, can be expressed as H(Q/2).
ASCM 629 - Week 5 Page 4
Paraphrase This Document
Need a fresh take? Get an instant paraphrase of this document with our AI Paraphraser
Set-up costs. Set-up costs are the costs incurred from getting a machine ready to produce the
desired good. In a manufacturing setting this would require the use of a skilled technician (a
cost) who disassembles the tooling that is currently in use on the machine. The disassembled
tooling is then taken to a tool room or tool shop for maintenance or possible repair (another cost).
The technician then takes the currently needed tooling from the tool room (where it has been
maintained; another cost) and brings it to the machine in question.
There the technician has to assemble the tooling on the machine in the manner required for the
good to be produced. (This is known as a “set-up.”) Then the technician has to calibrate the
machine and probably will run a number of parts, that will have to be scrapped (a cost), in order
to get the machine correctly calibrated and running. All the while the machine has been idle and
not producing any parts (opportunity cost). As one can see, there is considerable cost involved in
set-up.
If the firm purchases the part or raw material, then an order cost, rather than a set-up cost, is
incurred. Ordering costs include the purchasing agent's salary and travel/entertainment budget,
administrative and secretarial support, office space, copiers and office supplies, forms and
documents, long-distance telephone bills, and computer systems and support. Also, some firms
include the cost of shipping the purchased goods in the order cost.
If the firm can determine the cost of one set-up (S) or one order, it can determine its annual
setup/order cost by multiplying the cost of one set-up by the number of set-ups made or orders
placed annually. Suppose a firm has an annual demand (D) of 1,000 units. If the firm orders 100
units (Q) every time it places an order, the firm will obviously place 10 orders per year (D/Q).
Hence, annual set-up/order cost can be expressed as S(D/Q).
Purchasing cost. Purchasing cost is simply the cost of the purchased item itself. If the firm
purchases a part that goes into its finished product, the firm can determine its annual purchasing
cost by multiplying the cost of one purchased unit (P) by the number of finished products
demanded in a year (D). Hence, purchasing cost is expressed as PD.
Now total inventory cost can be expressed as:
Total = Holding cost + Set-up/Order cost + Purchasing cost
or
Total = H(Q/2) + S(D/Q) + PD
If holding costs and set-up costs were plotted as lines on a graph, the point at which they
intersect (that is, the point at which they are equal) would indicate the lowest total inventory cost.
Therefore, if we want to minimize total inventory cost, every time we place an order, we should
order the quantity (Q) that corresponds to the point where the two values are equal. If we set the
two costs equal and solve forQ we get:
H(Q/2) = S(D/Q)
ASCM 629 - Week 5 Page 5
Q = 2 DS/H
The quantity Q is known as the economic order quantity (EOQ). In order to minimize total
inventory cost, the firm will order Q every time it places an order. For example, a firm with an
annual demand of 12,000 units (at a purchase price of $25 each), annual holding cost of $10 per
unit and an order cost of $150 per order (with orders placed once a month) could save $800
annually by utilizing the EOQ. First, we determine the total costs without using the EOQ
method:
Q = $10(1000/2) + $150(12,000/1,000) + $25(12,000) = $306,800
Then we calculate EOQ:
EOQ = 2(12,000)($150)/$10 = 600
And we calculate total costs at the EOQ of 600:
Q = $10(600/2) + $150(12,000/600) + $25(12,000) = $306,000
Finally, we subtract the total cost of Q from Q to determine the savings:
$306,800 − 306,000 = $800
Notice that if you remove purchasing cost from the equation, the savings is still $800. We might
assume this means that purchasing cost is not relevant to our order decision and can be
eliminated from the equation. It must be noted that this is true only as long as no quantity
discount exists. If a quantity discount is available, the firm must determine whether the savings
of the quantity discount are sufficient to offset the loss of the savings resulting from the use of
the EOQ.
There are a number of assumptions that must be made with the use of the EOQ. These include:
Only one product is involved.
Demand is deterministic (known with certainty).
Demand is constant (stable throughout the year).
There are no quantity discounts.
Costs are constant (no price increases or inflation).
While these assumptions would seem to make EOQ irrelevant for use in a realistic situation, it is
relevant for items that have independent demand. This means that the demand for the item is not
derived from the demand for something else (usually a parent item for which the unit in question
is a component). For example, the demand for steering wheels would be derived from the
demand for automobiles (dependent demand) but the demand for purses is not derived from
anything else; purses have independent demand.
ASCM 629 - Week 5 Page 6
⊘ This is a preview!⊘
Do you want full access?
Subscribe today to unlock all pages.
Trusted by 1+ million students worldwide
OTHER LOT-SIZING TECHNIQUES
There are a number of other lot-sizing techniques available in addition to EOQ. These include
the fixed-order quantity, fixed-order-interval model, the single-period model, and part-period
balancing.
Fixed-Order-Quantity Model. EOQ is an example of the fixed-order-quantity model since the
same quantity is ordered every time an order is placed. A firm might also use a fixed-order
quantity when it is captive to packaging situations. If you were to walk into an office supply
store and ask to buy twenty-two paper clips, chances are you would walk out with one hundred
paper clips. You were captive to the packaging requirements of paper clips, i.e., they come one
hundred to a box and you cannot purchase a partial box. It works the same way for other
purchasing situations. A supplier may package their goods in certain quantities so that their
customers must buy that quantity or a multiple of that quantity.
Fixed-Order-Interval Model. The fixed-order-interval model is used when orders have to be
placed at fixed time intervals such as weekly, biweekly, or monthly. The lot size is dependent
upon how much inventory is needed from the time of order until the next order must be placed
(order cycle). This system requires periodic checks of inventory levels and is used by many retail
firms such as drug stores and small grocery stores.
Single-Period Model. The single-period model is used in ordering perishables, such as food and
flowers, and items with a limited life, such as newspapers. Unsold or unused goods are not
typically carried over from one period to another and there may even be some disposal costs
involved. This model tries to balance the cost of lost customer goodwill and opportunity cost that
is incurred from not having enough inventory, with the cost of having excess inventory left at the
end of a period.
Part-Period Balancing. Part-period balancing attempts to select the number of periods covered
by the inventory order that will make total carrying costs as close as possible to the set-up/order
cost.
When a proper lot size has been determined, utilizing one of the above techniques, the reorder
point, or point at which an order should be placed, can be determined by the rate of demand and
the lead time. If safety stock is necessary it would be added to the reorder point quantity.
Reorder point = Expected demand during lead time + Safety stock
Thus, an inventory item with a demand of 100 per month, a two-month lead time and a desired
safety stock of two weeks would have a reorder point of 250. In other words, an order would be
placed whenever the inventory level for that good reached 250 units.
Reorder point = 100/month × 2 months + 2 weeks' safety stock = 250
ASCM 629 - Week 5 Page 7
Paraphrase This Document
Need a fresh take? Get an instant paraphrase of this document with our AI Paraphraser
OTHER SCHOOLS OF THOUGHT IN INVENTORY
MANAGEMENT
There are a number of techniques and philosophies that view inventory management from
different perspectives.
MRP and MRP II. MRP and MRP II are computer-based resource management systems
designed for items that have dependent demand. MRP and MRP II look at order quantities period
by period and, as such, allow discrete ordering (ordering only what is currently needed). In this
way inventory levels can be kept at a very low level; a necessity for a complex item with
dependent demand.
Just-In-Time (JIT). Just-in-time (JIT) is a philosophy that advocates the lowest possible levels
of inventory. JIT espouses that firms need only keep inventory in the right quantity at the right
time with the right quality. The ideal lot size for JIT is one, even though one hears the term “zero
inventory” used.
Theory of Constraints (TOC). Theory of constraints (TOC) is a philosophy which emphasizes
that all management actions should center around the firm's constraints. While it agrees with JIT
that inventory should be at the lowest level possible in most instances, it advocates that there be
some buffer inventory around any capacity constraint (e.g., the slowest machine) and before
finished goods.
THE FUTURE OF INVENTORY MANAGEMENT
The advent, through altruism or legislation, of environmental management has added a new
dimension to inventory management-reverse supply chain logistics. Environmental management
has expanded the number of inventory types that firms have to coordinate. In addition to raw
materials, work-in-process, finished goods, and MRO goods, firms now have to deal with post-
consumer items such as scrap, returned goods, reusable or recyclable containers, and any number
of items that require repair, reuse, recycling, or secondary use in another product. Retailers have
the same type of problems dealing with inventory that has been returned due to defective
material or manufacture, poor fit, finish, or color, or outright “I changed my mind” responses
from customers.
Finally, supply chain management has had a considerable impact on inventory management.
Instead of managing one's inventory to maximize profit and minimize cost for the individual
firm, today's firm has to make inventory decisions that benefit the entire supply chain. Through
the use of real-time and end-to-end supplier chain reporting technologies, buyers can know
exactly where their products are in the supply chain, how much they have in stock, and even how
much their supplier can provide.
ASCM 629 - Week 5 Page 8
Management consultants from McKinsey & Company said in late 2007 that emerging
technologies have increased and will continue to increase automation for managing capital and
assets. Carrefour, Metro, Wal-Mart Stores, and other large retailers have adopted (and asked
suppliers to adopt) digital-tagging technologies, such as radio frequency identification (RFID).
These stores are further automating their supply chain and inventory management by integrated
digital tag technologies with other supply chain systems. As the price of these digital tags falls,
they will reduce the costs of managing distribution and increase revenues by helping companies
to manage supply more effectively.
SEE ALSO Aggregate Planning ; Inventory Types ; Lean Manufacturing and Just-in-Time
Production ; Manufacturing Resources Planning ; Reverse Supply Chain Logistics ; Supply
Chain Management
BIBLIOGRAPHY
Biederman, David. “Reversing Inventory Management.” Traffic World 12 December 2004: 1.
“Eight Business Technology Trends to Watch.” CNETNews.com 26 December 2007. Available
from: http://news.cnet.com/Eight-business-technology-trends-to-watch/2030-1069_3-
6223397.html .
Stevenson, William J. Production Operations Management. Boston, MA: Irwin/McGraw-Hill,
2005.
Sucky, Eric. “Inventory Management in Supply Chains: A Bargaining Problem.” International
Journal of Production Economics 93/94, no. 1 (2005): 253–262.
Varmazis, Maria. “Inventory Management: Software Shines Light on Savings.” Purchasing 17
January 2008. Available from: http://www.purchasing.com/article/CA6518764.html .
Source Citation (MLA 7th Edition)
"Inventory Management." Encyclopedia of Management. 6th ed. Detroit: Gale, 2009. 421-425. Gale Virtual
Reference Library. Web. 18 Oct. 2016.
URL
http://ezproxy.umuc.edu/login?url=http://go.galegroup.com/ps/i.do?
p=GVRL&sw=w&u=umd_umuc&v=2.1&id=GALE
%7CCX3273100143&it=r&asid=0018bd220f65bfe0641e6703bce372d2
Gale Document Number: GALE|CX3273100143
~~~~~~~~~~~~~~~~~~~~~~~~~~~~~~~~~~~~~~'
ASCM 629 - Week 5 Page 9
⊘ This is a preview!⊘
Do you want full access?
Subscribe today to unlock all pages.
Trusted by 1+ million students worldwide
Inventory Management
Inventory management is primarily concerned with specifying the shape and percentage
of stocked goods to reduce costs and improve sales.
Learning Objective
Recognize the applications and benefits of inventory management
Key Points
o Inventory refers to a list compiled for some formal purpose, such as the details of an
estate or the contents of a rented house.
o Inventory management is required at different locations within a facility or within many
locations of a supply network in order to plan for the production and stock of materials.
o Inventory management addresses issues including: replenishment lead time; carrying
costs of inventory; asset management; inventory forecasting; inventory valuation;
inventory visibility; and future inventory price forecasting.
o Supply chain activities can be grouped into strategic, tactical, and operational categories.
o Supply chain activities can be grouped into strategic, tactical, and operational levels.
Terms
tactical planning
an organization's process of determining how to optimize current resources and
operations
supply chain
A supply chain is a system of organizations, people, technology, activities,
information and resources involved in moving a product or service from supplier
to customer.
In the United Kingdom, inventory typically refers to a list compiled for some formal
purpose, such as one that itemizes an estate going to probate or the contents of a
furnished house to be rented. In the U.S. and Canada, inventory has become the
equivalent of the British term stock; that is, it refers to material that is available from and
stocked by a business. In the context of accounting, inventory or stock is considered an
asset.
ASCM 629 - Week 5 Page 10
Paraphrase This Document
Need a fresh take? Get an instant paraphrase of this document with our AI Paraphraser
Inventory Management
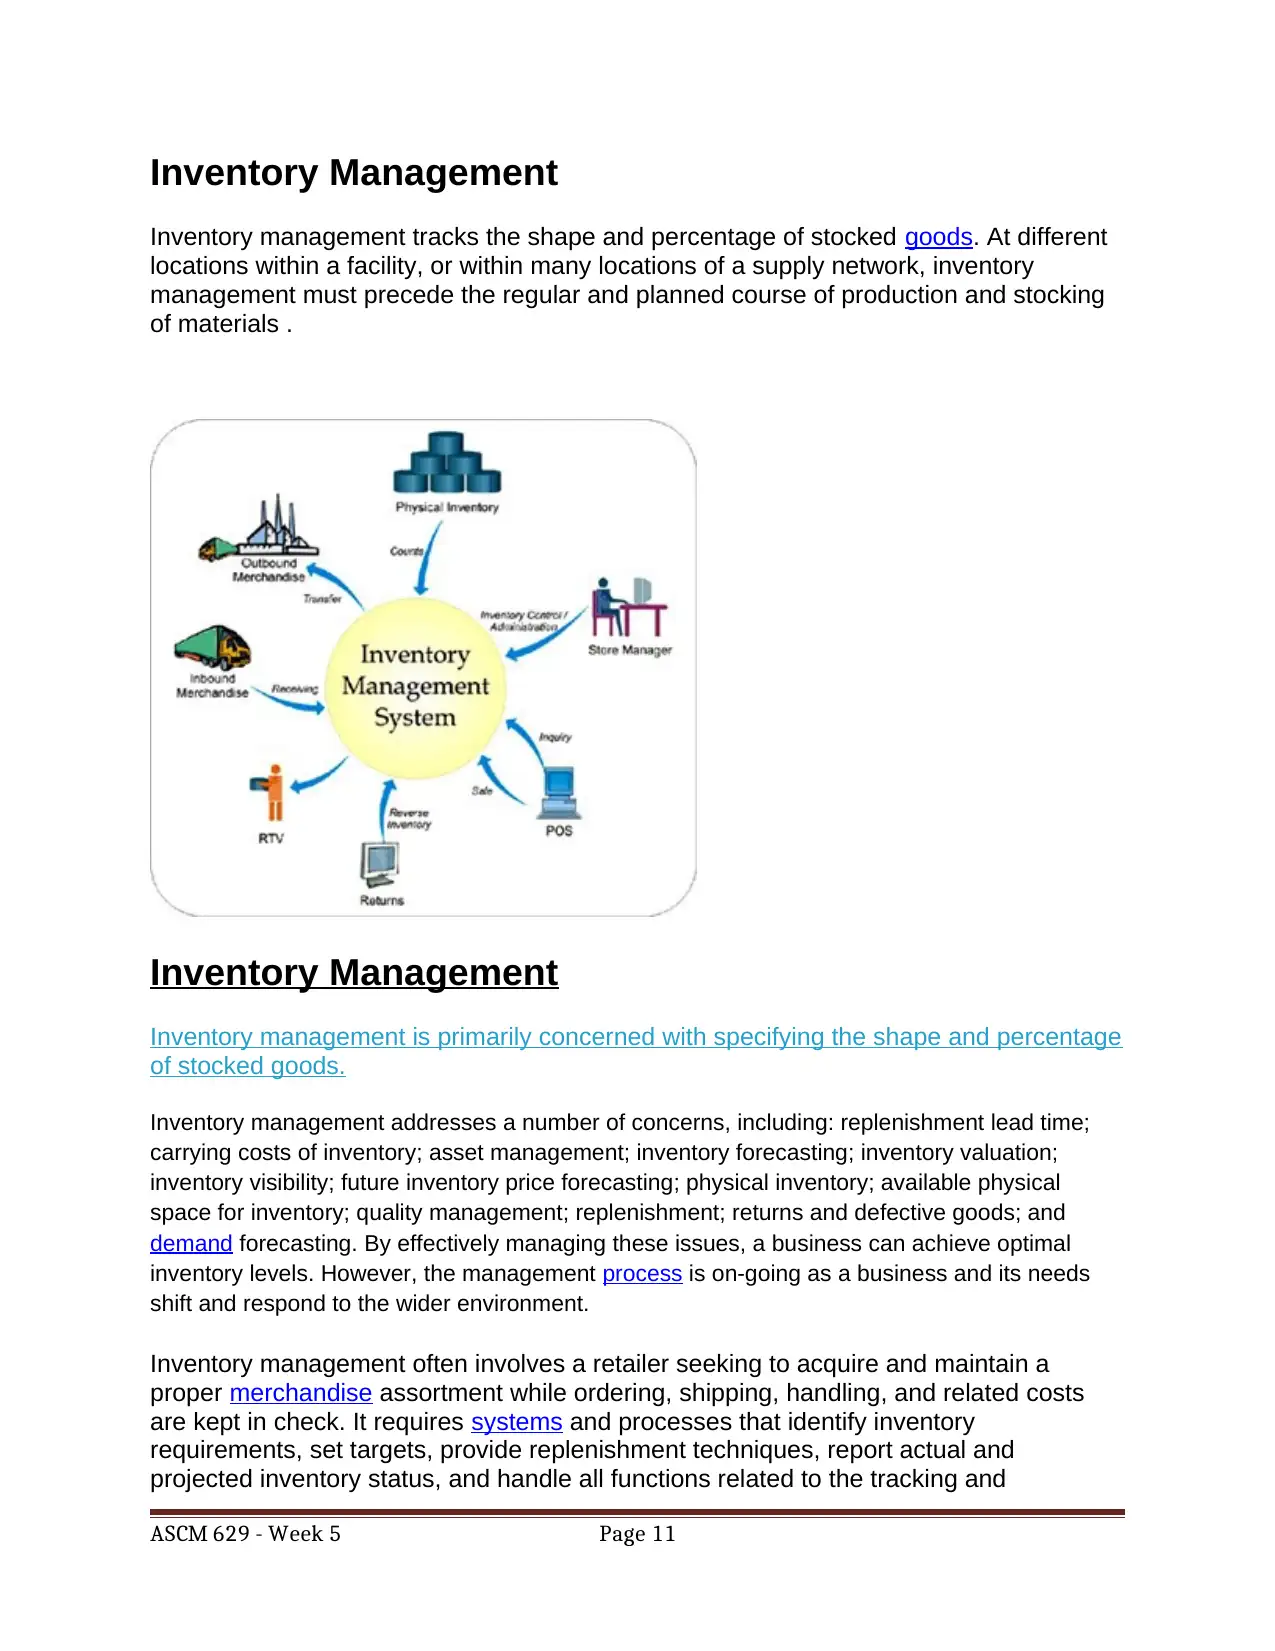
Inventory management tracks the shape and percentage of stocked goods. At different
locations within a facility, or within many locations of a supply network, inventory
management must precede the regular and planned course of production and stocking
of materials .
Inventory Management
Inventory management is primarily concerned with specifying the shape and percentage
of stocked goods.
Inventory management addresses a number of concerns, including: replenishment lead time;
carrying costs of inventory; asset management; inventory forecasting; inventory valuation;
inventory visibility; future inventory price forecasting; physical inventory; available physical
space for inventory; quality management; replenishment; returns and defective goods; and
demand forecasting. By effectively managing these issues, a business can achieve optimal
inventory levels. However, the management process is on-going as a business and its needs
shift and respond to the wider environment.
Inventory management often involves a retailer seeking to acquire and maintain a
proper merchandise assortment while ordering, shipping, handling, and related costs
are kept in check. It requires systems and processes that identify inventory
requirements, set targets, provide replenishment techniques, report actual and
projected inventory status, and handle all functions related to the tracking and
ASCM 629 - Week 5 Page 11
management of material. These include the monitoring of material moved into and out
of stockroom locations, as well as the reconciling of inventory balances. Processes may
also include ABC analysis, lot tracking, and cycle counting support.
Management of inventories, aimed primarily at determining and controlling stock levels
within the physical distribution system, serves to balance the need for product
availability against the need for minimizing stock holding and handling costs. Reasons
for keeping an inventory include:
Time: The time lag in the supply chain from supplier to user requires the availability of a certain
amount of inventory for use during this lead time. In practice, inventory is maintained for
consumption during variations in lead time, and lead time itself can be addressed by ordering a
specified number of days in advance.
Uncertainty: Inventories are maintained as buffers to meet uncertainties in demand, supply, and
movement of goods.
Economies of scale: To deliver one unit of product at a time, and in response to the specific need
and location of a given user, would be costly and logistically difficult. In contrast, bulk buying,
movement, and storage translate into economies of scale and inventory.
Inventory and the Supply Chain
Supply chain activities can be grouped into strategic, tactical, and operational levels.
Inventory considerations present at each level include:
Strategic: Network optimization, including the number, location, and size of
warehousing, distribution centers, and facilities.
Tactical: Inventory decisions, including quantity, location, and quality of inventory.
Operational: Sourcing planning, including current inventory and forecast demand, done
in collaboration with all suppliers; inbound operations, including transportation from
suppliers and receiving inventory; outbound operations, including all fulfillment activities,
warehousing, and transportation to customers; management of non-moving, short-dated
inventory and avoidance of short-dated products.
Source: Boundless. “Inventory Management.” Boundless Business. Boundless, 08 Aug. 2016. Retrieved
18 Oct. 2016 from https://www.boundless.com/business/textbooks/boundless-business-textbook/
operations-management-10/controlling-the-supply-chain-72/inventory-management-338-7464/
~~~~~~~~~~~~~~~~~~~~~~~~~~~~~~~~~~~~~~'
ASCM 629 - Week 5 Page 12
⊘ This is a preview!⊘
Do you want full access?
Subscribe today to unlock all pages.
Trusted by 1+ million students worldwide
1 out of 26
Related Documents


Your All-in-One AI-Powered Toolkit for Academic Success.
+13062052269
info@desklib.com
Available 24*7 on WhatsApp / Email
![[object Object]](/_next/static/media/star-bottom.7253800d.svg)
Unlock your academic potential
Copyright © 2020–2026 A2Z Services. All Rights Reserved. Developed and managed by ZUCOL.