Quantitative Research: Car Parking Analysis at University of Tasmania
VerifiedAdded on 2023/06/04
|8
|2421
|447
Report
AI Summary
This report presents a quantitative research exercise investigating car parking problems at the University of Tasmania (UTAS). The study utilizes data collected over six months from traffic counter devices installed at four entrances of the main campus car parks: Alexander Street, Churchill Avenue, Earl Street, and Grace Street. The research aims to identify parking issues and trends, employing descriptive statistics, box plots, and line graphs to visualize the data. Furthermore, the analysis includes t-tests and ANOVA to determine significant differences in car park usage between in-semester and non-semester periods, as well as across different car park entrances. The findings reveal variations in parking patterns based on the time of the semester and the specific entrance used, with the goal of providing insights to address car parking challenges at UTAS. The report concludes with a discussion of the results and their implications.
AN INVESTIGATION INTO CAR PARKING PROBLEMS
IN THE UNIVERSITY OF TASMANIA
Ming Ruey Ham, 460237
Faculty of ICT, University of Tasmania
mrham@utas.edu.au
1. Abstract
The focus of this research is to find out the usage of carpark in the University of
Tasmania. The main objective is to find out the problem of car parking in the
university. In order to achieve the objective, traffic counter devices have been
operating for six months and they are installed at the four entrances of car parks
around the lower half of the main campus. Those four entrances are Alexander
Street, Churchill Avenue, Earl Street, and Grace Street. Description and
illustration of data set, t-test and ANOVA test will be carried out in order to reach
a satisfiable conclusion.
Keywords: T-test, ANOVA, University of Tasmania, Car Parking Problem
2. Introduction
There is a misconception that Hobart is a walkable city as it is Australia’s second-
oldest city, however, that is not the case. In fact, it is one of Australia’s most car
dependent city with 89% of people travel was a car driver or a passenger (Pharo &
Byrne, 2018).
As University of Tasmania is always working on reaching a higher level, it is
unavoidable that they would become more famous and eventually attracts more
students to come to University of Tasmania in search of better education. While it
is a thing to celebrate for with more student coming into the University of
Tasmania, it is undeniable that basic facilities within the university have to be
upgraded in order to be able to handle the amount of demands.
Without a doubt, lack of packing spots can be a major problem not only to the
students, but to every stakeholder of University of Tasmania. While some parking
spots have been reserved for certain faculties members, not all staffs and other
Paraphrase This Document
Need a fresh take? Get an instant paraphrase of this document with our AI Paraphraser
individuals have access to this kind of privileges which would eventually become
counterproductive as time and energy spent on searching for a parking spot could
have been better utilized somewhere else.
This research hopes to figure out the current situation of car parking space
available in the university. By observing the entrance of cars from different entry
points and how the amount changes at different periods of time, a better
understanding would be achieved by reading into the data that are produced and
hopefully it leads to finding a way to curb the problem.
3. Description and illustration of dataset
Entrance Point Day
s
Minimum Maximum Mean Std.
Deviation
Alexander Street 181 10 892 373.85 316.28
Churchill Avenue 181 11 898 375.71 304.29
Earl Street 181 10 900 364.81 304.78
Grace Street 181 7 735 272.12 235.81
Table 1: Data description for car park of University of Tasmania
Table above are data collected from four different entrance points of University
of Tasmania in the year of 2018. The analysis that are carried out in this paper
will be based upon table above. The four different entrance points that data
collected are from Alexander Street, Churchill Avenue, Earl Street, and Grace
Street.
The total days spent on data collection are 181 days, from the 1st of January to
30th of June. According to the table above, Grace Street has the least amount of
car coming through with the lowest amount of minimum and maximum number
of cars.
On the other hand, Alexander Street, Churchill Avenue, and Grace Street are
pretty much alike on minimum and maximum number of cars coming through.
Among these four entrance points, Churchill Avenue has the highest mean with
376 cars entering through, followed by Alexander Street with averagely 374 cars
daily, Earl Street with averagely 365 cars daily, and lastly, Grace Street with
averagely 272 cars daily. (Car numbers have been rounded off to the nearest
whole number)
4. In-semester and non-semester days plots comparison
Graphical Representation. Graphical representation of data is one of the numerous ways of
descriptive statistical analysis (Frankfort-Nachias, 2015).
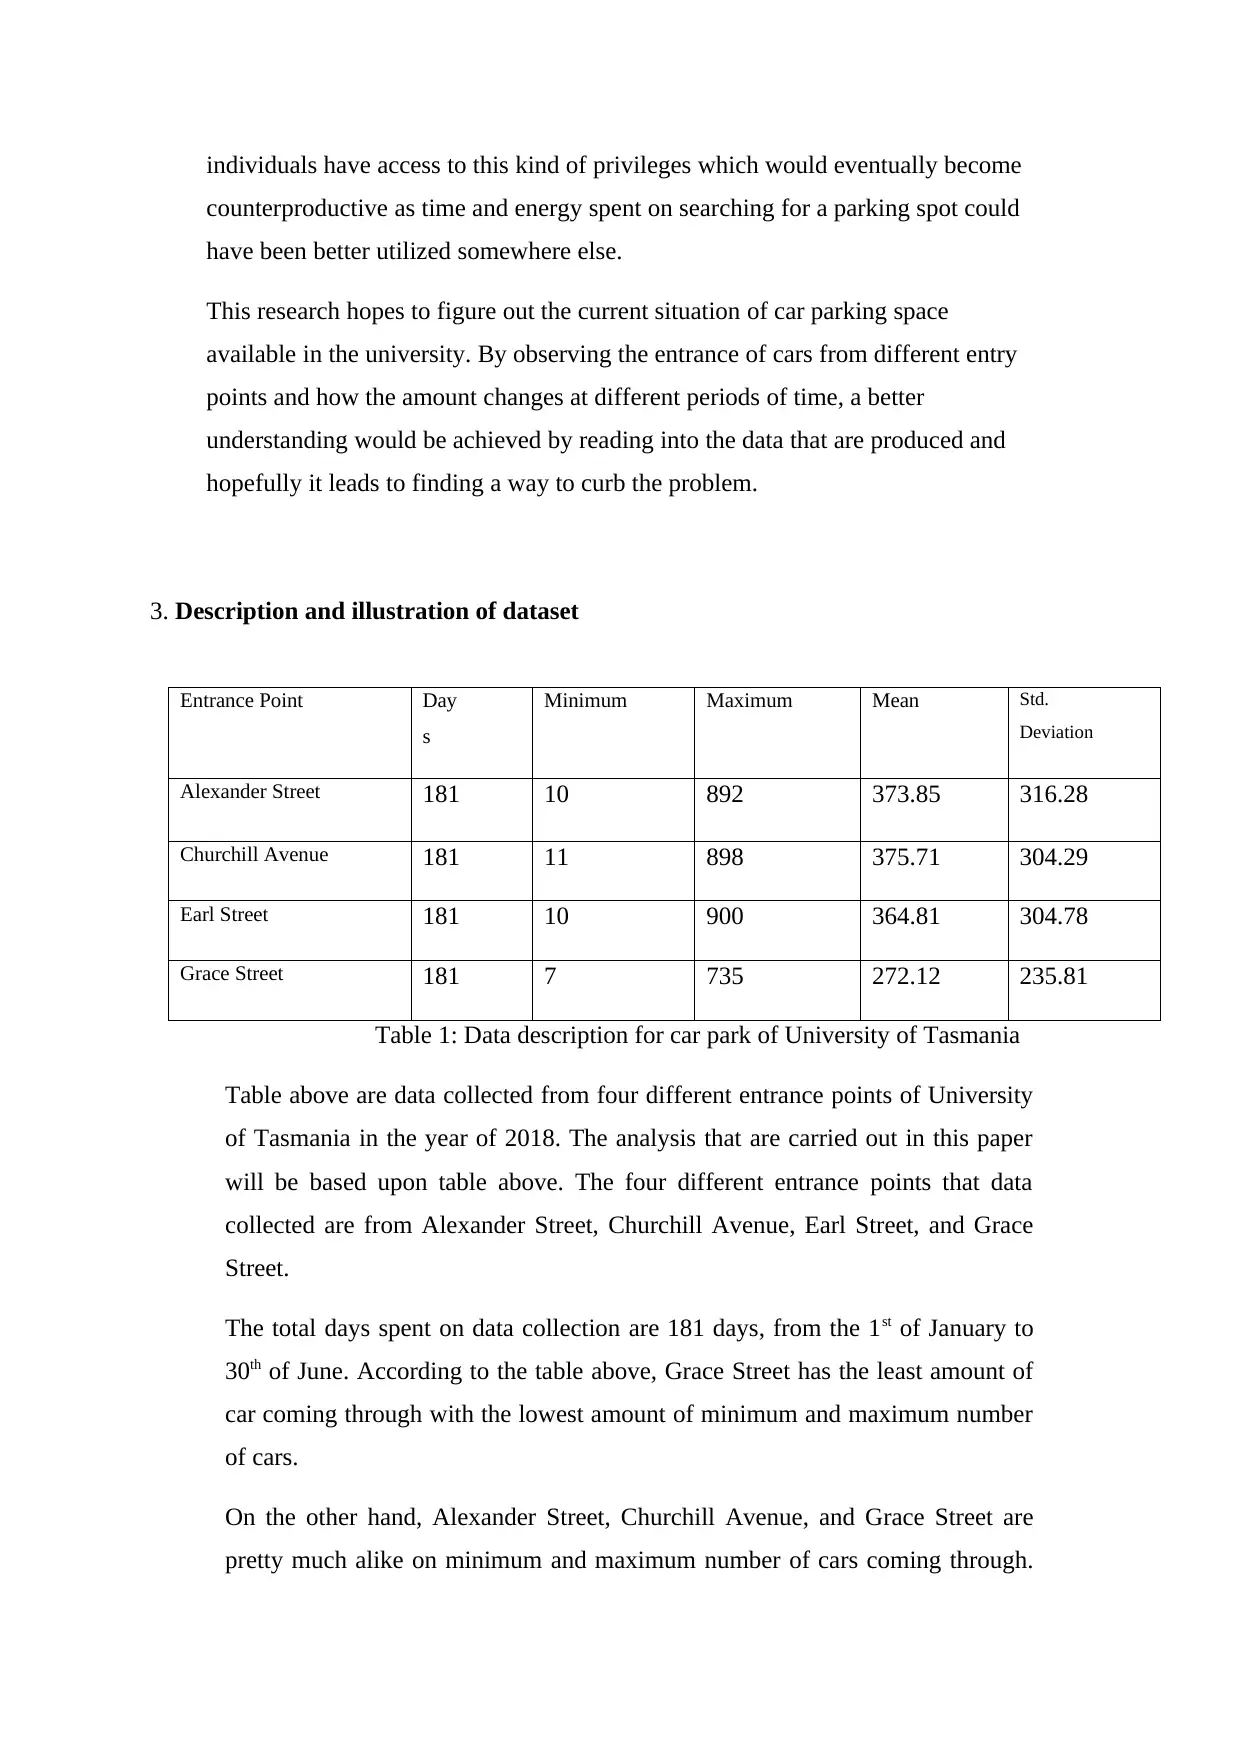
Box Plot. The figure below shows the output of the Box Plot.
Table 2: Boxplot of in-semester and non-semester days
From the boxplot in table 2, it is easy to reach the conclusion that there are more
cars entering the University of Tasmania through the four entrance points during
in-semester days compared to non-semester day. There are 98 days for in-semester
days and 83 days for non-semester days. During in-semester days, the average
numbers of cars coming through the four entrances are 1834. For non-semester
days, the average numbers of cars coming through the four entrances are 843.
376 cars entering through, followed by Alexander Street with averagely 374 cars
daily, Earl Street with averagely 365 cars daily, and lastly, Grace Street with
averagely 272 cars daily. (Car numbers have been rounded off to the nearest
whole number)
4. In-semester and non-semester days plots comparison
Graphical Representation. Graphical representation of data is one of the numerous ways of
descriptive statistical analysis (Frankfort-Nachias, 2015).
Box Plot. The figure below shows the output of the Box Plot.
Table 2: Boxplot of in-semester and non-semester days
From the boxplot in table 2, it is easy to reach the conclusion that there are more
cars entering the University of Tasmania through the four entrance points during
in-semester days compared to non-semester day. There are 98 days for in-semester
days and 83 days for non-semester days. During in-semester days, the average
numbers of cars coming through the four entrances are 1834. For non-semester
days, the average numbers of cars coming through the four entrances are 843.
⊘ This is a preview!⊘
Do you want full access?
Subscribe today to unlock all pages.
Trusted by 1+ million students worldwide
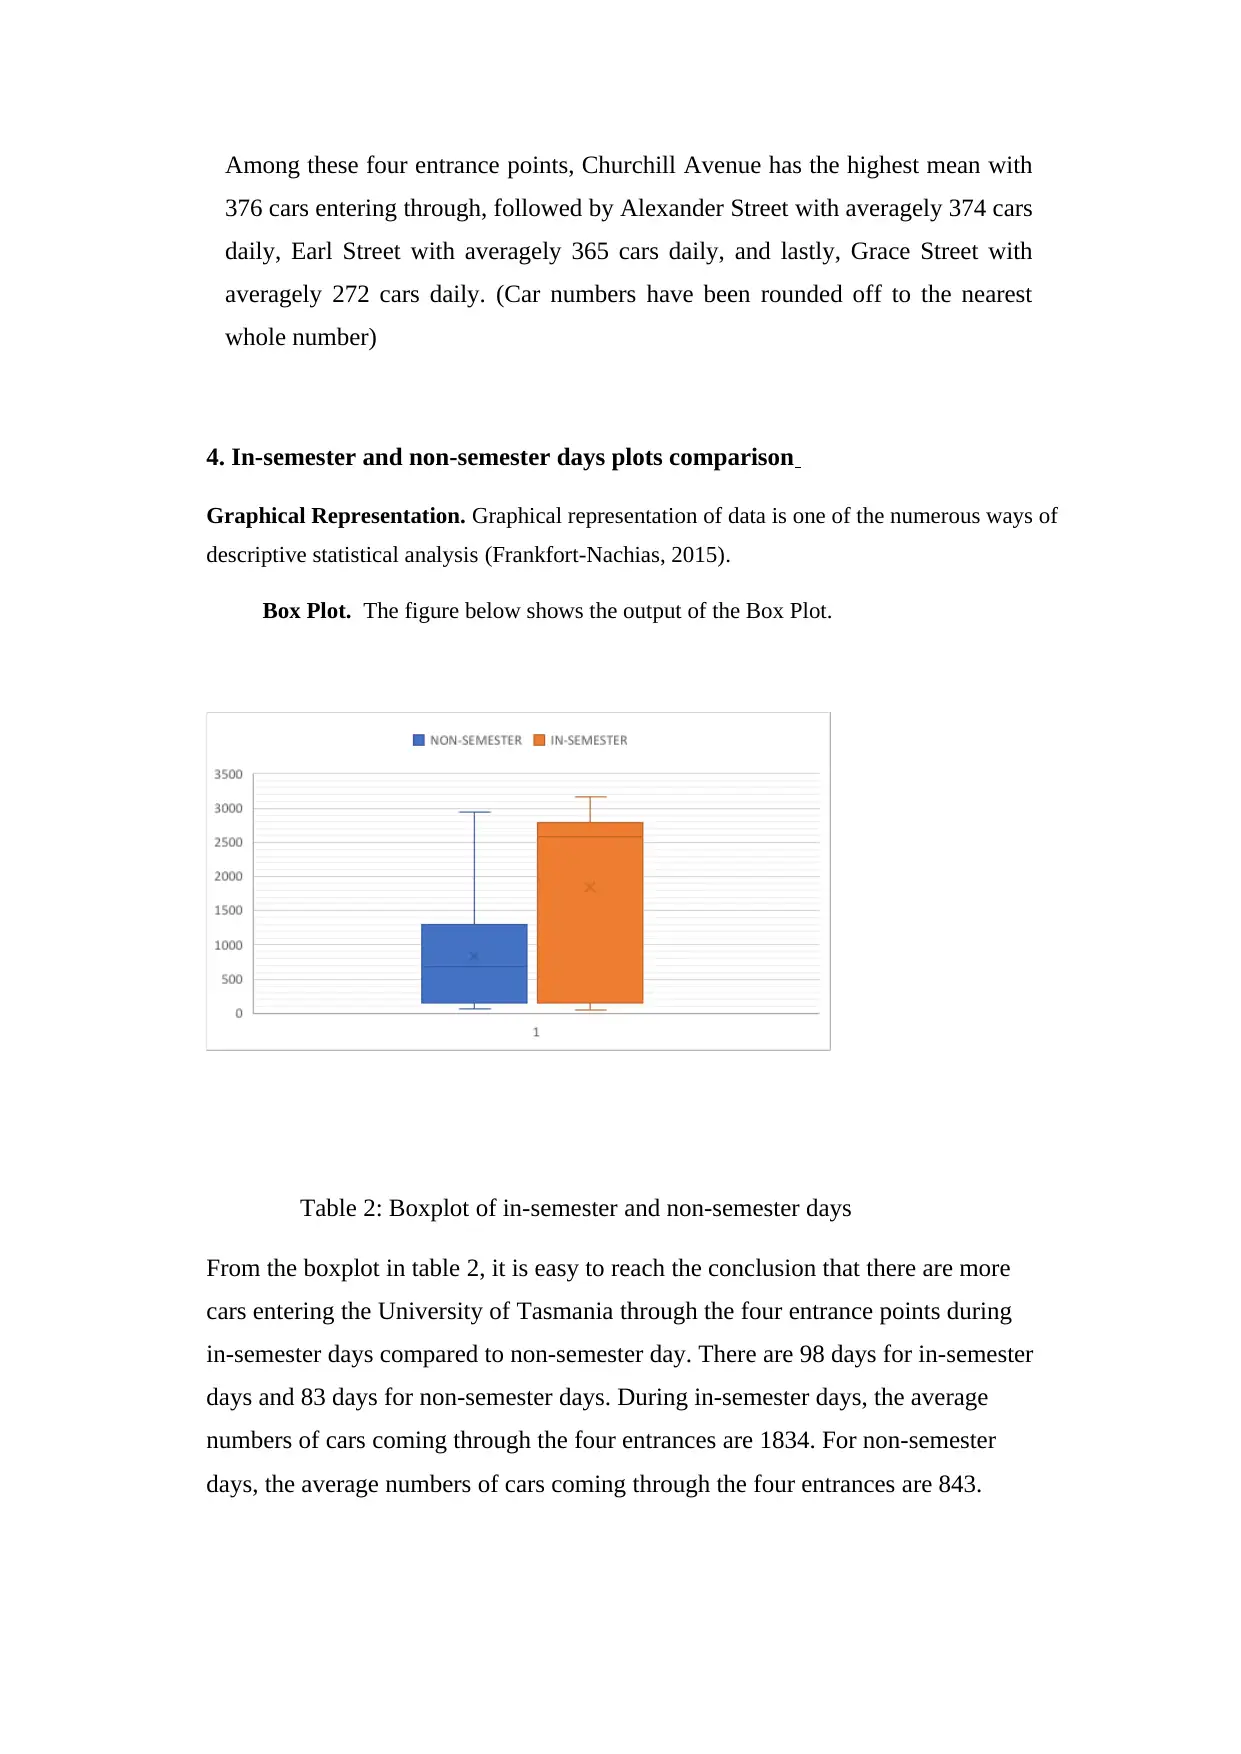
Line Plot. The figure below shows the output of a line graph of semester and non -semester
periods. The output has been obtained using excel.
From the output in the figure below, it is clear that there is a difference in the number of cars
parked during the two periods. This difference is visible from the trends displayed by the lines
of the graph. The number of cars parked during the semester are relatively higher than those
that are parked during the non- semester period.
1
6
11
16
21
26
31
36
41
46
51
56
61
66
71
76
81
0
500
1000
1500
2000
2500
3000
3500
A Line Graph Showing Number of cars in in-
semester and non-semester days
Total Non Semester Total semester
Days
Number of Cars
Table 3: A Line Graph Showing Number of cars in in-semester and non-semester days
The t- test. T- Test is a form of hypothesis test (Jackson, 2017). Hypothesis is an assertion
about a phenomenon. The truth value of hypothesis is usually unknown until tested (Lind,
2008). To carry out hypothesis test, there is a procedure to follow (Stuart A., 1999).
The initial stage of hypothesis testing is stating the hypothesis. A decision rule or the rejection
region is then set after which an appropriate statistical test is chosen. Finally, the test is
conducted and then the decision is made (Lind, 2008).
In this scenario, we use a t- test to find out whether there is any significant difference in the
average number of cars parked during the two different periods (Lind, 2008). The test in this
section has been conducted using SPSS.
Hypothesis is stated in pairs, a null hypothesis and an alternative hypothesis. A null hypothesis
is negatively stated while an alternative hypothesis is stated positively. A null hypothesis is
stated first (Stuart A., 1999). A null hypothesis is denoted by H0 while an alternative hypothesis
is denoted by H1. The following hypothesis were tested:
Paraphrase This Document
Need a fresh take? Get an instant paraphrase of this document with our AI Paraphraser
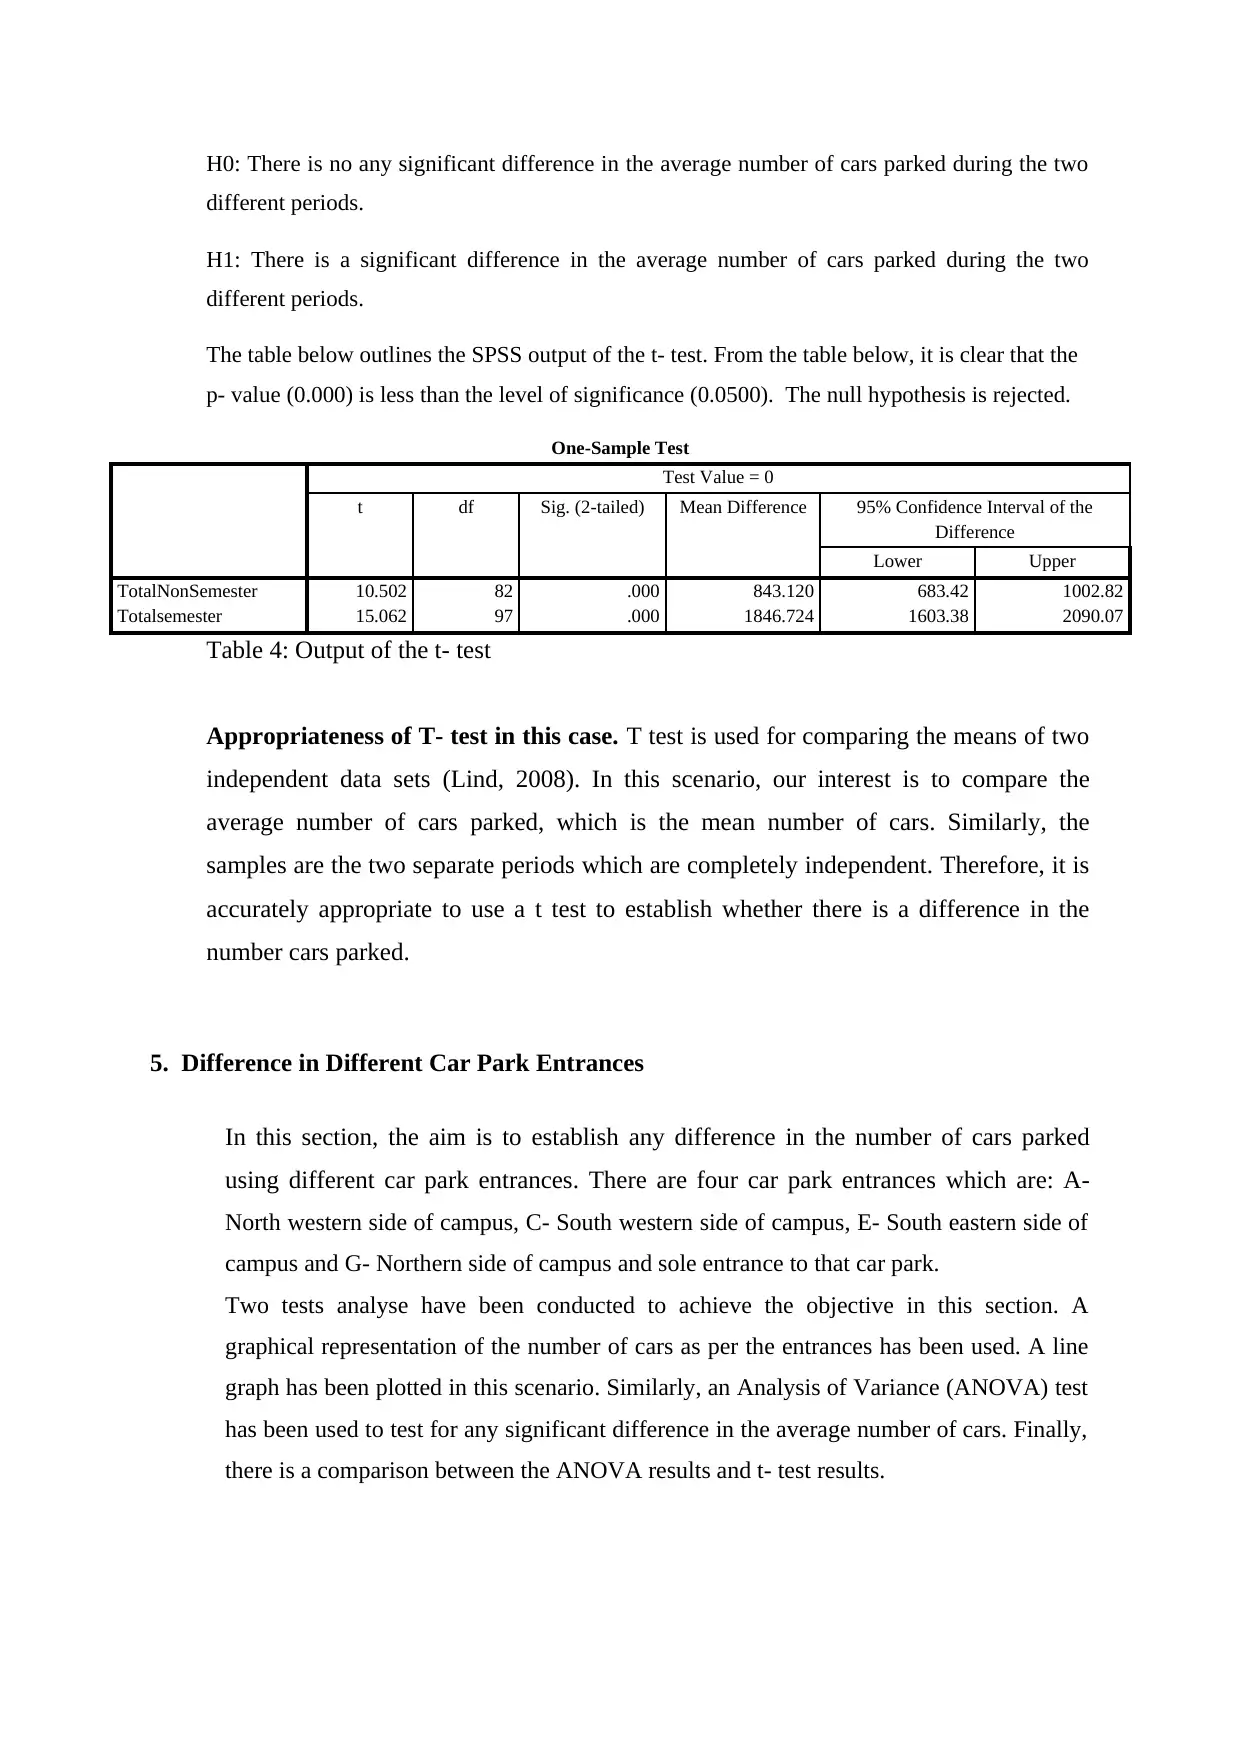
H0: There is no any significant difference in the average number of cars parked during the two
different periods.
H1: There is a significant difference in the average number of cars parked during the two
different periods.
The table below outlines the SPSS output of the t- test. From the table below, it is clear that the
p- value (0.000) is less than the level of significance (0.0500). The null hypothesis is rejected.
One-Sample Test
Test Value = 0
t df Sig. (2-tailed) Mean Difference 95% Confidence Interval of the
Difference
Lower Upper
TotalNonSemester 10.502 82 .000 843.120 683.42 1002.82
Totalsemester 15.062 97 .000 1846.724 1603.38 2090.07
Table 4: Output of the t- test
Appropriateness of T- test in this case. T test is used for comparing the means of two
independent data sets (Lind, 2008). In this scenario, our interest is to compare the
average number of cars parked, which is the mean number of cars. Similarly, the
samples are the two separate periods which are completely independent. Therefore, it is
accurately appropriate to use a t test to establish whether there is a difference in the
number cars parked.
5. Difference in Different Car Park Entrances
In this section, the aim is to establish any difference in the number of cars parked
using different car park entrances. There are four car park entrances which are: A-
North western side of campus, C- South western side of campus, E- South eastern side of
campus and G- Northern side of campus and sole entrance to that car park.
Two tests analyse have been conducted to achieve the objective in this section. A
graphical representation of the number of cars as per the entrances has been used. A line
graph has been plotted in this scenario. Similarly, an Analysis of Variance (ANOVA) test
has been used to test for any significant difference in the average number of cars. Finally,
there is a comparison between the ANOVA results and t- test results.
different periods.
H1: There is a significant difference in the average number of cars parked during the two
different periods.
The table below outlines the SPSS output of the t- test. From the table below, it is clear that the
p- value (0.000) is less than the level of significance (0.0500). The null hypothesis is rejected.
One-Sample Test
Test Value = 0
t df Sig. (2-tailed) Mean Difference 95% Confidence Interval of the
Difference
Lower Upper
TotalNonSemester 10.502 82 .000 843.120 683.42 1002.82
Totalsemester 15.062 97 .000 1846.724 1603.38 2090.07
Table 4: Output of the t- test
Appropriateness of T- test in this case. T test is used for comparing the means of two
independent data sets (Lind, 2008). In this scenario, our interest is to compare the
average number of cars parked, which is the mean number of cars. Similarly, the
samples are the two separate periods which are completely independent. Therefore, it is
accurately appropriate to use a t test to establish whether there is a difference in the
number cars parked.
5. Difference in Different Car Park Entrances
In this section, the aim is to establish any difference in the number of cars parked
using different car park entrances. There are four car park entrances which are: A-
North western side of campus, C- South western side of campus, E- South eastern side of
campus and G- Northern side of campus and sole entrance to that car park.
Two tests analyse have been conducted to achieve the objective in this section. A
graphical representation of the number of cars as per the entrances has been used. A line
graph has been plotted in this scenario. Similarly, an Analysis of Variance (ANOVA) test
has been used to test for any significant difference in the average number of cars. Finally,
there is a comparison between the ANOVA results and t- test results.
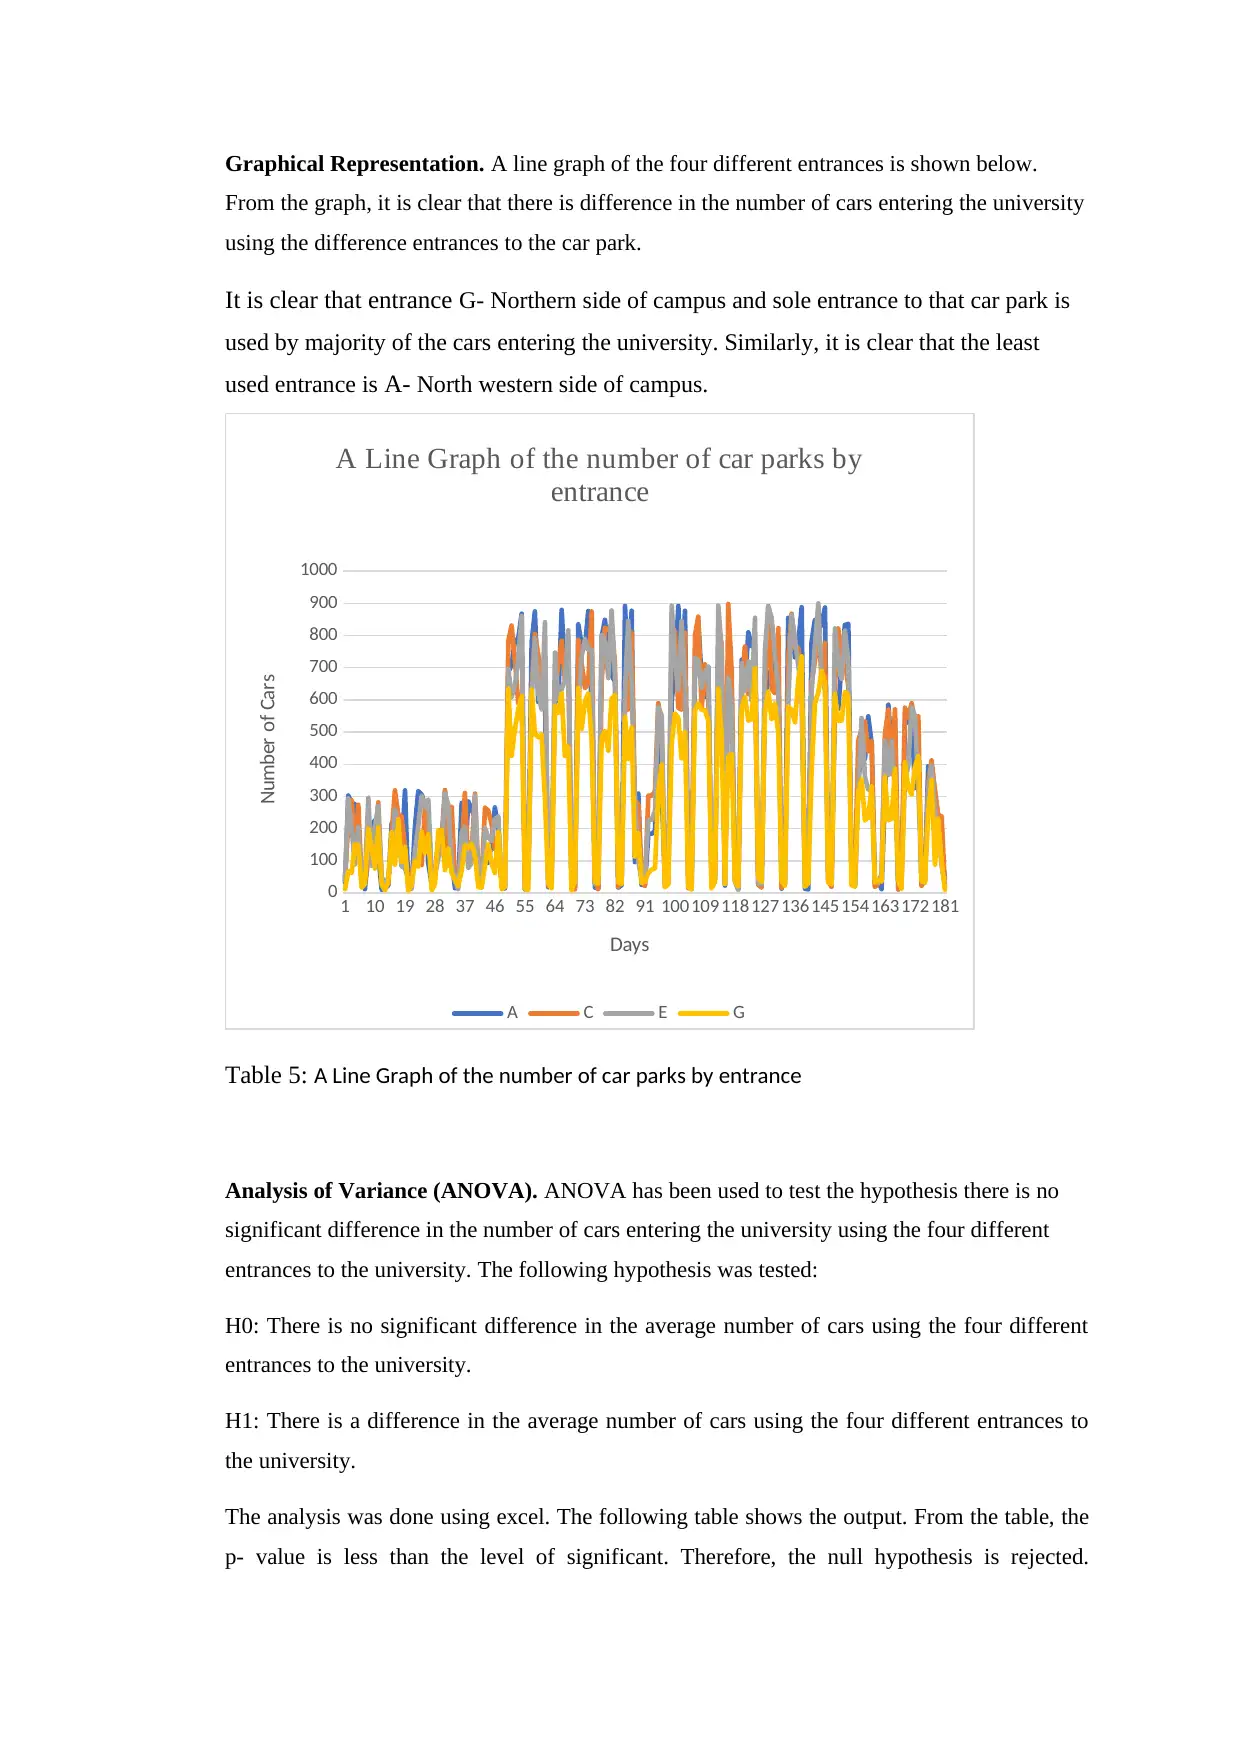
Graphical Representation. A line graph of the four different entrances is shown below.
From the graph, it is clear that there is difference in the number of cars entering the university
using the difference entrances to the car park.
It is clear that entrance G- Northern side of campus and sole entrance to that car park is
used by majority of the cars entering the university. Similarly, it is clear that the least
used entrance is A- North western side of campus.
1 10 19 28 37 46 55 64 73 82 91 100109118127136145154163172181
0
100
200
300
400
500
600
700
800
900
1000
A Line Graph of the number of car parks by
entrance
A C E G
Days
Number of Cars
Table 5: A Line Graph of the number of car parks by entrance
Analysis of Variance (ANOVA). ANOVA has been used to test the hypothesis there is no
significant difference in the number of cars entering the university using the four different
entrances to the university. The following hypothesis was tested:
H0: There is no significant difference in the average number of cars using the four different
entrances to the university.
H1: There is a difference in the average number of cars using the four different entrances to
the university.
The analysis was done using excel. The following table shows the output. From the table, the
p- value is less than the level of significant. Therefore, the null hypothesis is rejected.
⊘ This is a preview!⊘
Do you want full access?
Subscribe today to unlock all pages.
Trusted by 1+ million students worldwide
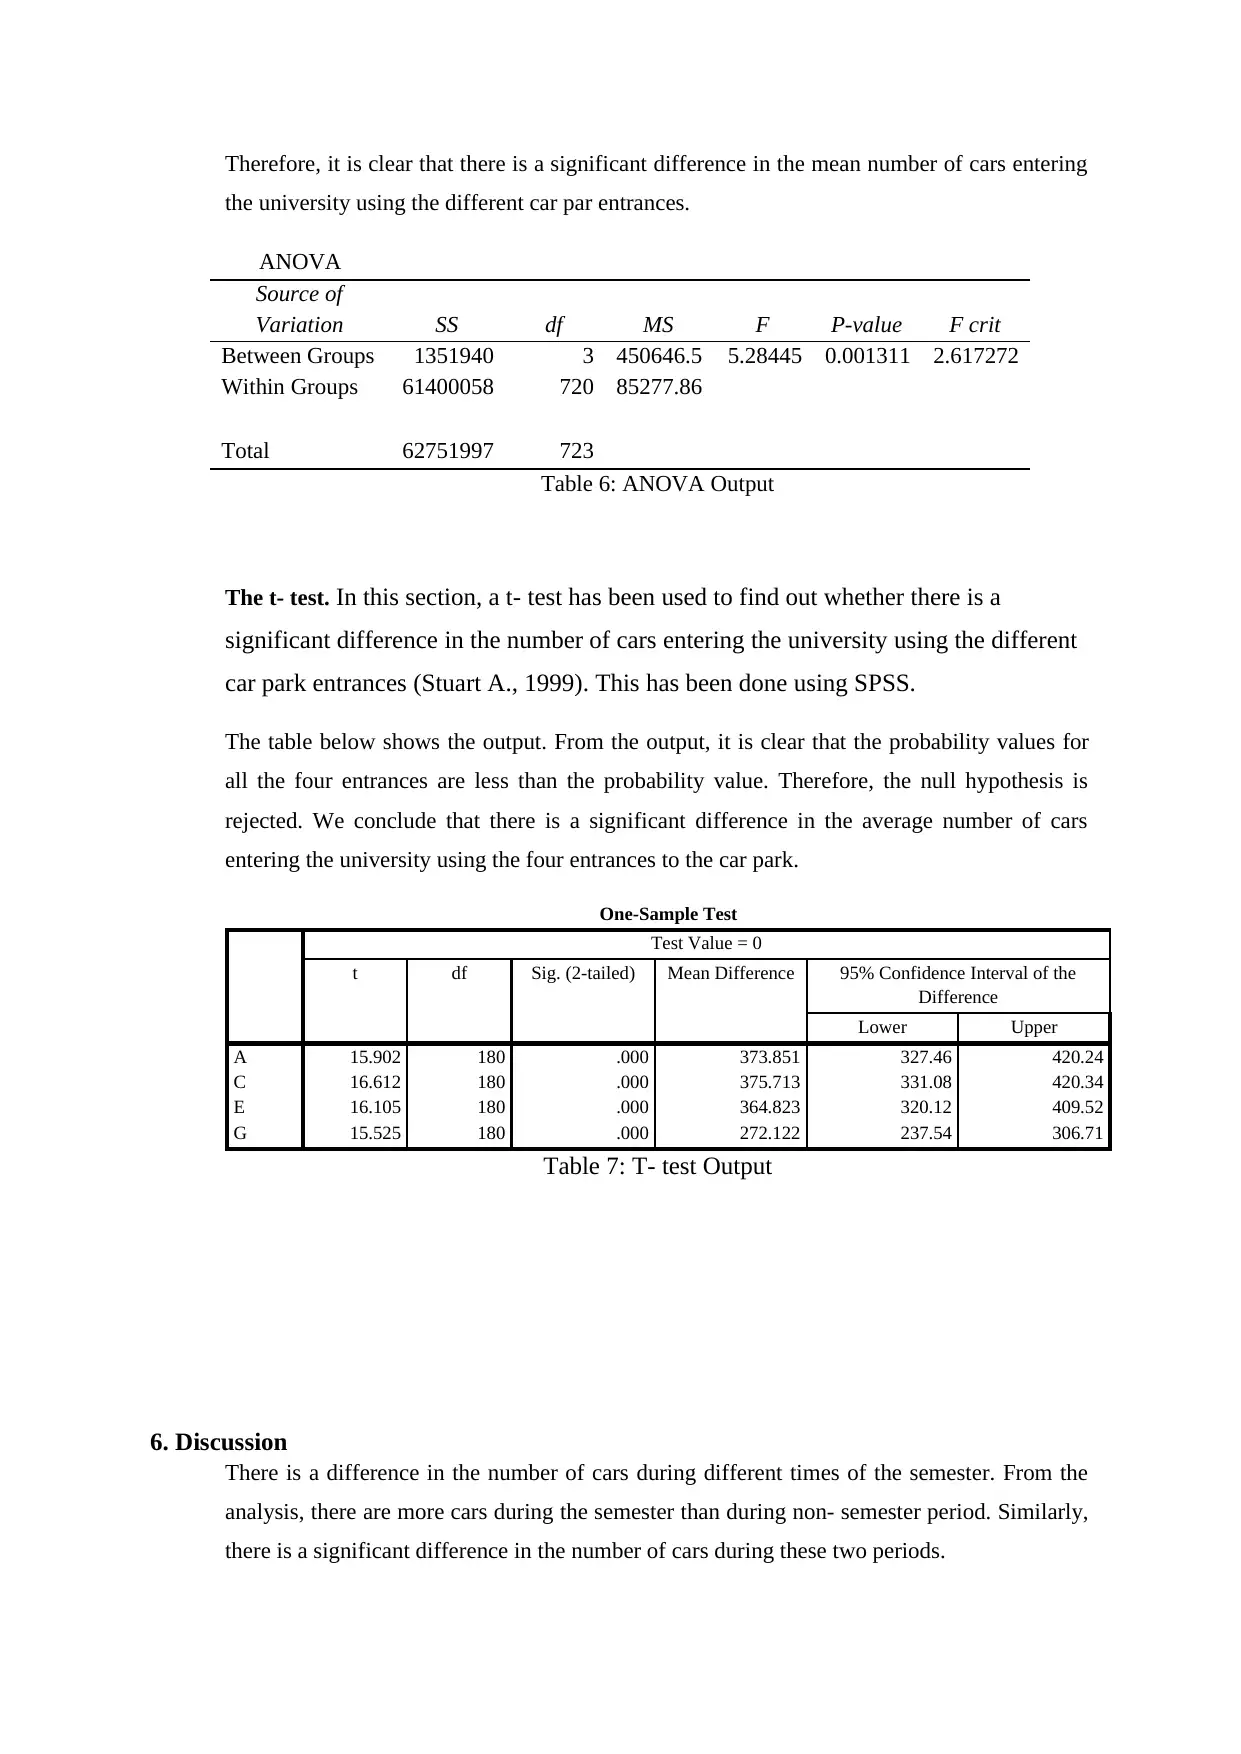
Therefore, it is clear that there is a significant difference in the mean number of cars entering
the university using the different car par entrances.
ANOVA
Source of
Variation SS df MS F P-value F crit
Between Groups 1351940 3 450646.5 5.28445 0.001311 2.617272
Within Groups 61400058 720 85277.86
Total 62751997 723
Table 6: ANOVA Output
The t- test. In this section, a t- test has been used to find out whether there is a
significant difference in the number of cars entering the university using the different
car park entrances (Stuart A., 1999). This has been done using SPSS.
The table below shows the output. From the output, it is clear that the probability values for
all the four entrances are less than the probability value. Therefore, the null hypothesis is
rejected. We conclude that there is a significant difference in the average number of cars
entering the university using the four entrances to the car park.
One-Sample Test
Test Value = 0
t df Sig. (2-tailed) Mean Difference 95% Confidence Interval of the
Difference
Lower Upper
A 15.902 180 .000 373.851 327.46 420.24
C 16.612 180 .000 375.713 331.08 420.34
E 16.105 180 .000 364.823 320.12 409.52
G 15.525 180 .000 272.122 237.54 306.71
Table 7: T- test Output
6. Discussion
There is a difference in the number of cars during different times of the semester. From the
analysis, there are more cars during the semester than during non- semester period. Similarly,
there is a significant difference in the number of cars during these two periods.
Paraphrase This Document
Need a fresh take? Get an instant paraphrase of this document with our AI Paraphraser
There is a difference in the number of cars entering the university car park using the different
entrances to the car park. Generally, G- Northern side of campus and sole entrance to that
car park is used by majority of the cars entering the university. Similarly, it is clear that
the least used entrance is A- North western side of campus.
Moreover, here is a significant different in the average number of cars entering the car
park using the four different entrances to the car park.
Finally, from the graphical representations, it is clear that there is a difference in the
number of cars during in- semester and non- semester periods. It is clear that the number
of cars during the in- semester are more than those during non- semester periods.
References
Frankfort-Nachias, C. &. L.-G. A., 2015. Social Statistics for a diverse society. Thousand Oaks, CA:
Sage Publications.
Jackson, S. M. K. M. C. W. T. &. P. M., 2017. Methods. [Online]
Available at: http://writing.colostate.edu/research/stats/
Lind, D. A. M. W. G. &. W. S. A., 2008. Statistical Techniques in Business &. Boston.: McGraw-Hill
Irwin.
Pharo, E. & Byrne, J., 28 February 2018. University of Tasmania. [Online]
Available at: http://www.utas.edu.au/news/2018/3/1/546-the-city-with-growing-pains-and-why-roads-
wont-help/
[Accessed 5 Oct 2018].
Stuart A., O. K. A. S., 1999. Kendall’s Advanced Theory of Statistics: Volume 2A- Classical
Inference & the linear Model.. s.l.:s.n.
1 out of 8


Your All-in-One AI-Powered Toolkit for Academic Success.
+13062052269
info@desklib.com
Available 24*7 on WhatsApp / Email
![[object Object]](/_next/static/media/star-bottom.7253800d.svg)
Unlock your academic potential
Copyright © 2020–2026 A2Z Services. All Rights Reserved. Developed and managed by ZUCOL.