Financial Management: Investment Strategy for Mrs. Stottie - CSL Ltd.

Verified

Added on  2023/03/30

|9
|1158
|390
Report
AI Summary
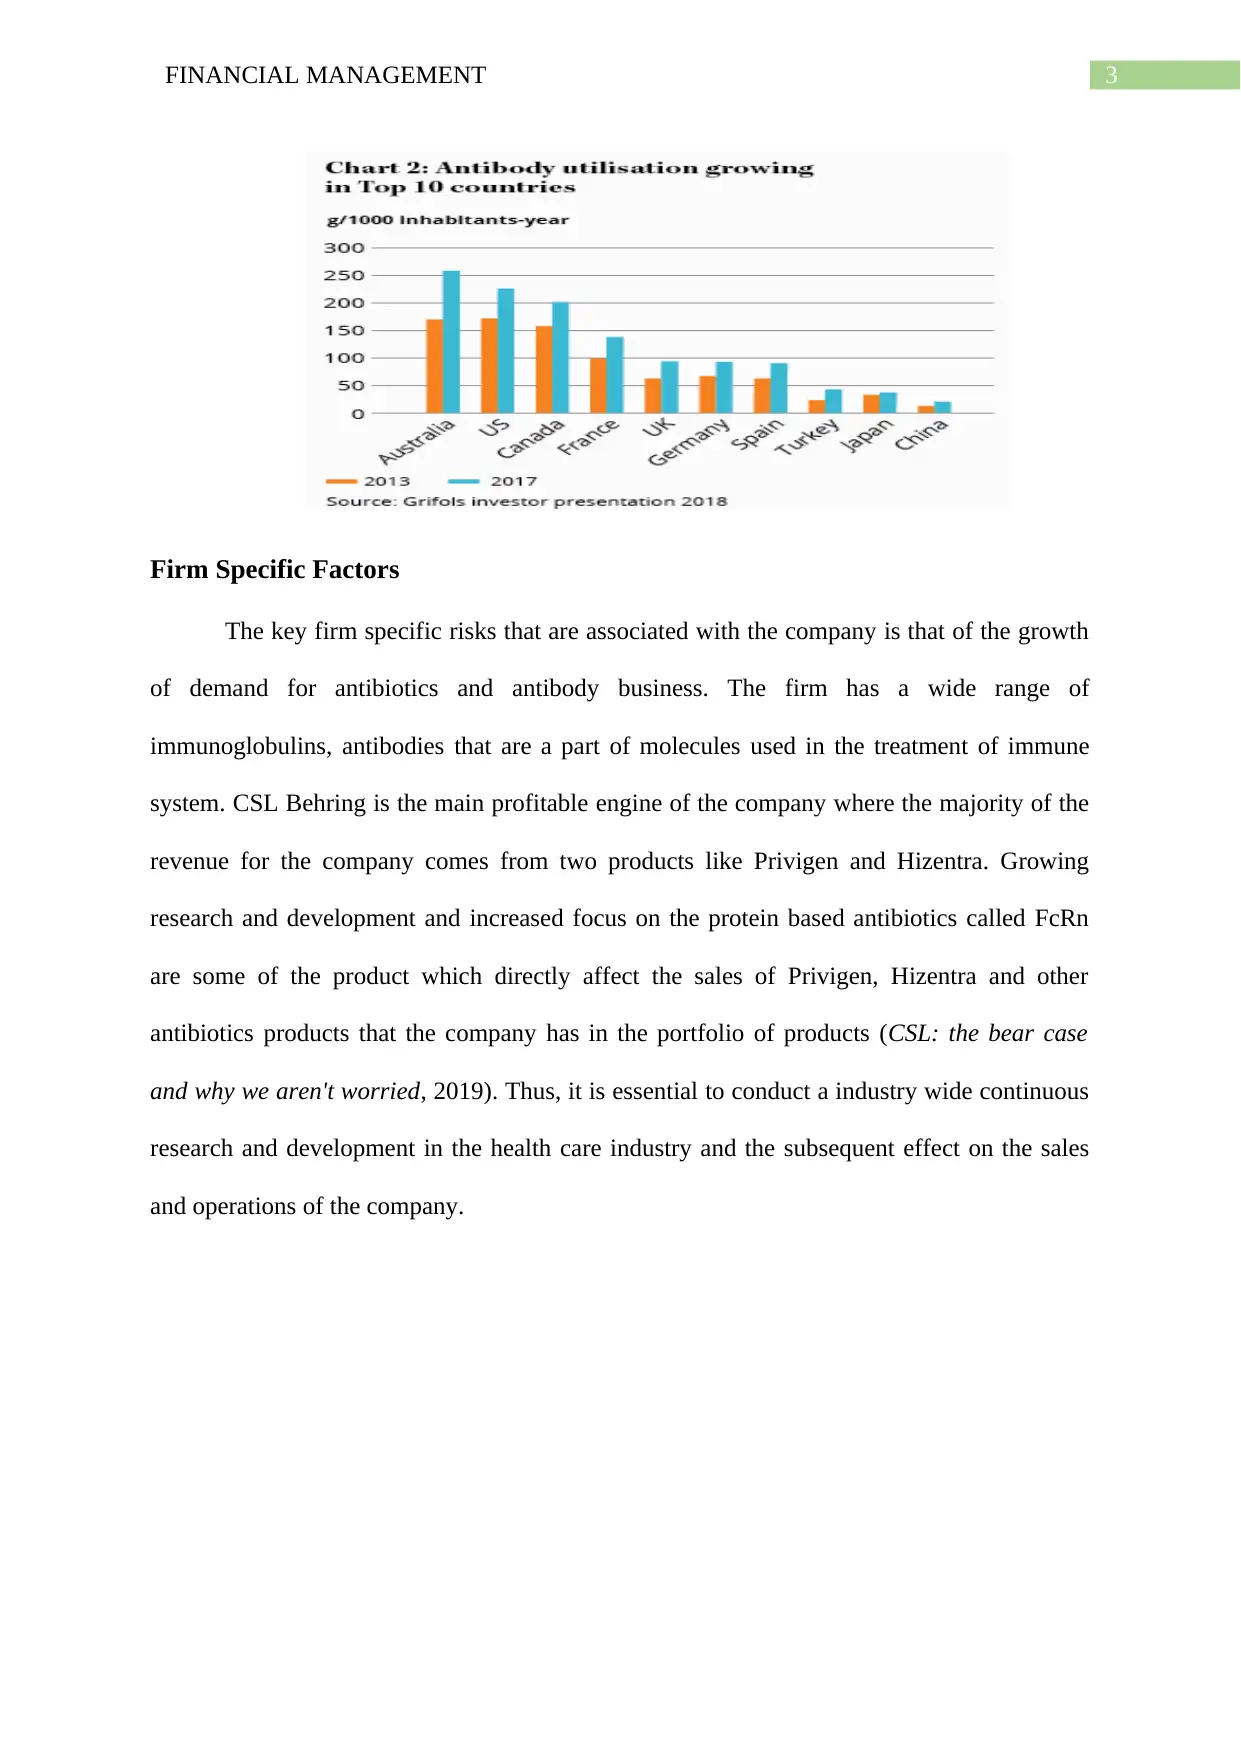
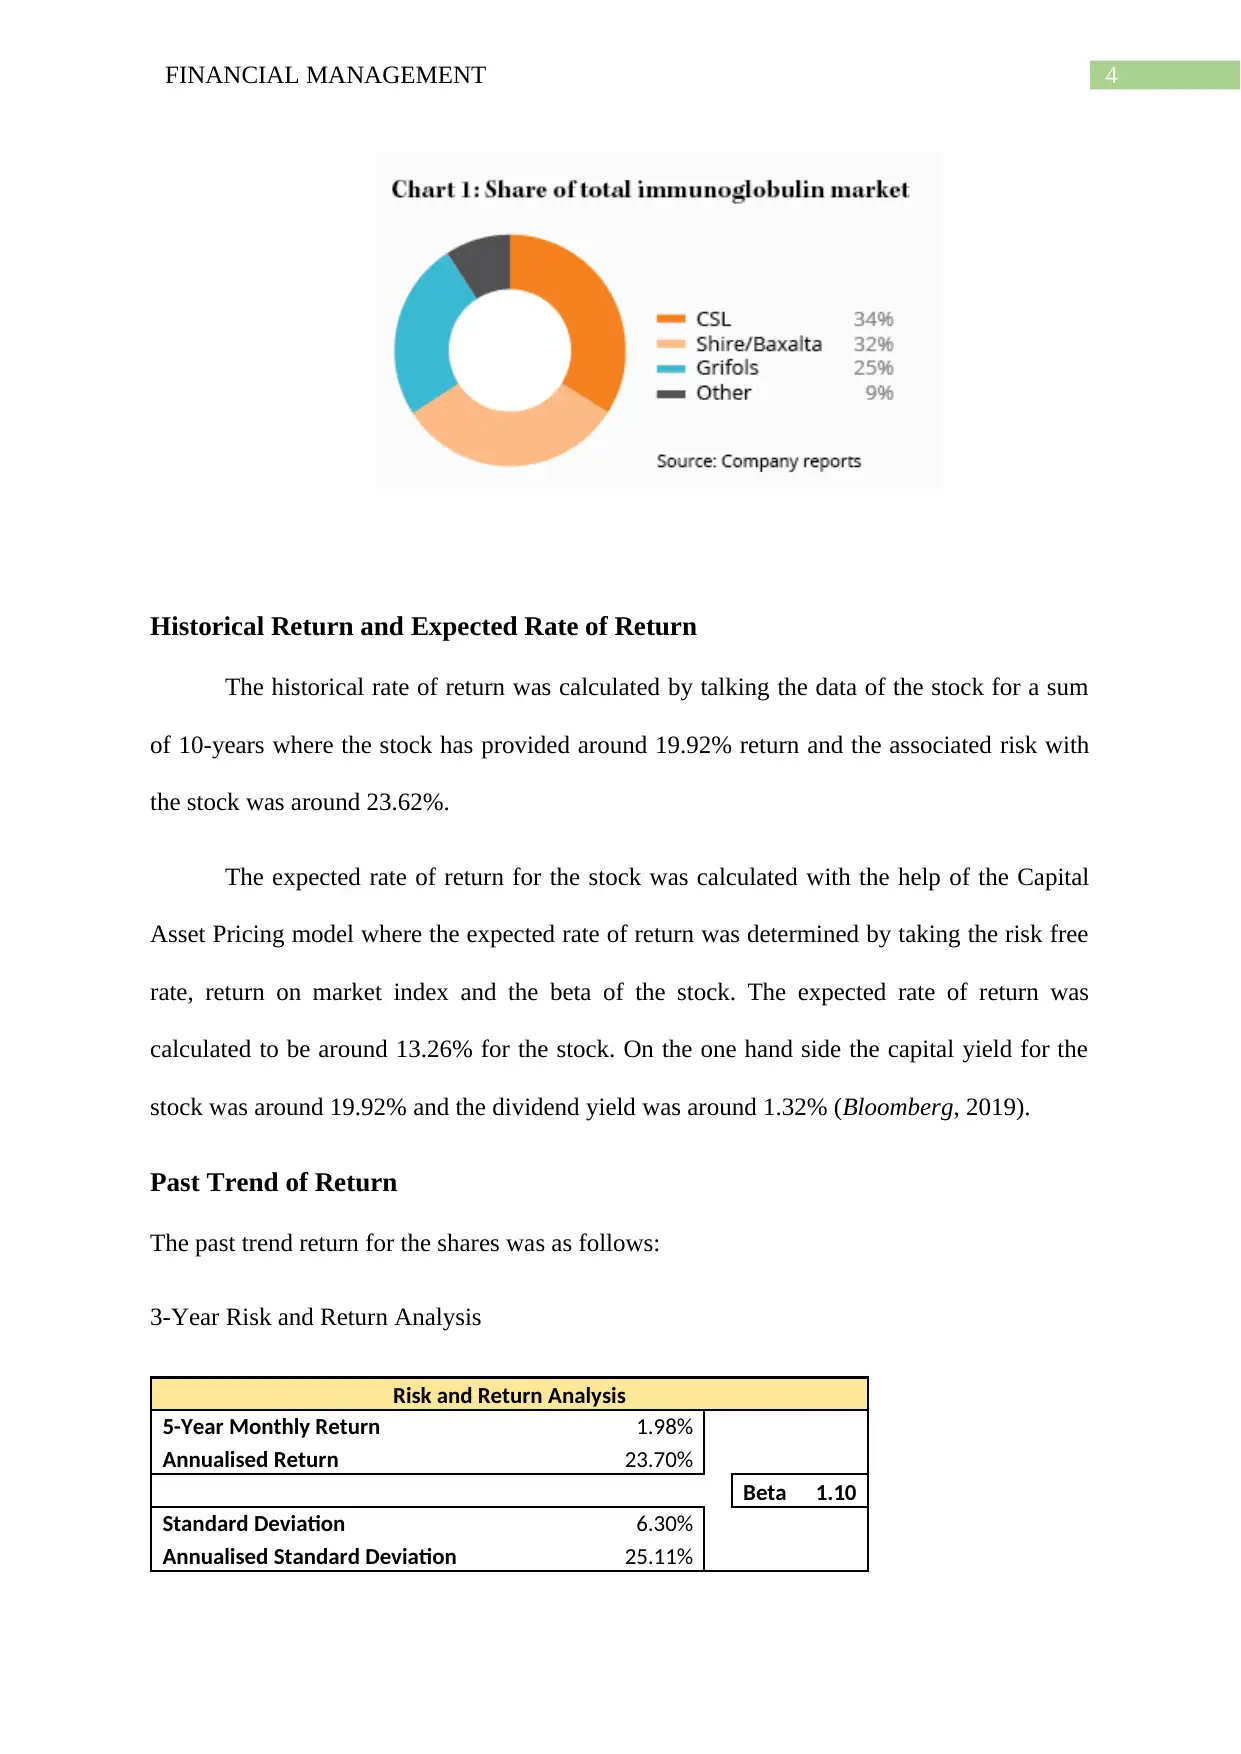
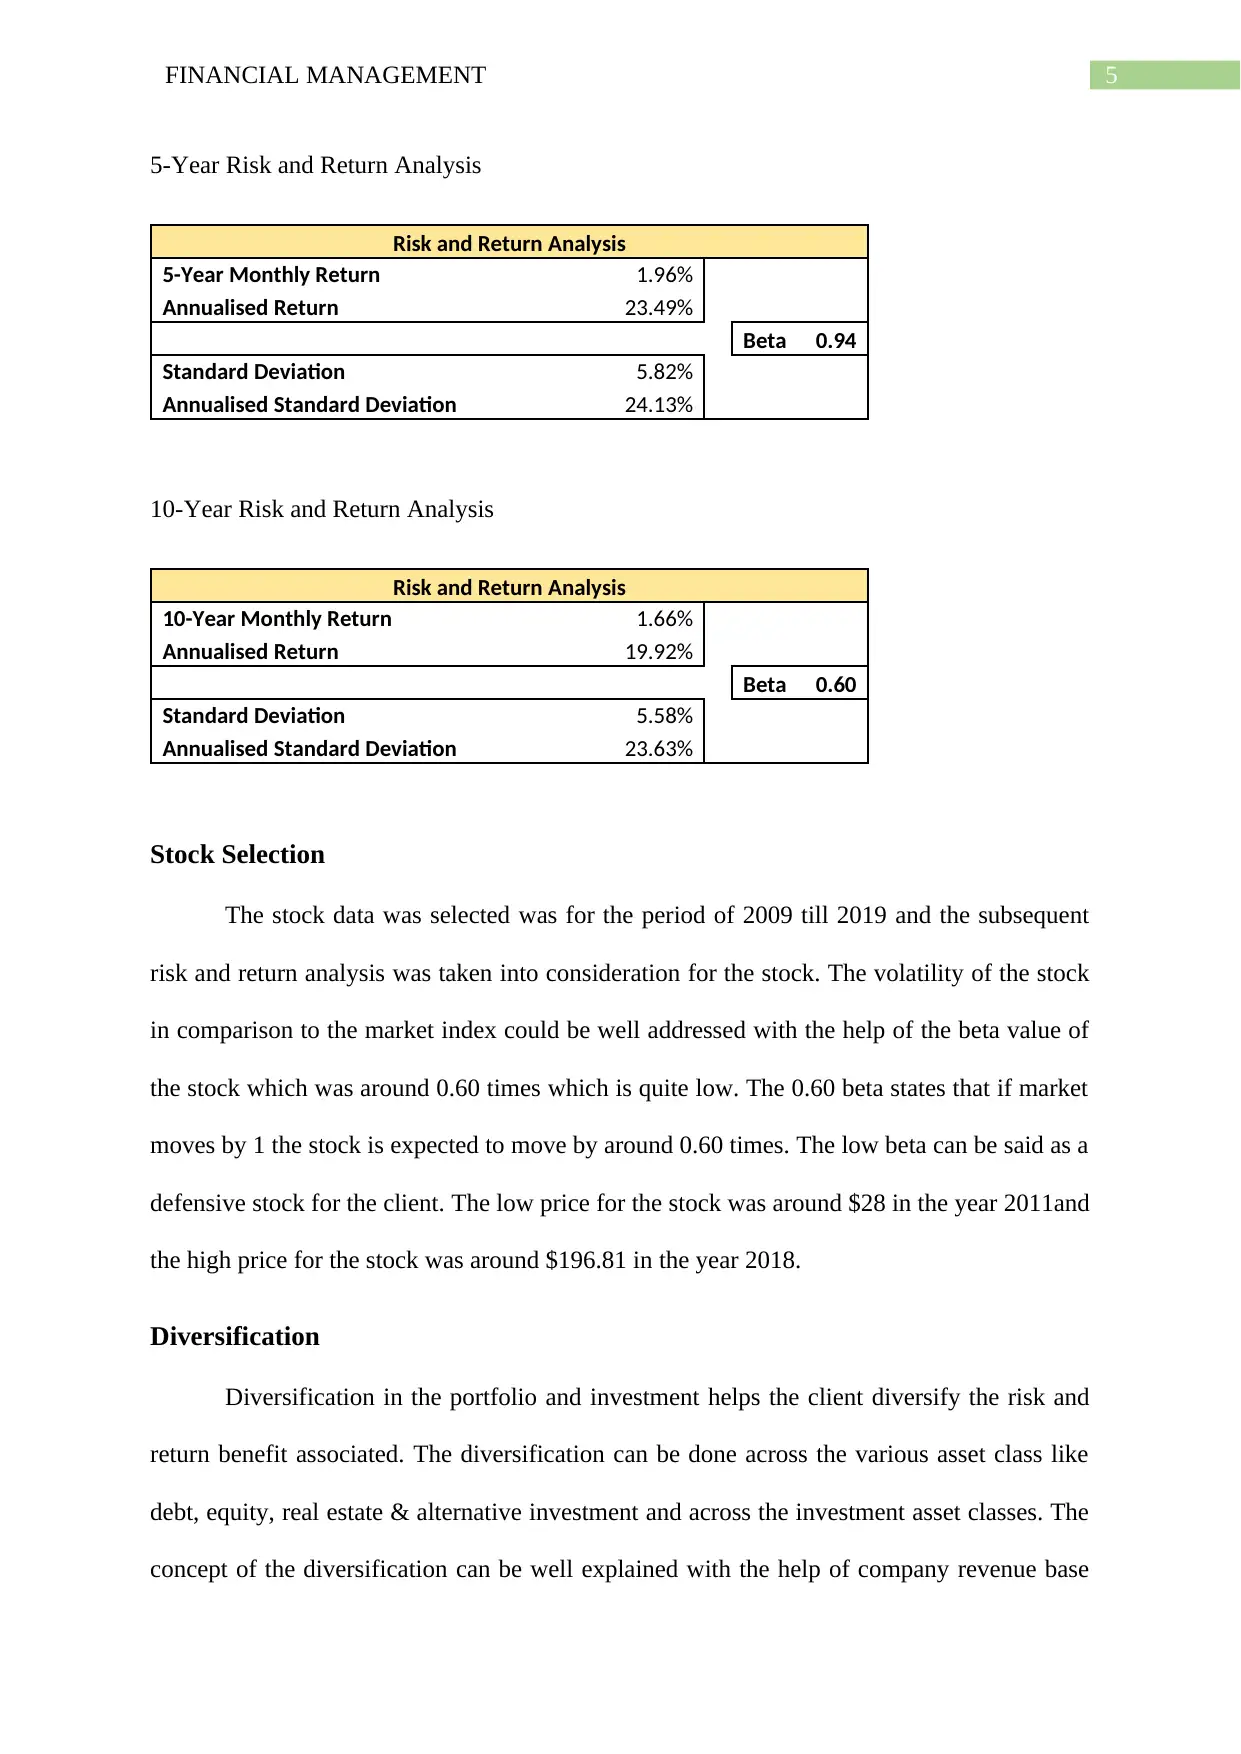
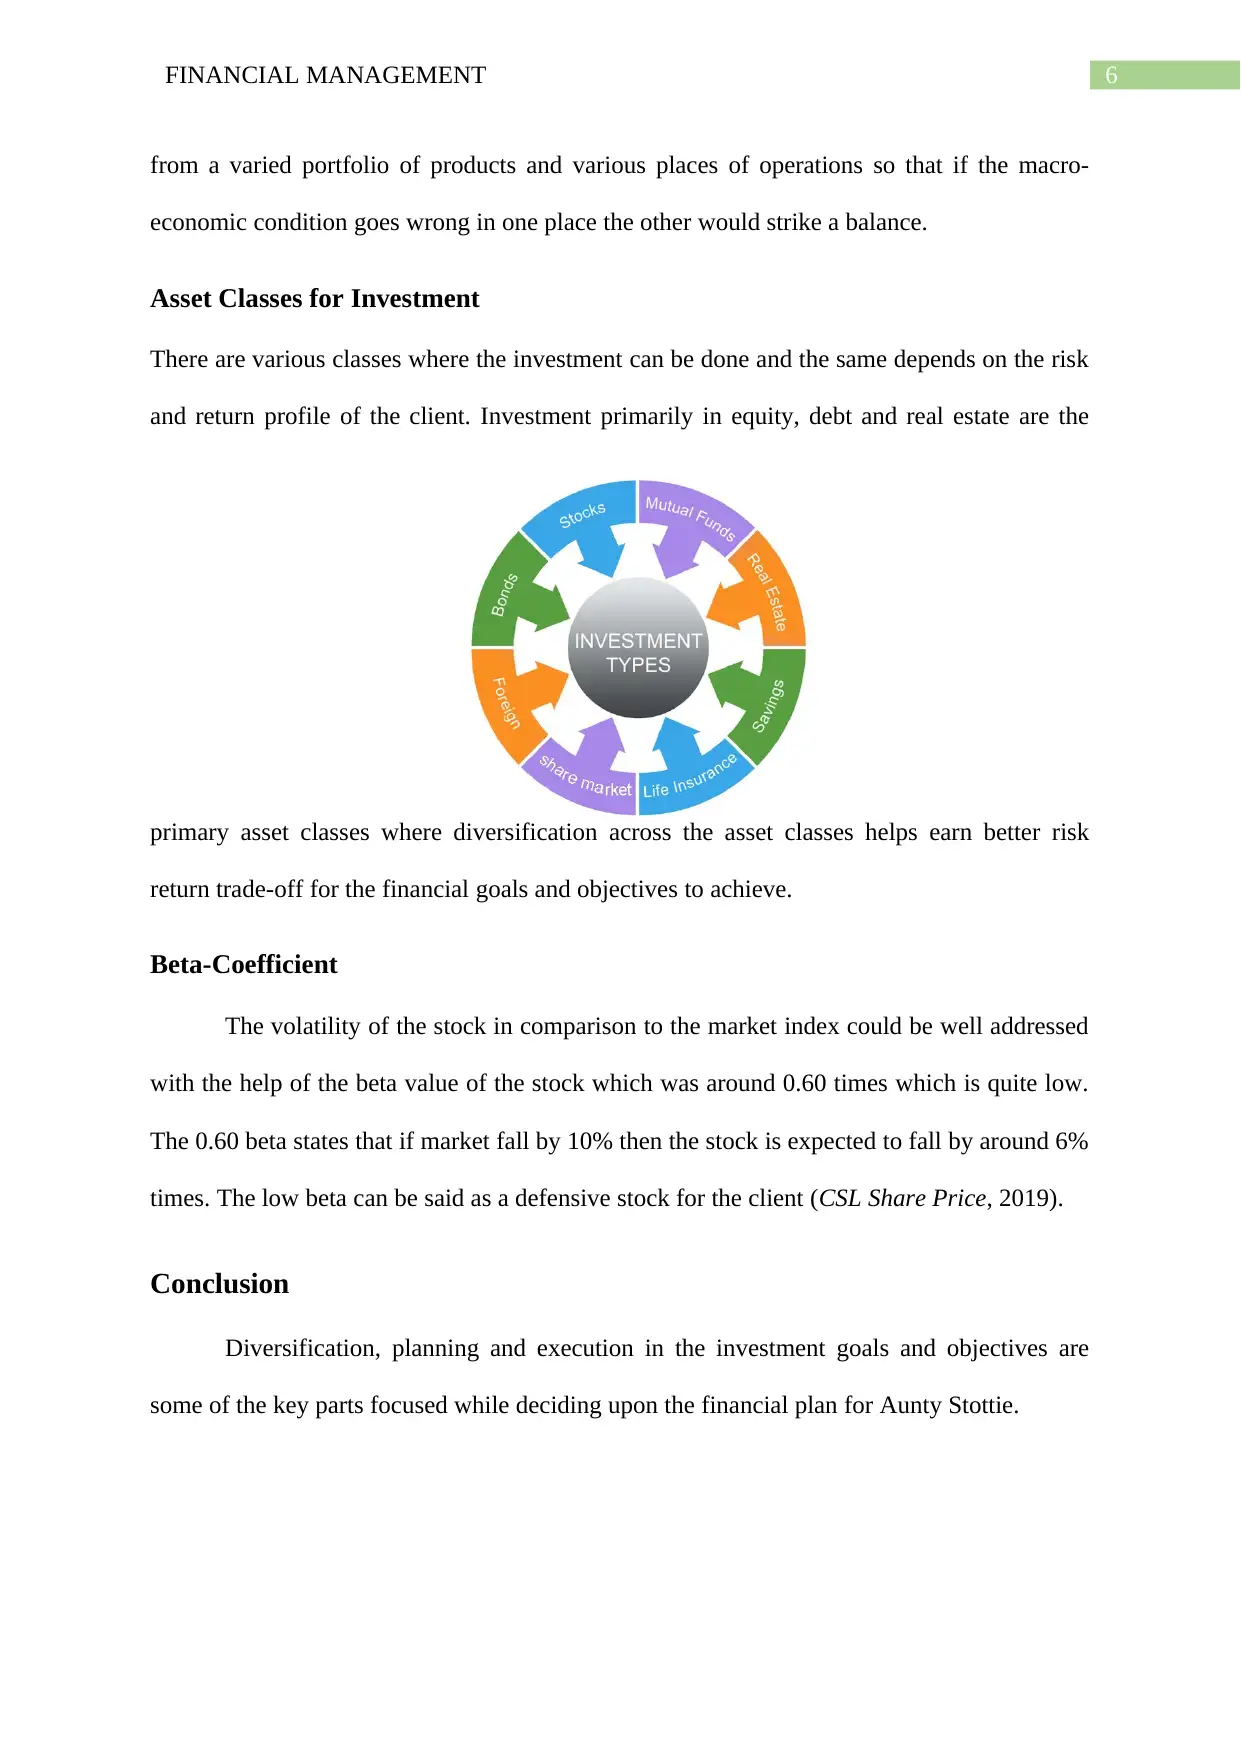
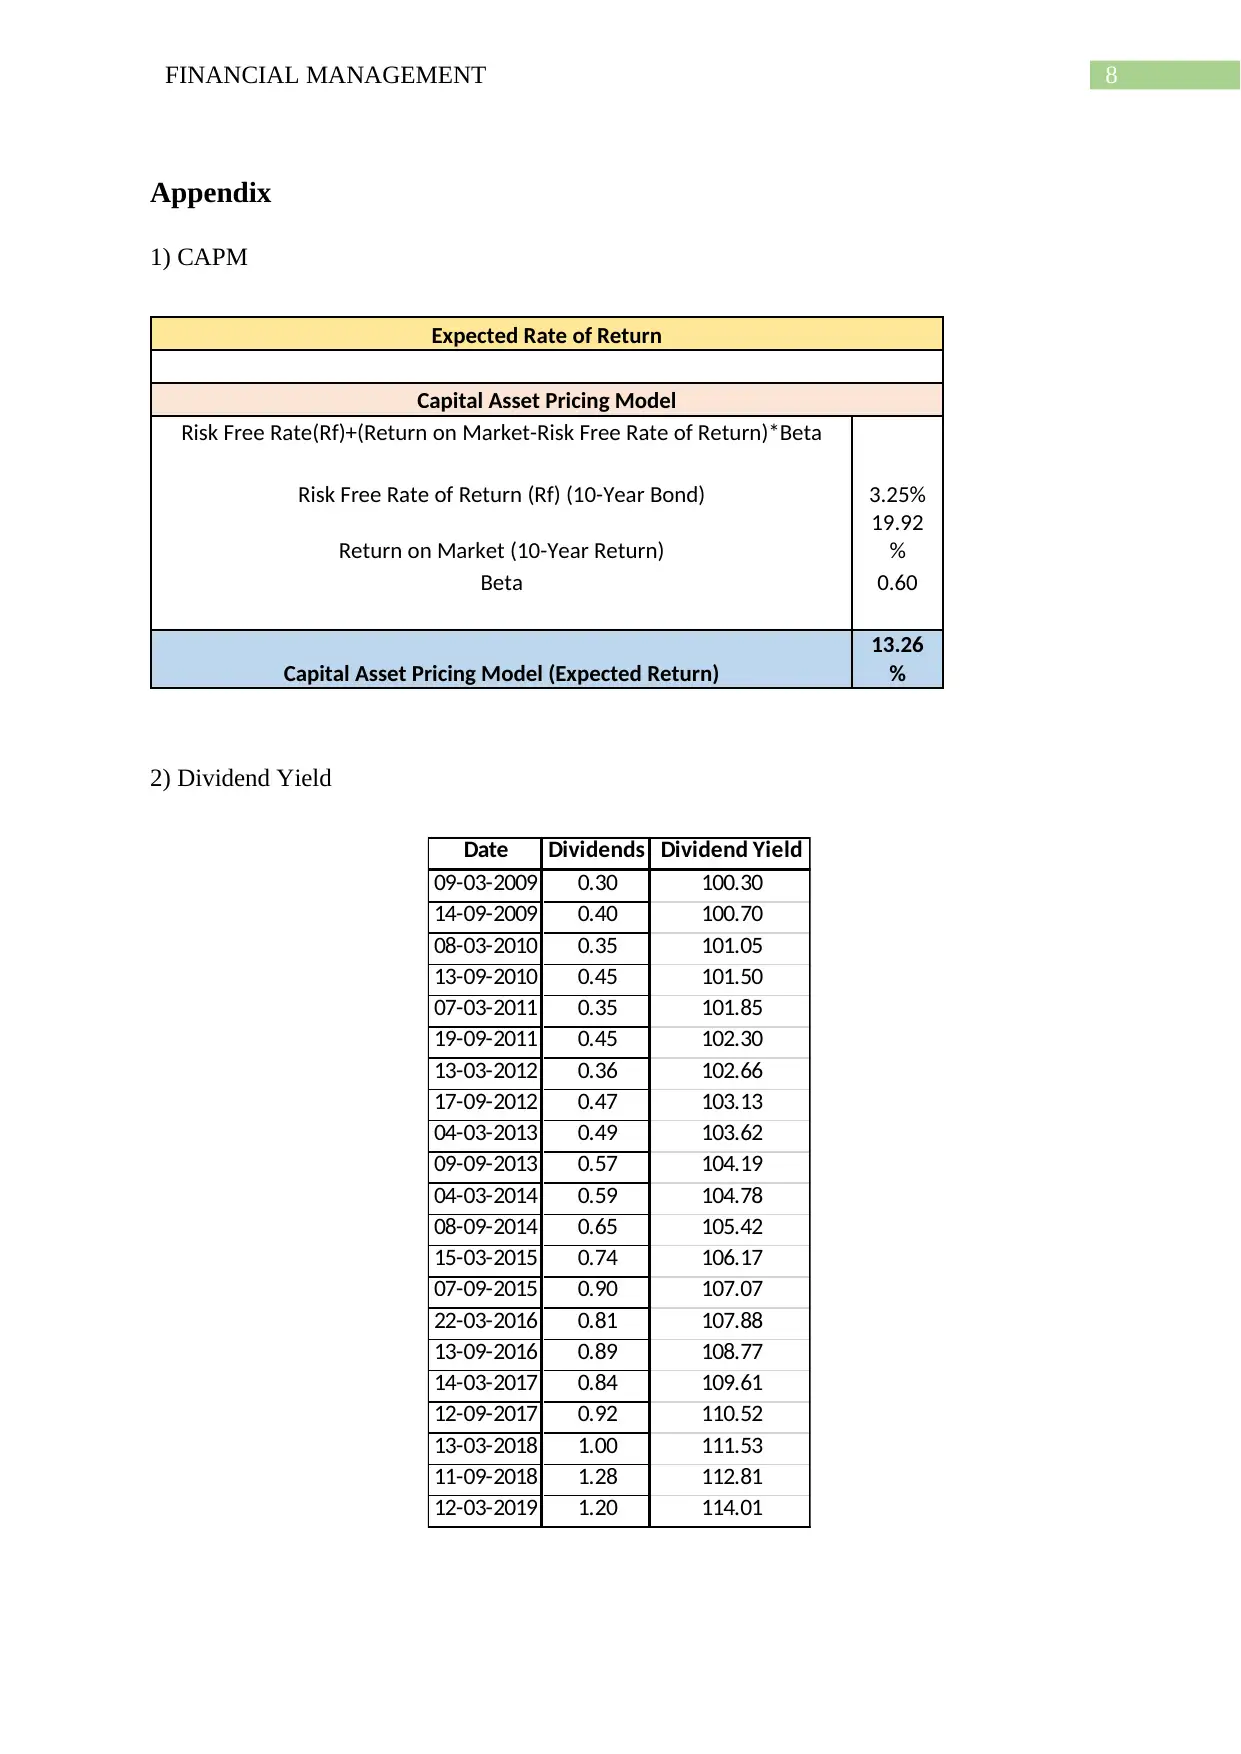
This financial management report provides investment advice for Mrs. Stottie, focusing on investment in CSL Limited, a biotechnical company listed on the Australian Stock Exchange (ASX). The report analyzes macro-economic and industry-specific factors influencing CSL's operations, including GDP growth, inflation, competition in the healthcare sector, and government policies. Firm-specific risks, such as demand for antibiotics and antibody products, are also assessed. The report includes a historical return analysis, expected rate of return calculation using the Capital Asset Pricing Model (CAPM), and a discussion of stock selection based on risk and return. Portfolio diversification across asset classes like equity, debt, and real estate is recommended to mitigate risk. The report concludes by emphasizing the importance of diversification, planning, and execution in achieving investment goals and objectives. This document is available on Desklib, a platform offering study tools and solved assignments for students.
Document Page
Running head: PRINCIPLES OF FINANCIAL MANAGEMENT
Financial Management
Name of the Student:
Name of the University:
Author’s Note:
tabler-icon-diamond-filled.svg

Secure Best Marks with AI Grader

Need help grading? Try our AI Grader for instant feedback on your assignments.
Document Page
1FINANCIAL MANAGEMENT
Table of Contents
Introduction................................................................................................................................2
Discussion..................................................................................................................................2
Macro-Economic and Industry Factors..................................................................................2
Firm Specific Factors.............................................................................................................3
Historical Return and Expected Rate of Return.....................................................................3
Past Trend of Return..............................................................................................................4
Stock Selection.......................................................................................................................5
Diversification........................................................................................................................5
Asset Classes for Investment.................................................................................................5
Beta-Coefficient.....................................................................................................................6
Conclusion..................................................................................................................................6
References..................................................................................................................................7
Appendix....................................................................................................................................8
Document Page
2FINANCIAL MANAGEMENT
Introduction
Financial Management is a key process involving planning, organising, controlling
and monitoring financial resources within the aim of achieving desired financial goals and
objectives. The financial advisory report would be prepared for Mrs Stottie where investment
guidance and financial management advisory would be given to her for better planning and
organising of the various activities of her financial goals. The investment would be done in
the CSL Limited listed in the Australian Stock Exchange is a biotechnical company that is
into researching developing products that helps treatment of several medical conditions (CSL
Limited, 2019).
Discussion
Macro-Economic and Industry Factors
The possible macro-economic factors that can significantly influence the operations of
the company will be the GDP growth rate, inflation rate, unemployment rate and international
trade condition in the global conditions. The industry factors that can affect the operations of
the company is the increasing competition in the health care sector and the policy followed
by the government in specific to the healthcare industry. Changes in macroeconomic
conditions in the US and Australia would be significantly affecting the operations of the
company.
Document Page
3FINANCIAL MANAGEMENT
Firm Specific Factors
The key firm specific risks that are associated with the company is that of the growth
of demand for antibiotics and antibody business. The firm has a wide range of
immunoglobulins, antibodies that are a part of molecules used in the treatment of immune
system. CSL Behring is the main profitable engine of the company where the majority of the
revenue for the company comes from two products like Privigen and Hizentra. Growing
research and development and increased focus on the protein based antibiotics called FcRn
are some of the product which directly affect the sales of Privigen, Hizentra and other
antibiotics products that the company has in the portfolio of products (CSL: the bear case
and why we aren't worried, 2019). Thus, it is essential to conduct a industry wide continuous
research and development in the health care industry and the subsequent effect on the sales
and operations of the company.
tabler-icon-diamond-filled.svg

Secure Best Marks with AI Grader

Need help grading? Try our AI Grader for instant feedback on your assignments.
Document Page
4FINANCIAL MANAGEMENT
Historical Return and Expected Rate of Return
The historical rate of return was calculated by talking the data of the stock for a sum
of 10-years where the stock has provided around 19.92% return and the associated risk with
the stock was around 23.62%.
The expected rate of return for the stock was calculated with the help of the Capital
Asset Pricing model where the expected rate of return was determined by taking the risk free
rate, return on market index and the beta of the stock. The expected rate of return was
calculated to be around 13.26% for the stock. On the one hand side the capital yield for the
stock was around 19.92% and the dividend yield was around 1.32% (Bloomberg, 2019).
Past Trend of Return
The past trend return for the shares was as follows:
3-Year Risk and Return Analysis
Risk and Return Analysis
5-Year Monthly Return 1.98%
Annualised Return 23.70%
Beta 1.10
Standard Deviation 6.30%
Annualised Standard Deviation 25.11%
Document Page
5FINANCIAL MANAGEMENT
5-Year Risk and Return Analysis
Risk and Return Analysis
5-Year Monthly Return 1.96%
Annualised Return 23.49%
Beta 0.94
Standard Deviation 5.82%
Annualised Standard Deviation 24.13%
10-Year Risk and Return Analysis
Risk and Return Analysis
10-Year Monthly Return 1.66%
Annualised Return 19.92%
Beta 0.60
Standard Deviation 5.58%
Annualised Standard Deviation 23.63%
Stock Selection
The stock data was selected was for the period of 2009 till 2019 and the subsequent
risk and return analysis was taken into consideration for the stock. The volatility of the stock
in comparison to the market index could be well addressed with the help of the beta value of
the stock which was around 0.60 times which is quite low. The 0.60 beta states that if market
moves by 1 the stock is expected to move by around 0.60 times. The low beta can be said as a
defensive stock for the client. The low price for the stock was around $28 in the year 2011and
the high price for the stock was around $196.81 in the year 2018.
Diversification
Diversification in the portfolio and investment helps the client diversify the risk and
return benefit associated. The diversification can be done across the various asset class like
debt, equity, real estate & alternative investment and across the investment asset classes. The
concept of the diversification can be well explained with the help of company revenue base
Document Page
6FINANCIAL MANAGEMENT
from a varied portfolio of products and various places of operations so that if the macro-
economic condition goes wrong in one place the other would strike a balance.
Asset Classes for Investment
There are various classes where the investment can be done and the same depends on the risk
and return profile of the client. Investment primarily in equity, debt and real estate are the
primary asset classes where diversification across the asset classes helps earn better risk
return trade-off for the financial goals and objectives to achieve.
Beta-Coefficient
The volatility of the stock in comparison to the market index could be well addressed
with the help of the beta value of the stock which was around 0.60 times which is quite low.
The 0.60 beta states that if market fall by 10% then the stock is expected to fall by around 6%
times. The low beta can be said as a defensive stock for the client (CSL Share Price, 2019).
Conclusion
Diversification, planning and execution in the investment goals and objectives are
some of the key parts focused while deciding upon the financial plan for Aunty Stottie.
tabler-icon-diamond-filled.svg

Paraphrase This Document

Need a fresh take? Get an instant paraphrase of this document with our AI Paraphraser
Document Page
7FINANCIAL MANAGEMENT
References
CSL: the bear case and why we aren't worried. (2019). Nabtrade.com.au. Retrieved 29 May
2019, from
https://www.nabtrade.com.au/investor/insights/latest-news/news/2018/12/
csl_the_bear_casea
CSL Share Price. (2019). Au.finance.yahoo.com. Retrieved 29 May 2019, from
https://au.finance.yahoo.com/quote/CSL.AX/history?
period1=1235845800&period2=1553970600&in
Bloomberg. (2019). Bloomberg.com. Retrieved 29 May 2019, from
https://www.bloomberg.com/markets/rates-bonds/government-bonds/australia
CSL Limited. (2019). Retrieved 29 May 2019, from https://www.csl.com/
Document Page
8FINANCIAL MANAGEMENT
Appendix
1) CAPM
Expected Rate of Return
Capital Asset Pricing Model
Risk Free Rate(Rf)+(Return on Market-Risk Free Rate of Return)*Beta
Risk Free Rate of Return (Rf) (10-Year Bond) 3.25%
Return on Market (10-Year Return)
19.92
%
Beta 0.60
Capital Asset Pricing Model (Expected Return)
13.26
%
2) Dividend Yield
Date Dividends Dividend Yield
09-03-2009 0.30 100.30
14-09-2009 0.40 100.70
08-03-2010 0.35 101.05
13-09-2010 0.45 101.50
07-03-2011 0.35 101.85
19-09-2011 0.45 102.30
13-03-2012 0.36 102.66
17-09-2012 0.47 103.13
04-03-2013 0.49 103.62
09-09-2013 0.57 104.19
04-03-2014 0.59 104.78
08-09-2014 0.65 105.42
15-03-2015 0.74 106.17
07-09-2015 0.90 107.07
22-03-2016 0.81 107.88
13-09-2016 0.89 108.77
14-03-2017 0.84 109.61
12-09-2017 0.92 110.52
13-03-2018 1.00 111.53
11-09-2018 1.28 112.81
12-03-2019 1.20 114.01
chevron_up_icon
1 out of 9
circle_padding
hide_on_mobile
zoom_out_icon
logo.png

Your All-in-One AI-Powered Toolkit for Academic Success.

Available 24*7 on WhatsApp / Email

[object Object]