Comparative Analysis of Investment Appraisal Methods and Techniques
VerifiedAdded on 2021/02/21
|12
|3005
|89
Report
AI Summary
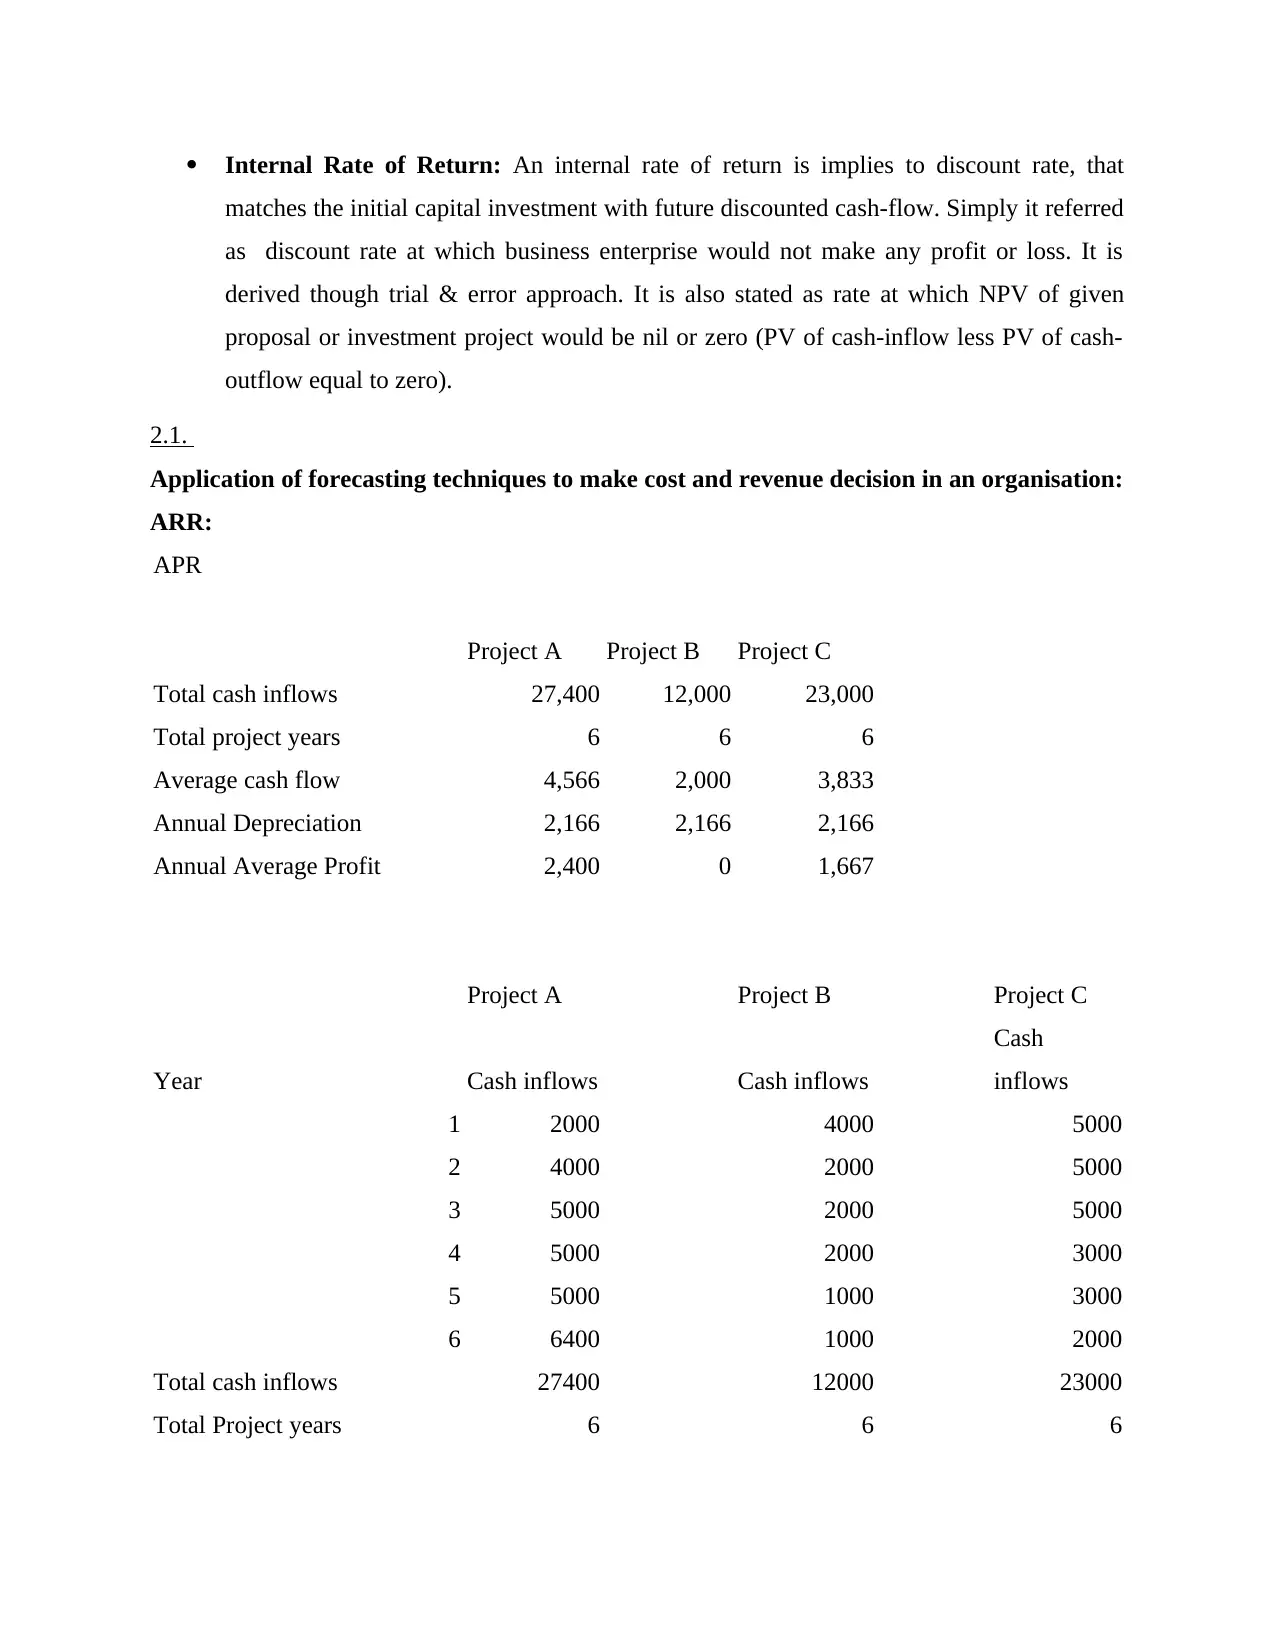
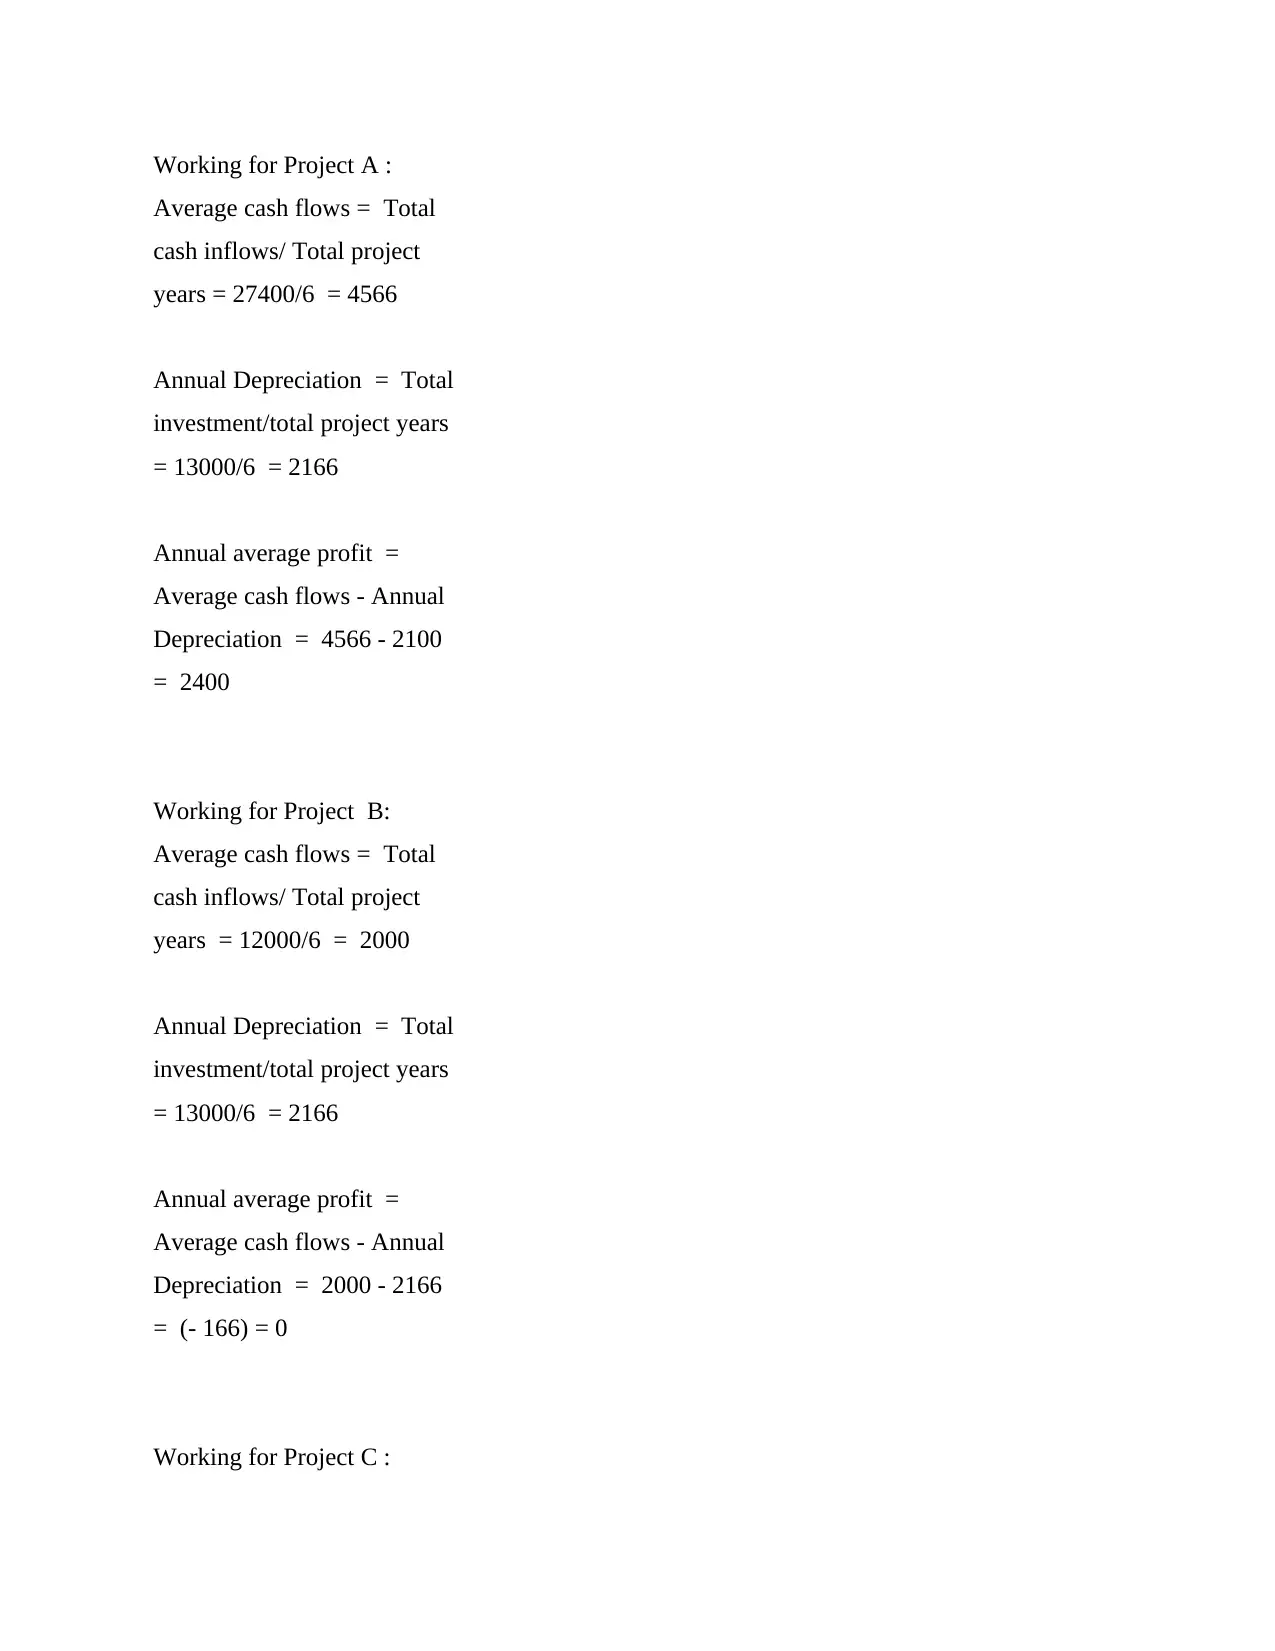
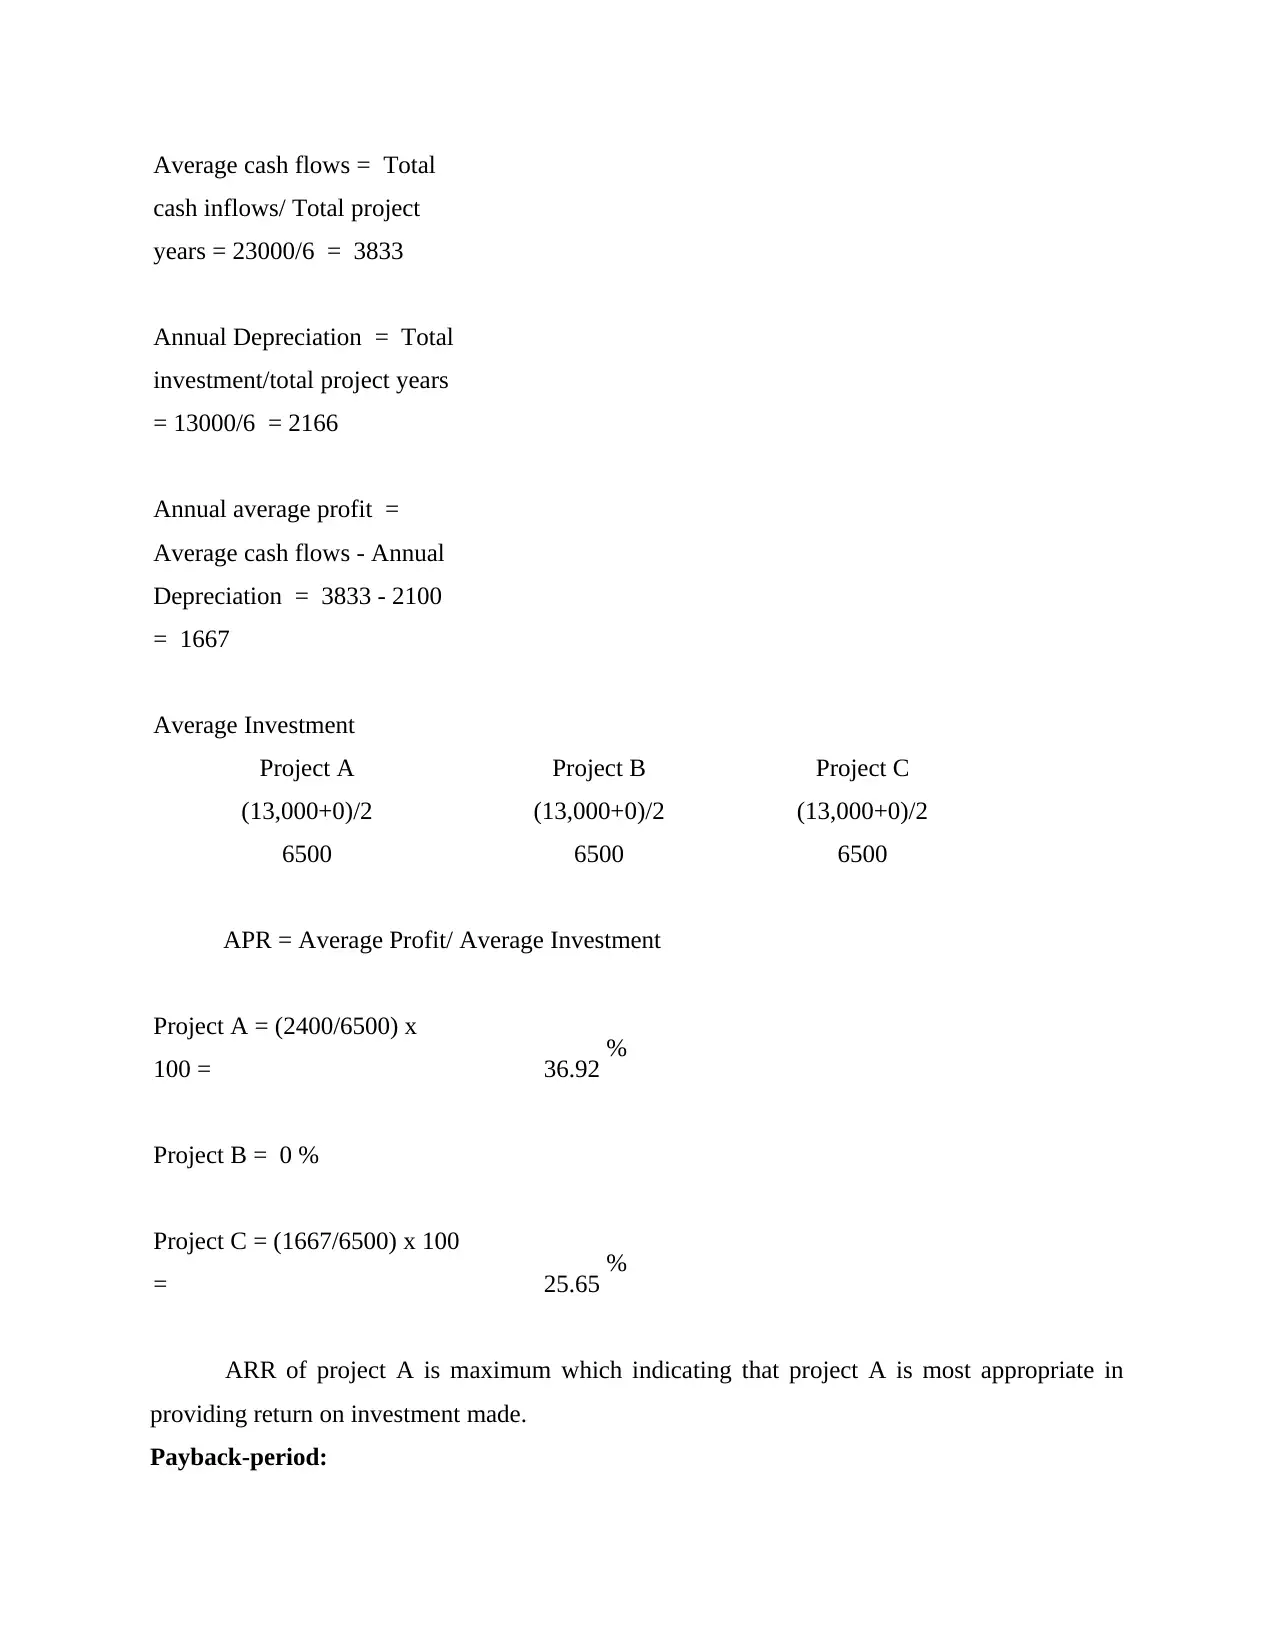
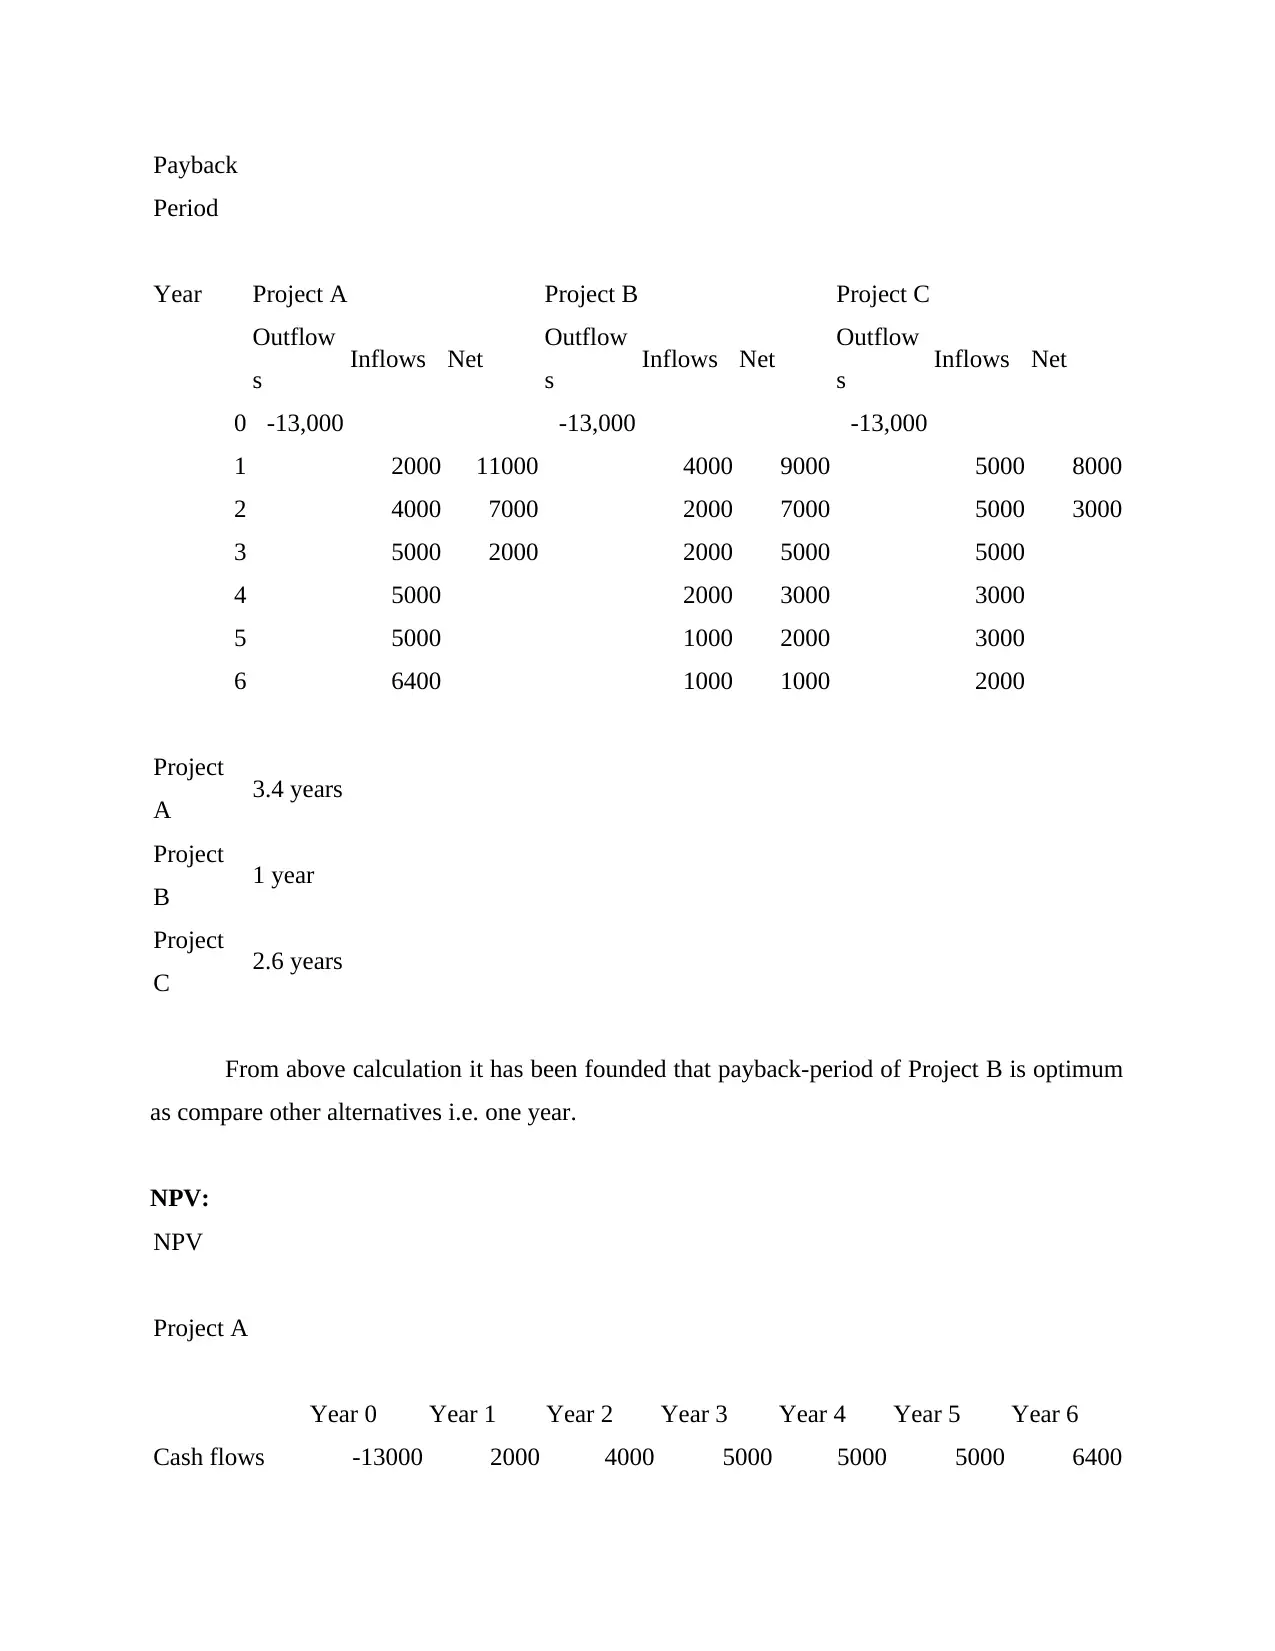
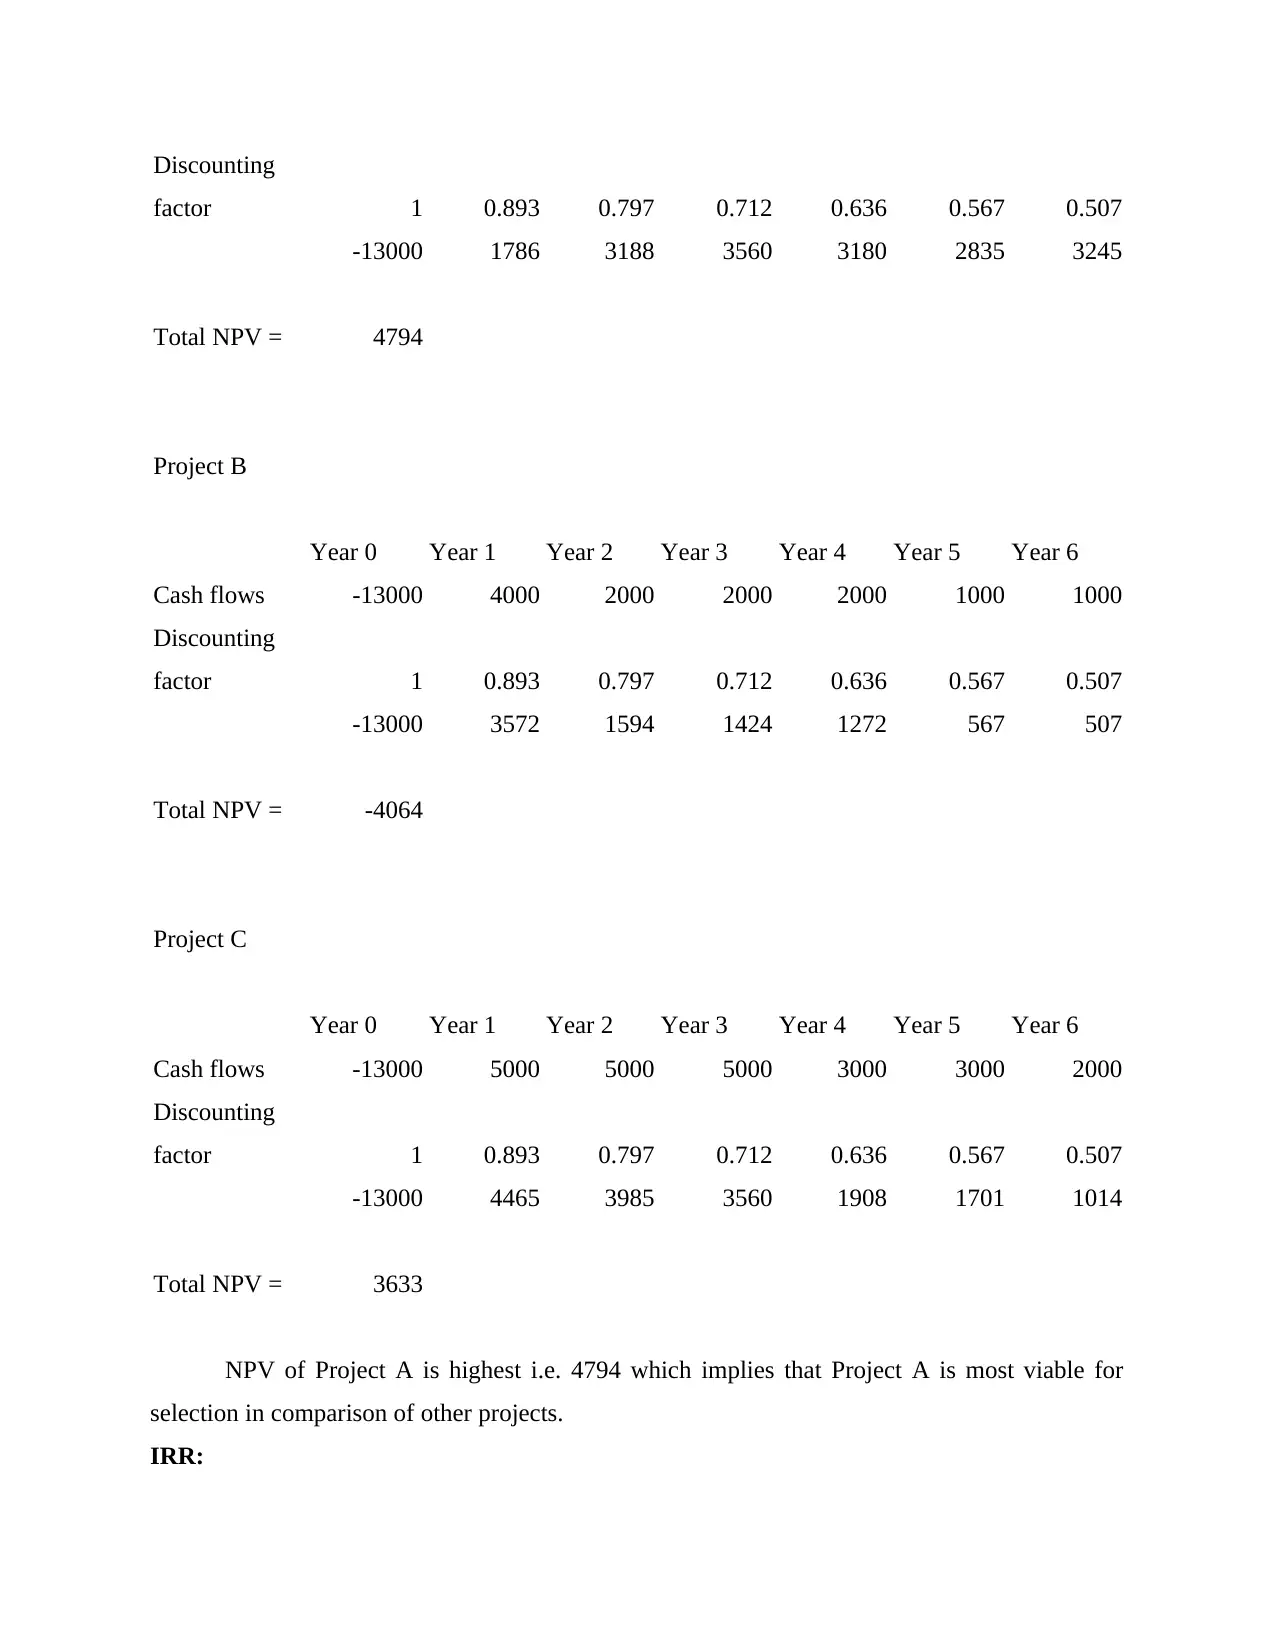
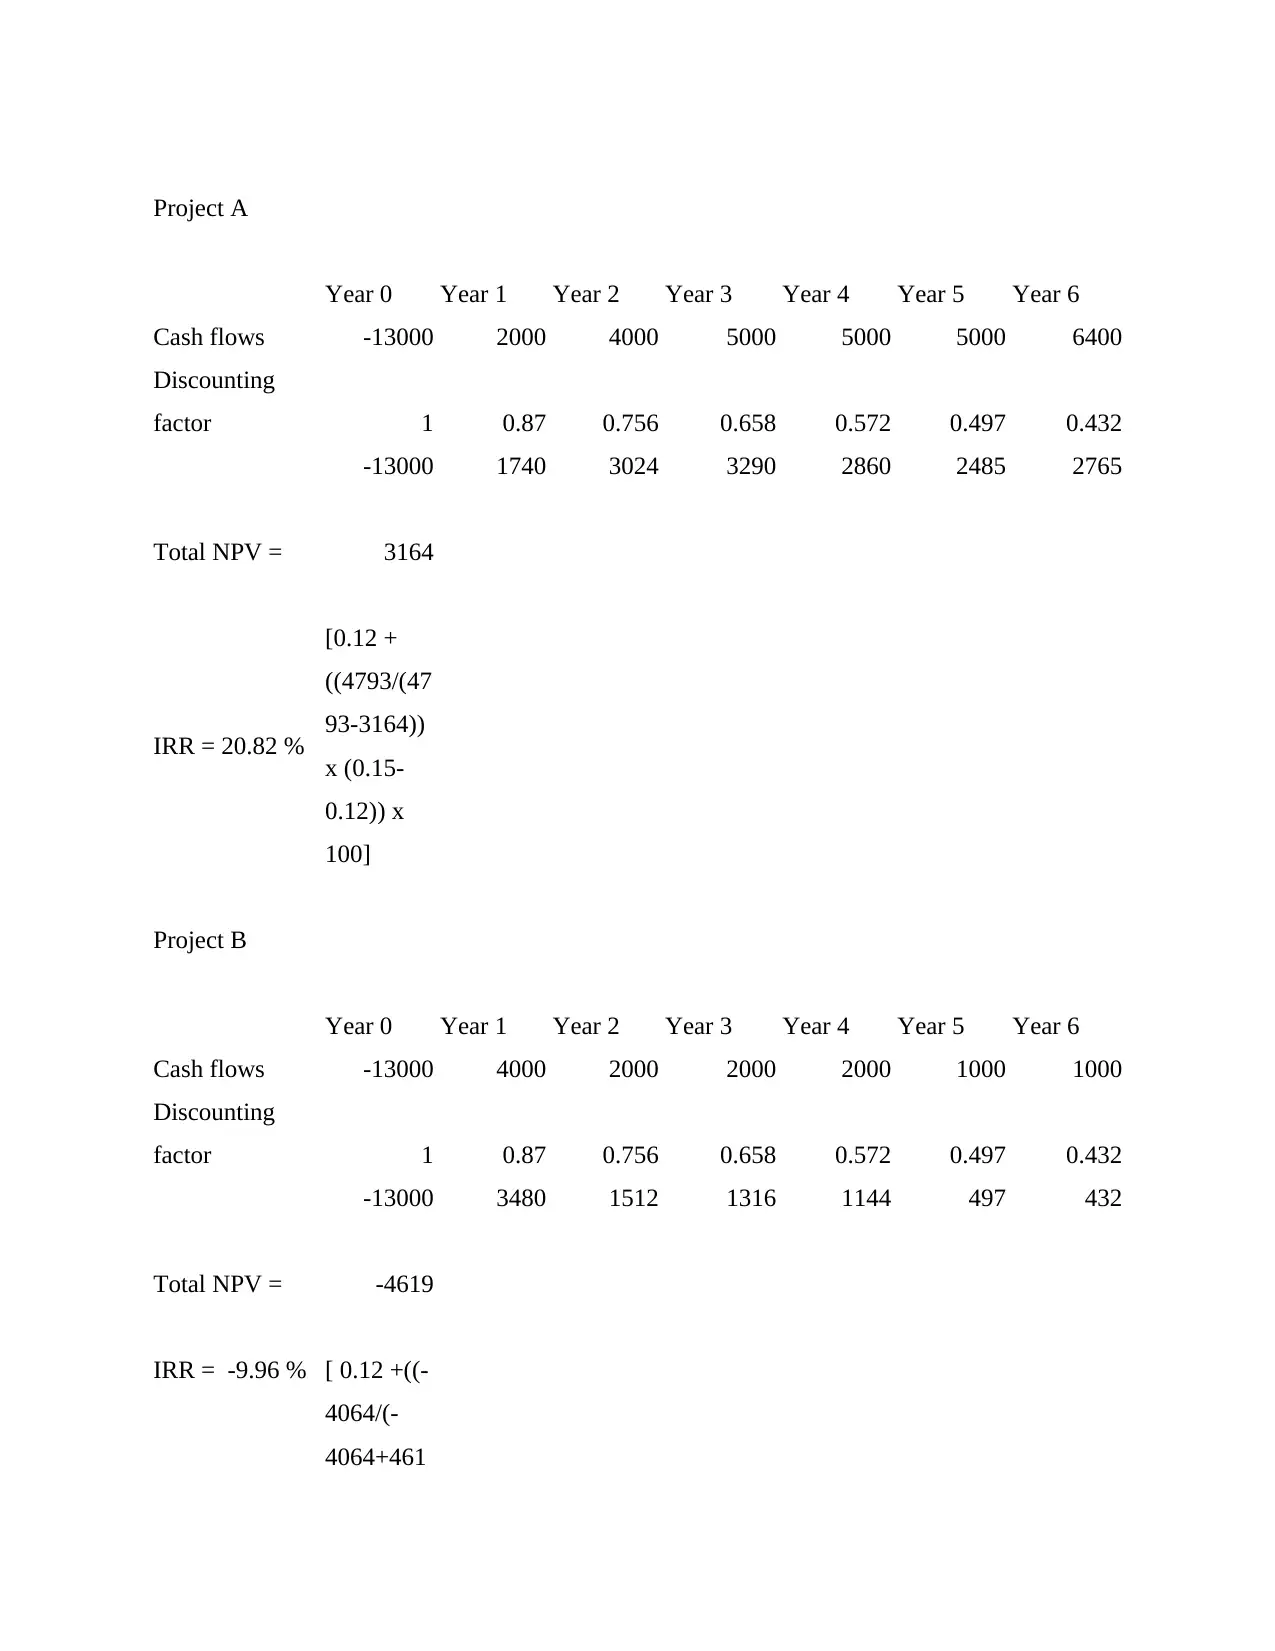
This report provides a comprehensive analysis of investment appraisal methods used to assess the attractiveness of investments. It explores various techniques, including Payback Period, Accounting Rate of Return (ARR), Net Present Value (NPV), and Internal Rate of Return (IRR). The report delves into the application of forecasting techniques for making cost and revenue decisions within an organization. It includes detailed calculations and evaluations of example projects, comparing their financial viability based on the different appraisal methods. The analysis covers ARR, Payback Period, NPV, and IRR to determine the most suitable investment options. The report concludes with recommendations on how companies can efficiently obtain funds for financing projects, providing a valuable resource for understanding and applying investment appraisal techniques in both public and private sectors. The document is contributed by a student to be published on the website Desklib.

Investment
Appraisal
Appraisal
Paraphrase This Document
Need a fresh take? Get an instant paraphrase of this document with our AI Paraphraser

Table of Contents
INTRODUCTION...........................................................................................................................3
TASK...............................................................................................................................................3
5.1. .........................................................................................................................................3
2.1. .........................................................................................................................................4
5.2. .........................................................................................................................................9
2.2 ..........................................................................................................................................9
2.2.........................................................................................................................................10
CONCLUSION..............................................................................................................................11
REFERENCES..............................................................................................................................12

INTRODUCTION
Investment Appraisal relates to set of procedures used to assess an investment's
attractiveness. In the framework of a business, the main aim of the it is to value advantages or
benefits in order to justify overall business expenses (Li and Trutnevyte, 2017). The study covers
discussion upon major methods of investment appraisal, evaluation and recommendation about
each specific projects provided and efficient manner though which company may obtain funds
for financing projects.
TASK
5.1.
Financial appraisal methods to analyse competing investment projects in the public and
private sector:
In modern era, different business organisations are applying various short of methods of
investment appraisal. Use of these facilitates selection of appropriate investment, project or
proposal. Before applying such different methods managerial personnels should analyse the core
use of such methods and asses which is most suitable method for given investment proposals and
projects. Major investment appraisals are Accounting-rate of return, IRR, Net-present value,
payback period etc (Hoesli and MacGregor, 2014). Following is discussion on such different
methods, as follows:
Payback Period: One of the quickest tools of investment appraisal is payback-period.
Payback method demonstrates how long it would take for any project or investment
proposal to produce enough cash-flow to compensate the project's original price.
Accounting Rate of Return: ARR implies to method which defines expected amount of
profit from any proposal or investment. It exhibits net-accounting profit generating from
different investment proposals as specific percent of investment made in project. This
techniques also called as return on capital or investment return.
Net Present Value: This is most commonly applied technique of investment-appraisal.
NPV is simply aggregate amount of PV-discounted future outflow and inflow of cash
associated with proposal or project. Normally weighted-average capital cost( WACC ) is
regarded as PV-discounting factor with respect to future expected cash-flows under net-
present value technique.
⊘ This is a preview!⊘
Do you want full access?
Subscribe today to unlock all pages.

Trusted by 1+ million students worldwide

Internal Rate of Return: An internal rate of return is implies to discount rate, that
matches the initial capital investment with future discounted cash-flow. Simply it referred
as discount rate at which business enterprise would not make any profit or loss. It is
derived though trial & error approach. It is also stated as rate at which NPV of given
proposal or investment project would be nil or zero (PV of cash-inflow less PV of cash-
outflow equal to zero).
2.1.
Application of forecasting techniques to make cost and revenue decision in an organisation:
ARR:
APR
Project A Project B Project C
Total cash inflows 27,400 12,000 23,000
Total project years 6 6 6
Average cash flow 4,566 2,000 3,833
Annual Depreciation 2,166 2,166 2,166
Annual Average Profit 2,400 0 1,667
Project A Project B Project C
Year Cash inflows Cash inflows
Cash
inflows
1 2000 4000 5000
2 4000 2000 5000
3 5000 2000 5000
4 5000 2000 3000
5 5000 1000 3000
6 6400 1000 2000
Total cash inflows 27400 12000 23000
Total Project years 6 6 6
Paraphrase This Document
Need a fresh take? Get an instant paraphrase of this document with our AI Paraphraser

Working for Project A :
Average cash flows = Total
cash inflows/ Total project
years = 27400/6 = 4566
Annual Depreciation = Total
investment/total project years
= 13000/6 = 2166
Annual average profit =
Average cash flows - Annual
Depreciation = 4566 - 2100
= 2400
Working for Project B:
Average cash flows = Total
cash inflows/ Total project
years = 12000/6 = 2000
Annual Depreciation = Total
investment/total project years
= 13000/6 = 2166
Annual average profit =
Average cash flows - Annual
Depreciation = 2000 - 2166
= (- 166) = 0
Working for Project C :
Average cash flows = Total
cash inflows/ Total project
years = 27400/6 = 4566
Annual Depreciation = Total
investment/total project years
= 13000/6 = 2166
Annual average profit =
Average cash flows - Annual
Depreciation = 4566 - 2100
= 2400
Working for Project B:
Average cash flows = Total
cash inflows/ Total project
years = 12000/6 = 2000
Annual Depreciation = Total
investment/total project years
= 13000/6 = 2166
Annual average profit =
Average cash flows - Annual
Depreciation = 2000 - 2166
= (- 166) = 0
Working for Project C :

Average cash flows = Total
cash inflows/ Total project
years = 23000/6 = 3833
Annual Depreciation = Total
investment/total project years
= 13000/6 = 2166
Annual average profit =
Average cash flows - Annual
Depreciation = 3833 - 2100
= 1667
Average Investment
Project A Project B Project C
(13,000+0)/2 (13,000+0)/2 (13,000+0)/2
6500 6500 6500
APR = Average Profit/ Average Investment
Project A = (2400/6500) x
100 = 36.92 %
Project B = 0 %
Project C = (1667/6500) x 100
= 25.65 %
ARR of project A is maximum which indicating that project A is most appropriate in
providing return on investment made.
Payback-period:
⊘ This is a preview!⊘
Do you want full access?
Subscribe today to unlock all pages.

Trusted by 1+ million students worldwide

Payback
Period
Year Project A Project B Project C
Outflow
s Inflows Net Outflow
s Inflows Net
0 -13,000 -13,000 -13,000
1 2000 11000 4000 9000 5000 8000
2 4000 7000 2000 7000 5000 3000
3 5000 2000 2000 5000 5000
4 5000 2000 3000 3000
5 5000 1000 2000 3000
6 6400 1000 1000 2000
Project
A 3.4 years
Project
B 1 year
Project
C 2.6 years
From above calculation it has been founded that payback-period of Project B is optimum
as compare other alternatives i.e. one year.
NPV:
NPV
Project A
Year 0 Year 1 Year 2 Year 3 Year 4 Year 5 Year 6
Cash flows -13000 2000 4000 5000 5000 5000 6400
Paraphrase This Document
Need a fresh take? Get an instant paraphrase of this document with our AI Paraphraser

Discounting
factor 1 0.893 0.797 0.712 0.636 0.567 0.507
-13000 1786 3188 3560 3180 2835 3245
Total NPV = 4794
Project B
Year 0 Year 1 Year 2 Year 3 Year 4 Year 5 Year 6
Cash flows -13000 4000 2000 2000 2000 1000 1000
Discounting
factor 1 0.893 0.797 0.712 0.636 0.567 0.507
-13000 3572 1594 1424 1272 567 507
Total NPV = -4064
Project C
Year 0 Year 1 Year 2 Year 3 Year 4 Year 5 Year 6
Cash flows -13000 5000 5000 5000 3000 3000 2000
Discounting
factor 1 0.893 0.797 0.712 0.636 0.567 0.507
-13000 4465 3985 3560 1908 1701 1014
Total NPV = 3633
NPV of Project A is highest i.e. 4794 which implies that Project A is most viable for
selection in comparison of other projects.
IRR:
factor 1 0.893 0.797 0.712 0.636 0.567 0.507
-13000 1786 3188 3560 3180 2835 3245
Total NPV = 4794
Project B
Year 0 Year 1 Year 2 Year 3 Year 4 Year 5 Year 6
Cash flows -13000 4000 2000 2000 2000 1000 1000
Discounting
factor 1 0.893 0.797 0.712 0.636 0.567 0.507
-13000 3572 1594 1424 1272 567 507
Total NPV = -4064
Project C
Year 0 Year 1 Year 2 Year 3 Year 4 Year 5 Year 6
Cash flows -13000 5000 5000 5000 3000 3000 2000
Discounting
factor 1 0.893 0.797 0.712 0.636 0.567 0.507
-13000 4465 3985 3560 1908 1701 1014
Total NPV = 3633
NPV of Project A is highest i.e. 4794 which implies that Project A is most viable for
selection in comparison of other projects.
IRR:

IRR
⊘ This is a preview!⊘
Do you want full access?
Subscribe today to unlock all pages.

Trusted by 1+ million students worldwide

Project A
Year 0 Year 1 Year 2 Year 3 Year 4 Year 5 Year 6
Cash flows -13000 2000 4000 5000 5000 5000 6400
Discounting
factor 1 0.87 0.756 0.658 0.572 0.497 0.432
-13000 1740 3024 3290 2860 2485 2765
Total NPV = 3164
IRR = 20.82 %
[0.12 +
((4793/(47
93-3164))
x (0.15-
0.12)) x
100]
Project B
Year 0 Year 1 Year 2 Year 3 Year 4 Year 5 Year 6
Cash flows -13000 4000 2000 2000 2000 1000 1000
Discounting
factor 1 0.87 0.756 0.658 0.572 0.497 0.432
-13000 3480 1512 1316 1144 497 432
Total NPV = -4619
IRR = -9.96 % [ 0.12 +((-
4064/(-
4064+461
Year 0 Year 1 Year 2 Year 3 Year 4 Year 5 Year 6
Cash flows -13000 2000 4000 5000 5000 5000 6400
Discounting
factor 1 0.87 0.756 0.658 0.572 0.497 0.432
-13000 1740 3024 3290 2860 2485 2765
Total NPV = 3164
IRR = 20.82 %
[0.12 +
((4793/(47
93-3164))
x (0.15-
0.12)) x
100]
Project B
Year 0 Year 1 Year 2 Year 3 Year 4 Year 5 Year 6
Cash flows -13000 4000 2000 2000 2000 1000 1000
Discounting
factor 1 0.87 0.756 0.658 0.572 0.497 0.432
-13000 3480 1512 1316 1144 497 432
Total NPV = -4619
IRR = -9.96 % [ 0.12 +((-
4064/(-
4064+461
Paraphrase This Document
Need a fresh take? Get an instant paraphrase of this document with our AI Paraphraser

9)) x
(0.15-
0.12)) x
x100]
Project C
Year 0 Year 1 Year 2 Year 3 Year 4 Year 5 Year 6
Cash flows -13000 5000 5000 5000 3000 3000 2000
Discounting
factor 1 0.87 0.756 0.658 0.572 0.497 0.432
-13000 4350 3780 3290 1716 1491 864
Total NPV = 2491
IRR = 21.54% [0.12+ ((3633/(3633-2491)) x (0.15-0.12) x 100]
IRR of project C is 21.54% which is highest among other projects, so IRR wise project C
is most considerable project.
5.2.
Justified strategic investment decision for an organisation using relevant financial
information:
Project A Project B Project C
IRR 20.82% -9.96% 21.54%
ARR 36.92% 0.00% 25.65%
Payback Period 3.4 years 1 year 2.6 years
NPV 4794 -4064 3633
From above summary table it is clear that project C is most efficient project, as it has
positive NPV, optimum payback period after project B ( Due to negative NPV and IRR project B
is not acceptable at all), highest IRR.

2.2
Assess the sources of funds available to an organisation for a specific project:
Selection of appropriate source of funding any project is significant task for a business
organisation, as it directly affects enterprise's existing capital structure, liquidity ratios and
solvency ratios. So management before adopting any source to get funding, should observe the
implications of selected source (Harris, 2017). Following are the major sources for enterprise to
obtain funds for recommended project:
Debt Capital: Organisation can avail for loan funding or debt-capital. Company may
take loan from banks, issue debt-bonds or debentures, loan from investors or lenders and
from local creditors. Major disadvantage of borrowing funds is amount of interest which
is required to be paid to banks, lenders or creditors. In circumstances of company fail to
repay loans or pay amount of interest could lead to bankruptcy or liquidation. However,
interest amount paid on loan or debt provides deduction in tax and expenses lower than
other capital sources.
Equity Capital: A corporation can produce cash by selling it's ownership or holdings to
shareholders, referred as equity financing, in the form of securities. The advantage of this
is that shareholders do not need repayment or payment of interest as bondholders require.
The disadvantage is that holder of securities further divided company's net profit. In
addition, equity shareholders have right to vote, that implies a business is forfeiting or
diluting part of their ownership control as company sells more securities.
Retained Earnings: Corporations exist to create a profits by selling more then it
expenses to deliver products or services. For any enterprise, it is the most elementary
funding source as well as ultimately the technique which provides the most funds and is
recognized as retained income. Such funds can be used in for dividend payments or share
repurchases to reward investors, but they're also used it to spend in projects and expand
the company.
2.2
Components of working capital and explanation about how SENSATIONS
CORPORATION can better manage its working capital to support the financing of the
chosen project:
⊘ This is a preview!⊘
Do you want full access?
Subscribe today to unlock all pages.

Trusted by 1+ million students worldwide
1 out of 12
Related Documents

Your All-in-One AI-Powered Toolkit for Academic Success.
+13062052269
info@desklib.com
Available 24*7 on WhatsApp / Email
Unlock your academic potential
Copyright © 2020–2025 A2Z Services. All Rights Reserved. Developed and managed by ZUCOL.