FIN205 Business Finance Report: Stock Market Analysis and Investment
VerifiedAdded on  2022/10/11
|13
|1614
|11
Report
AI Summary
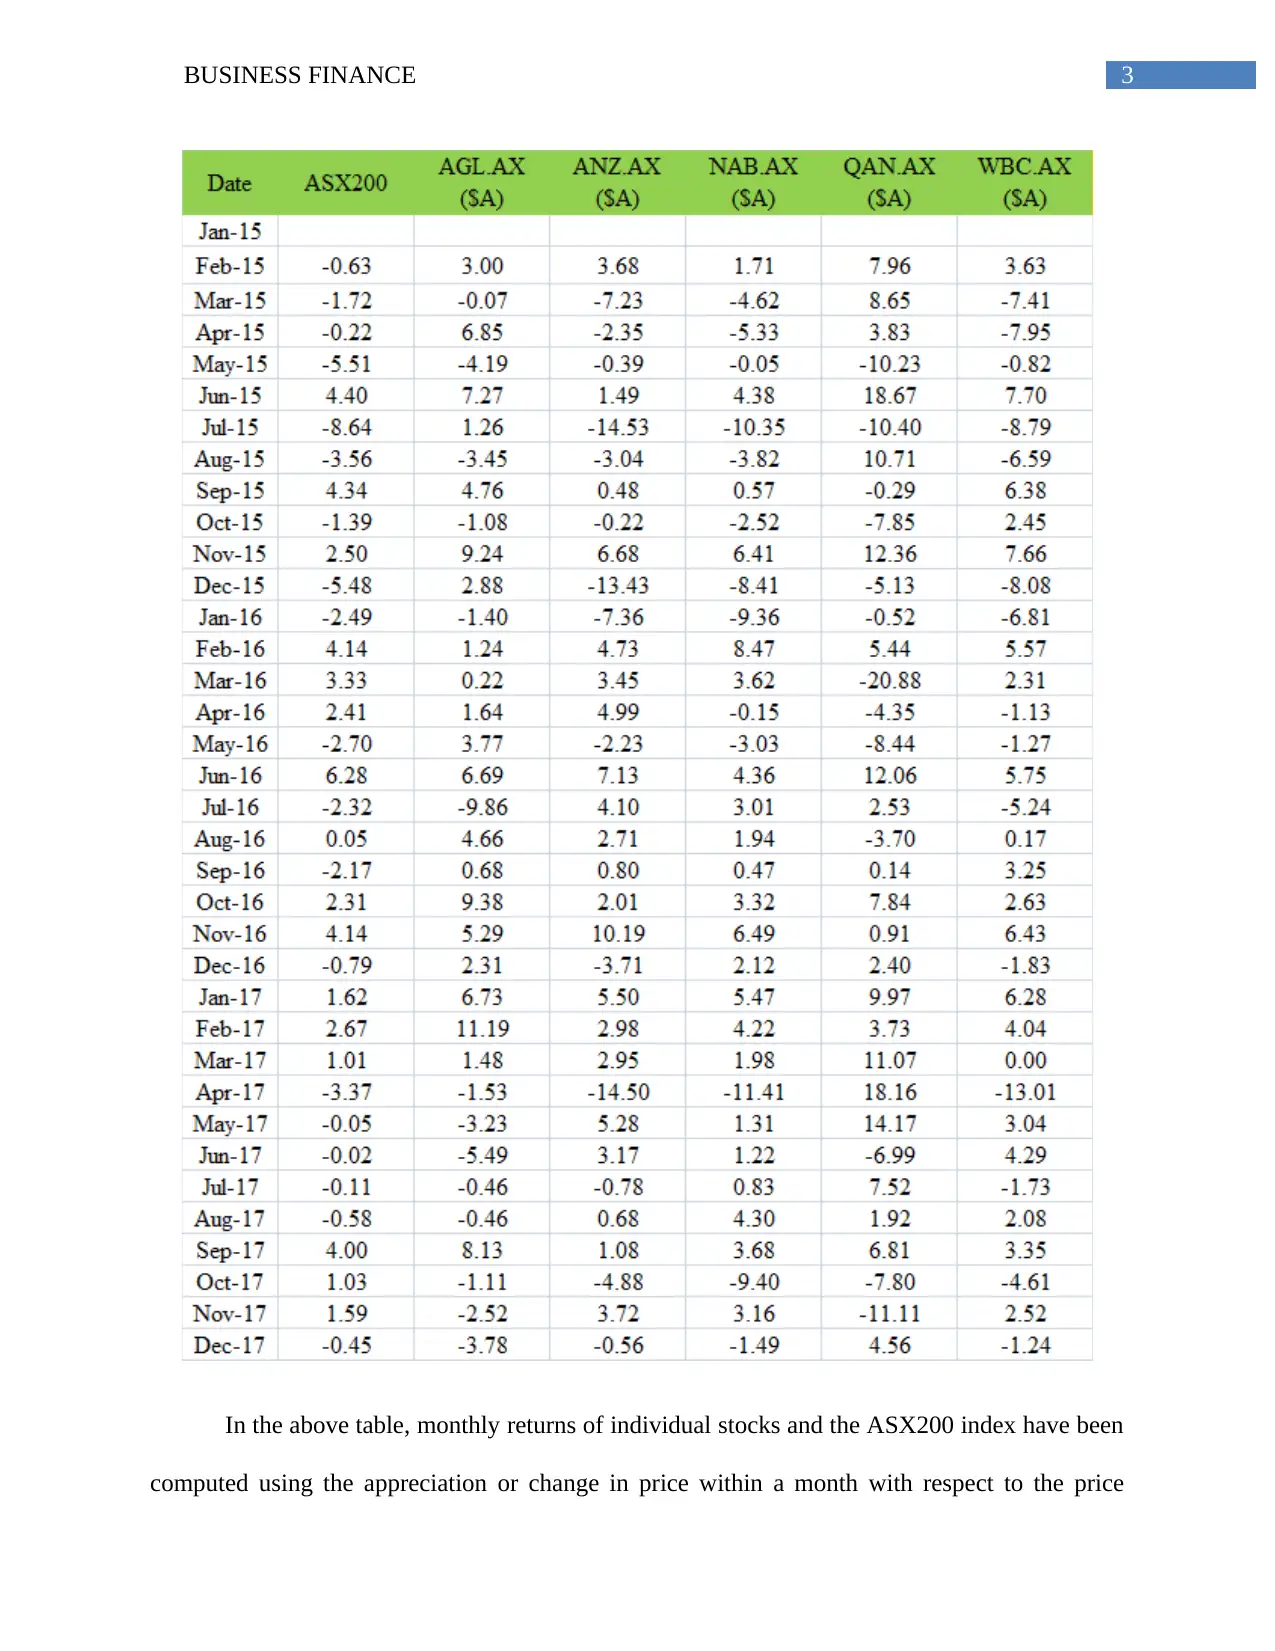
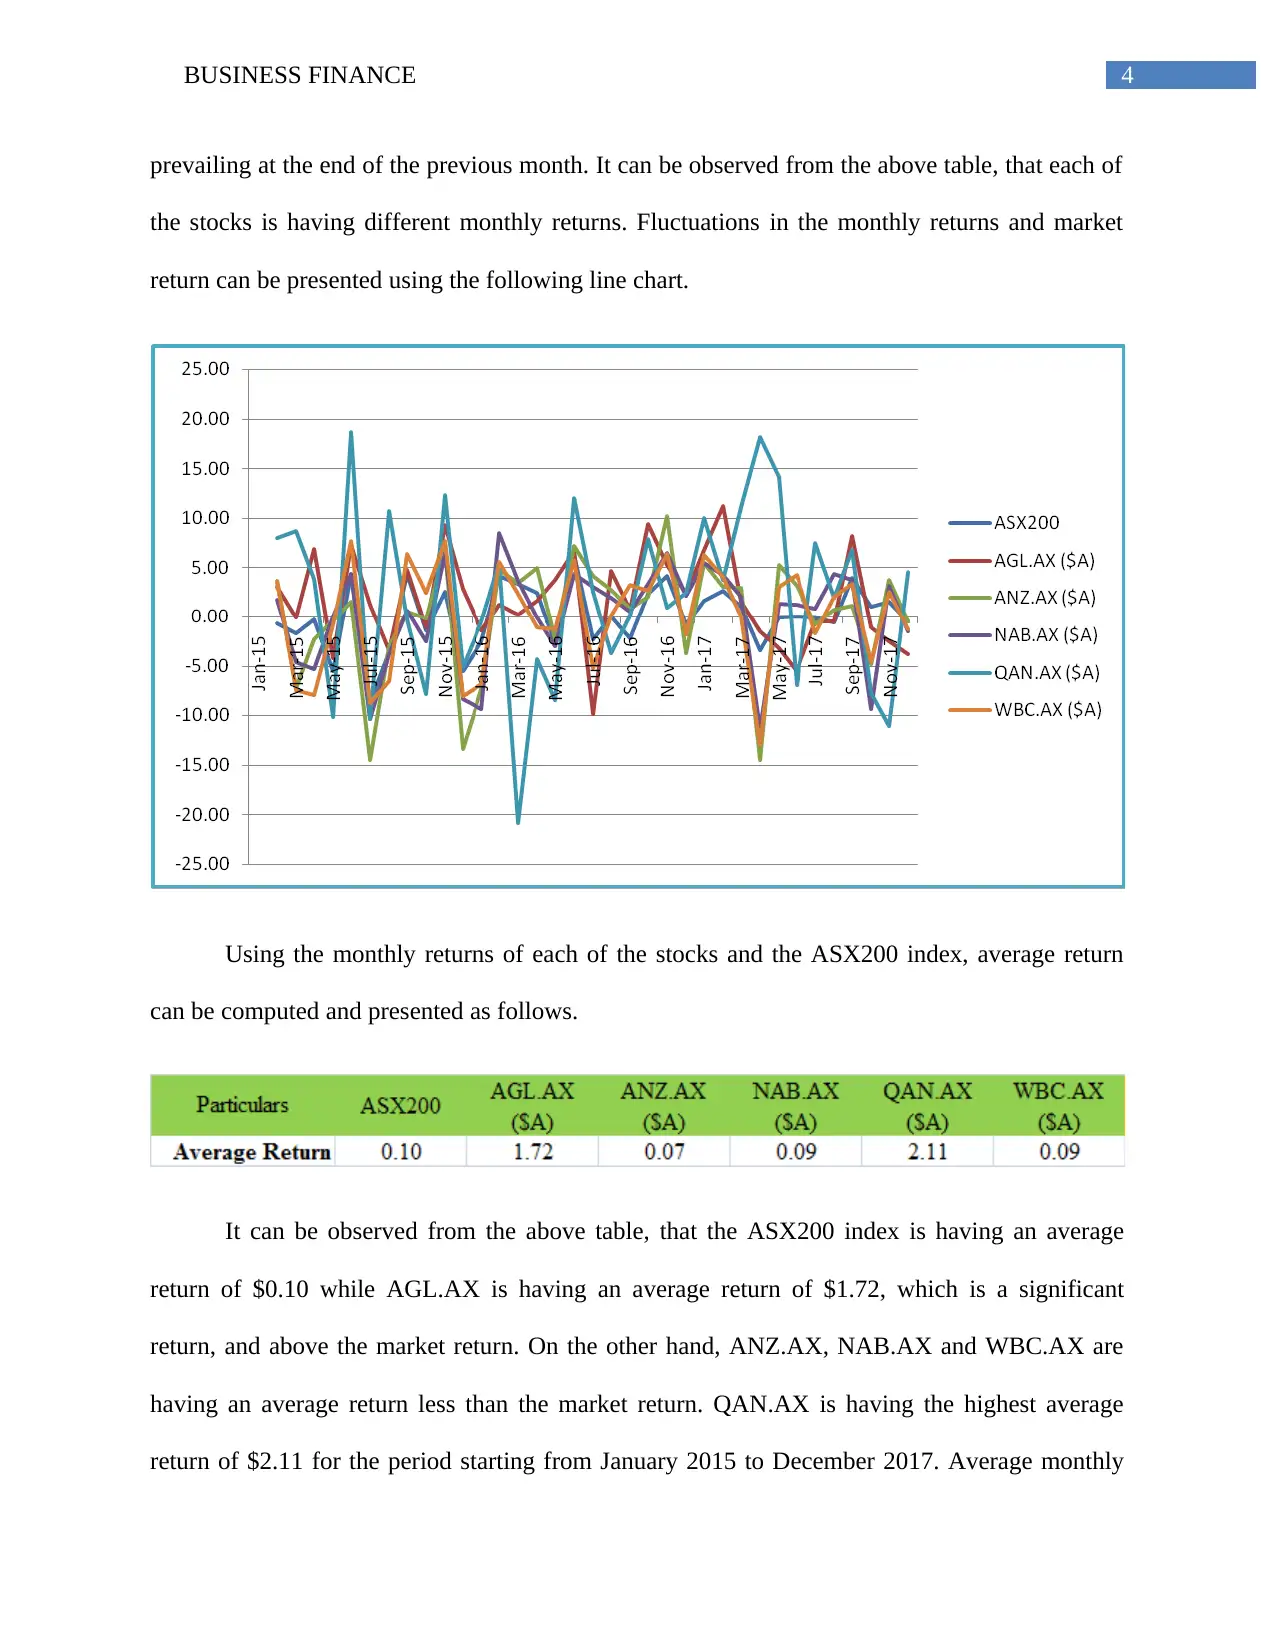
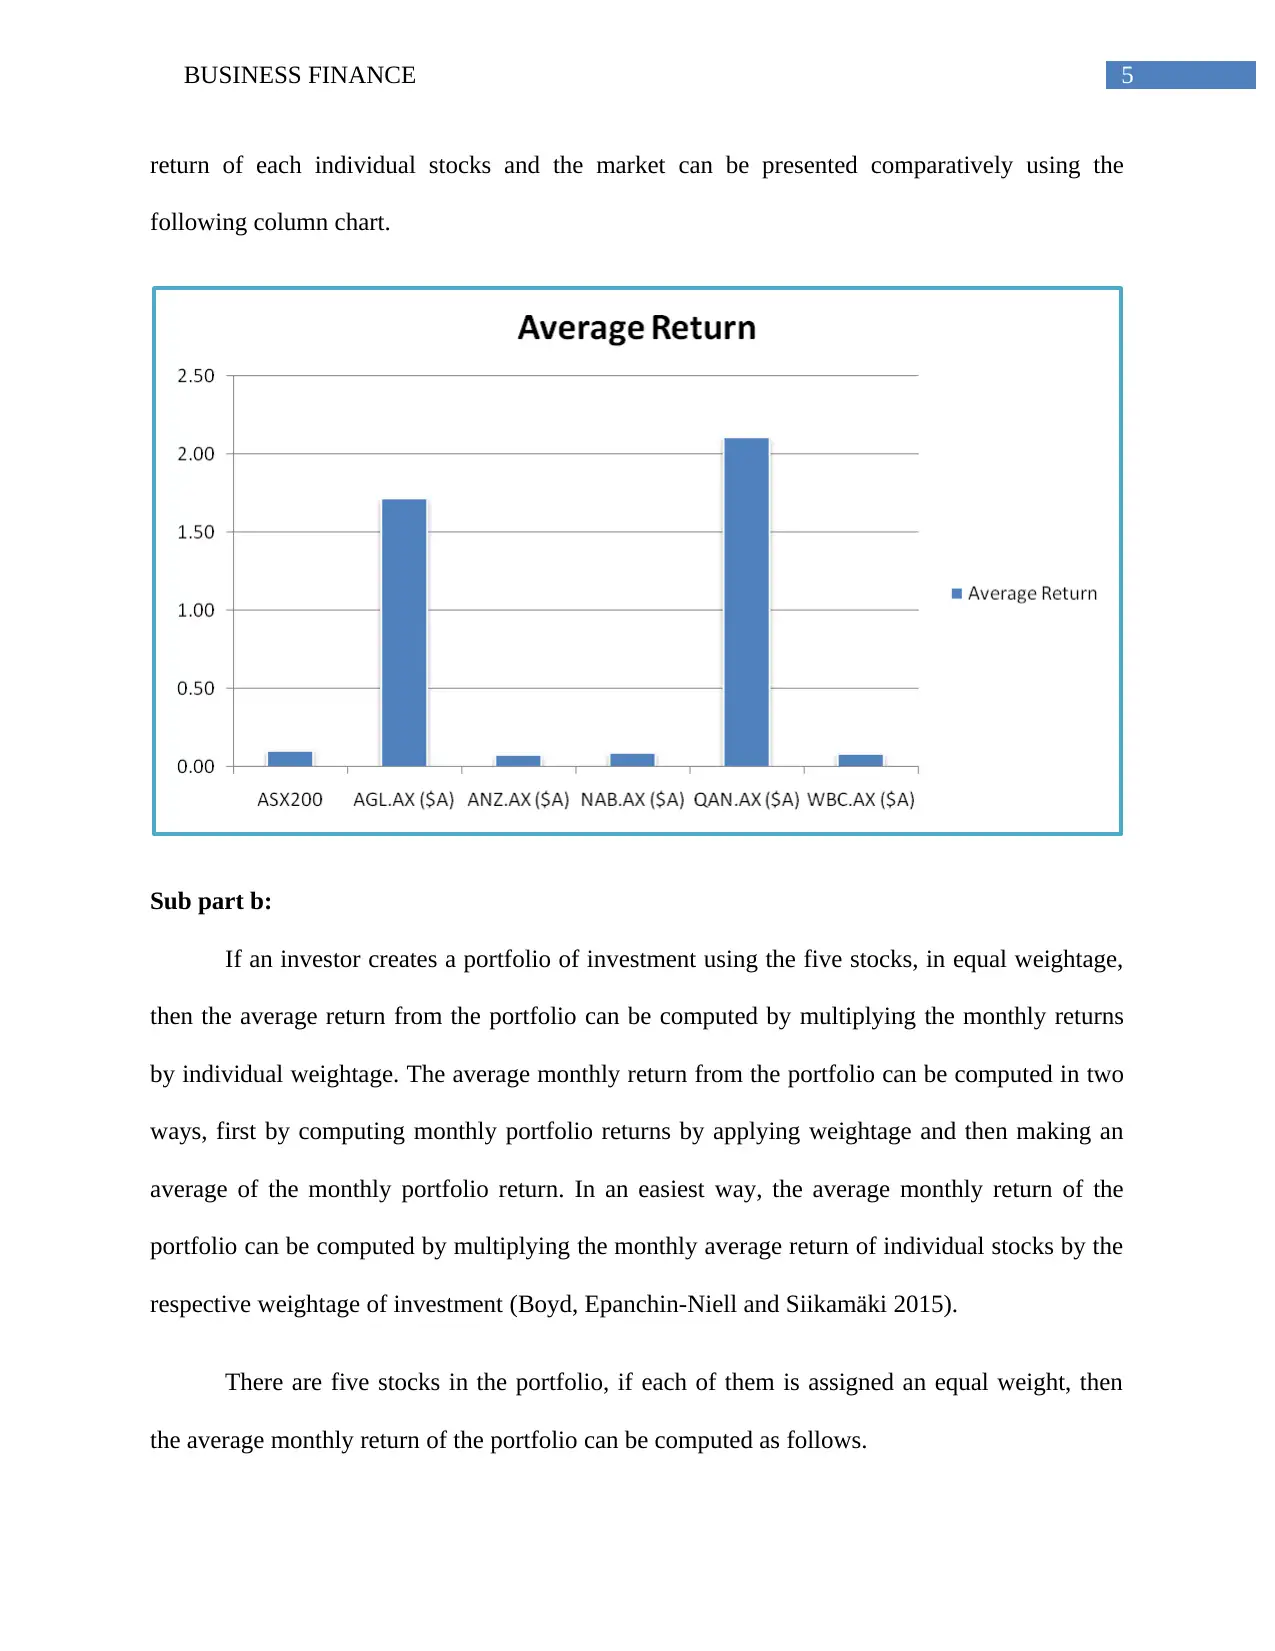
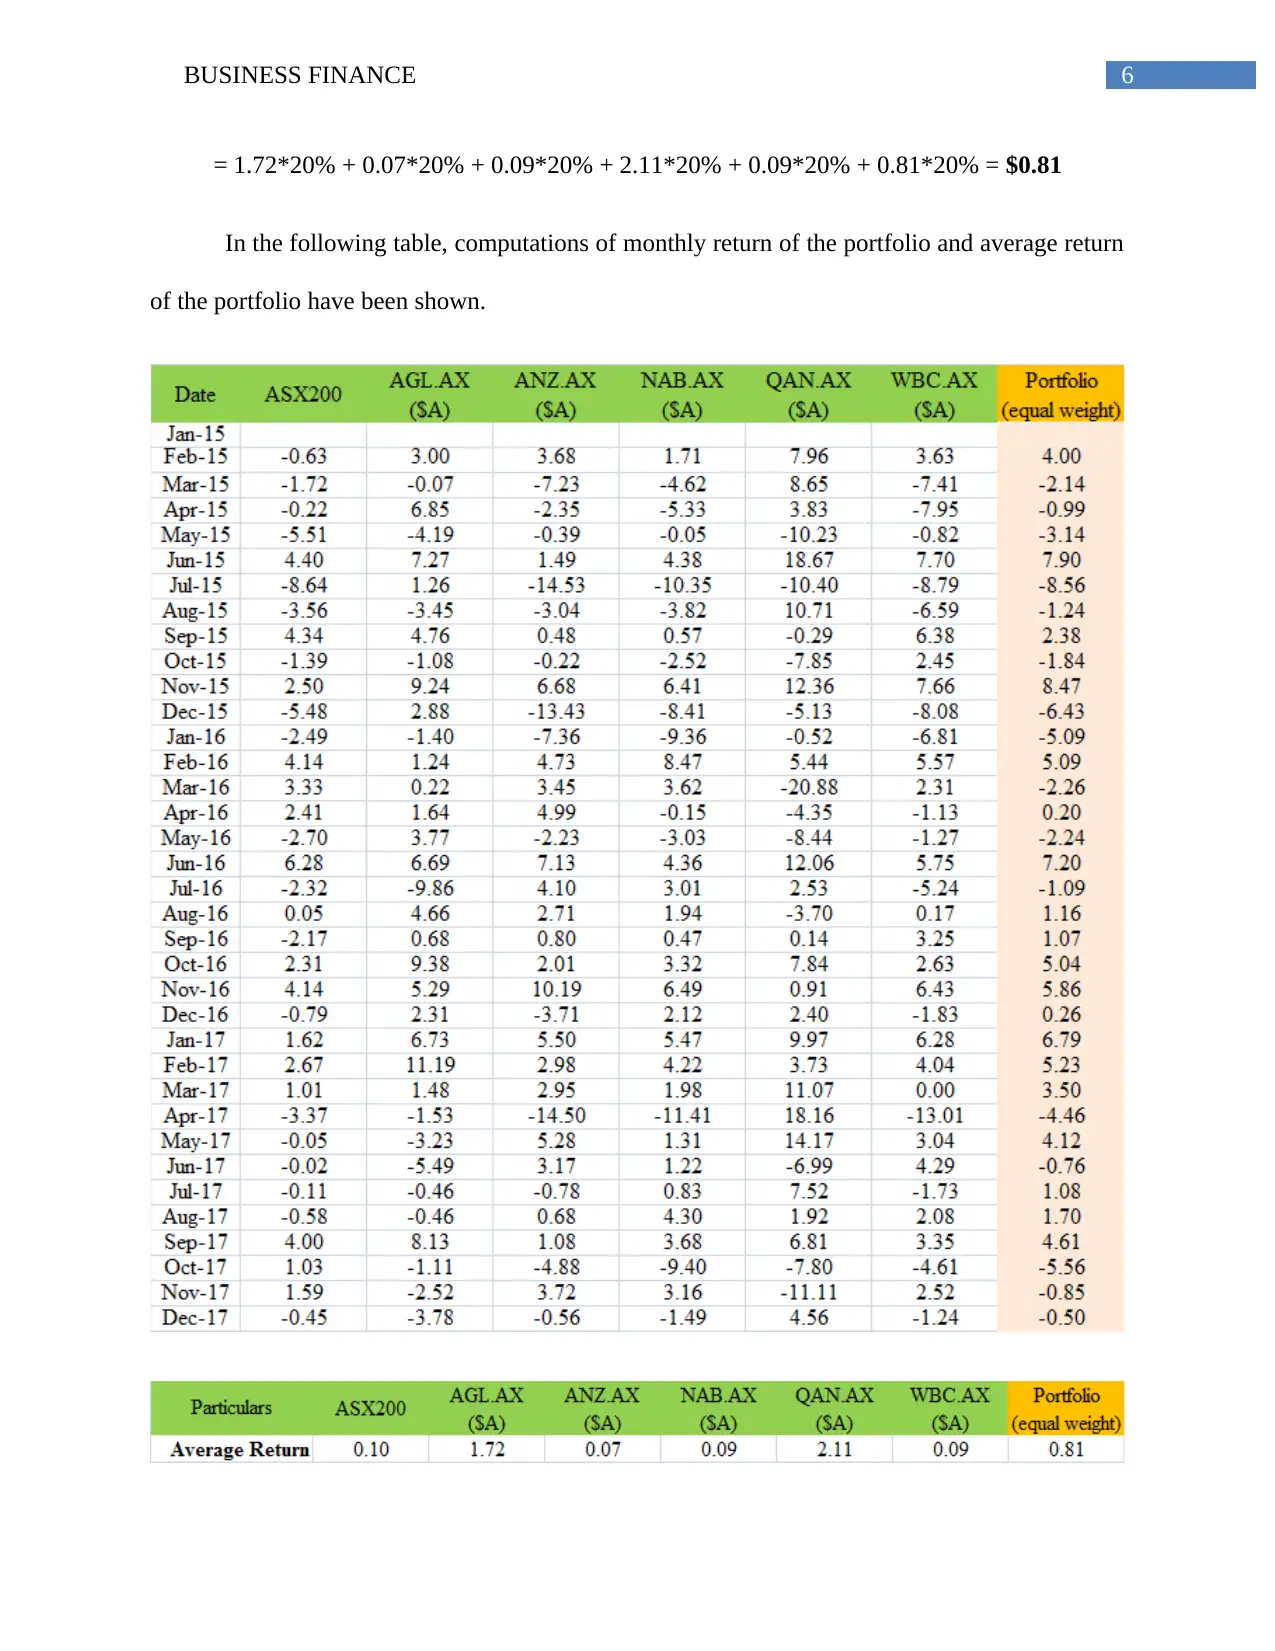
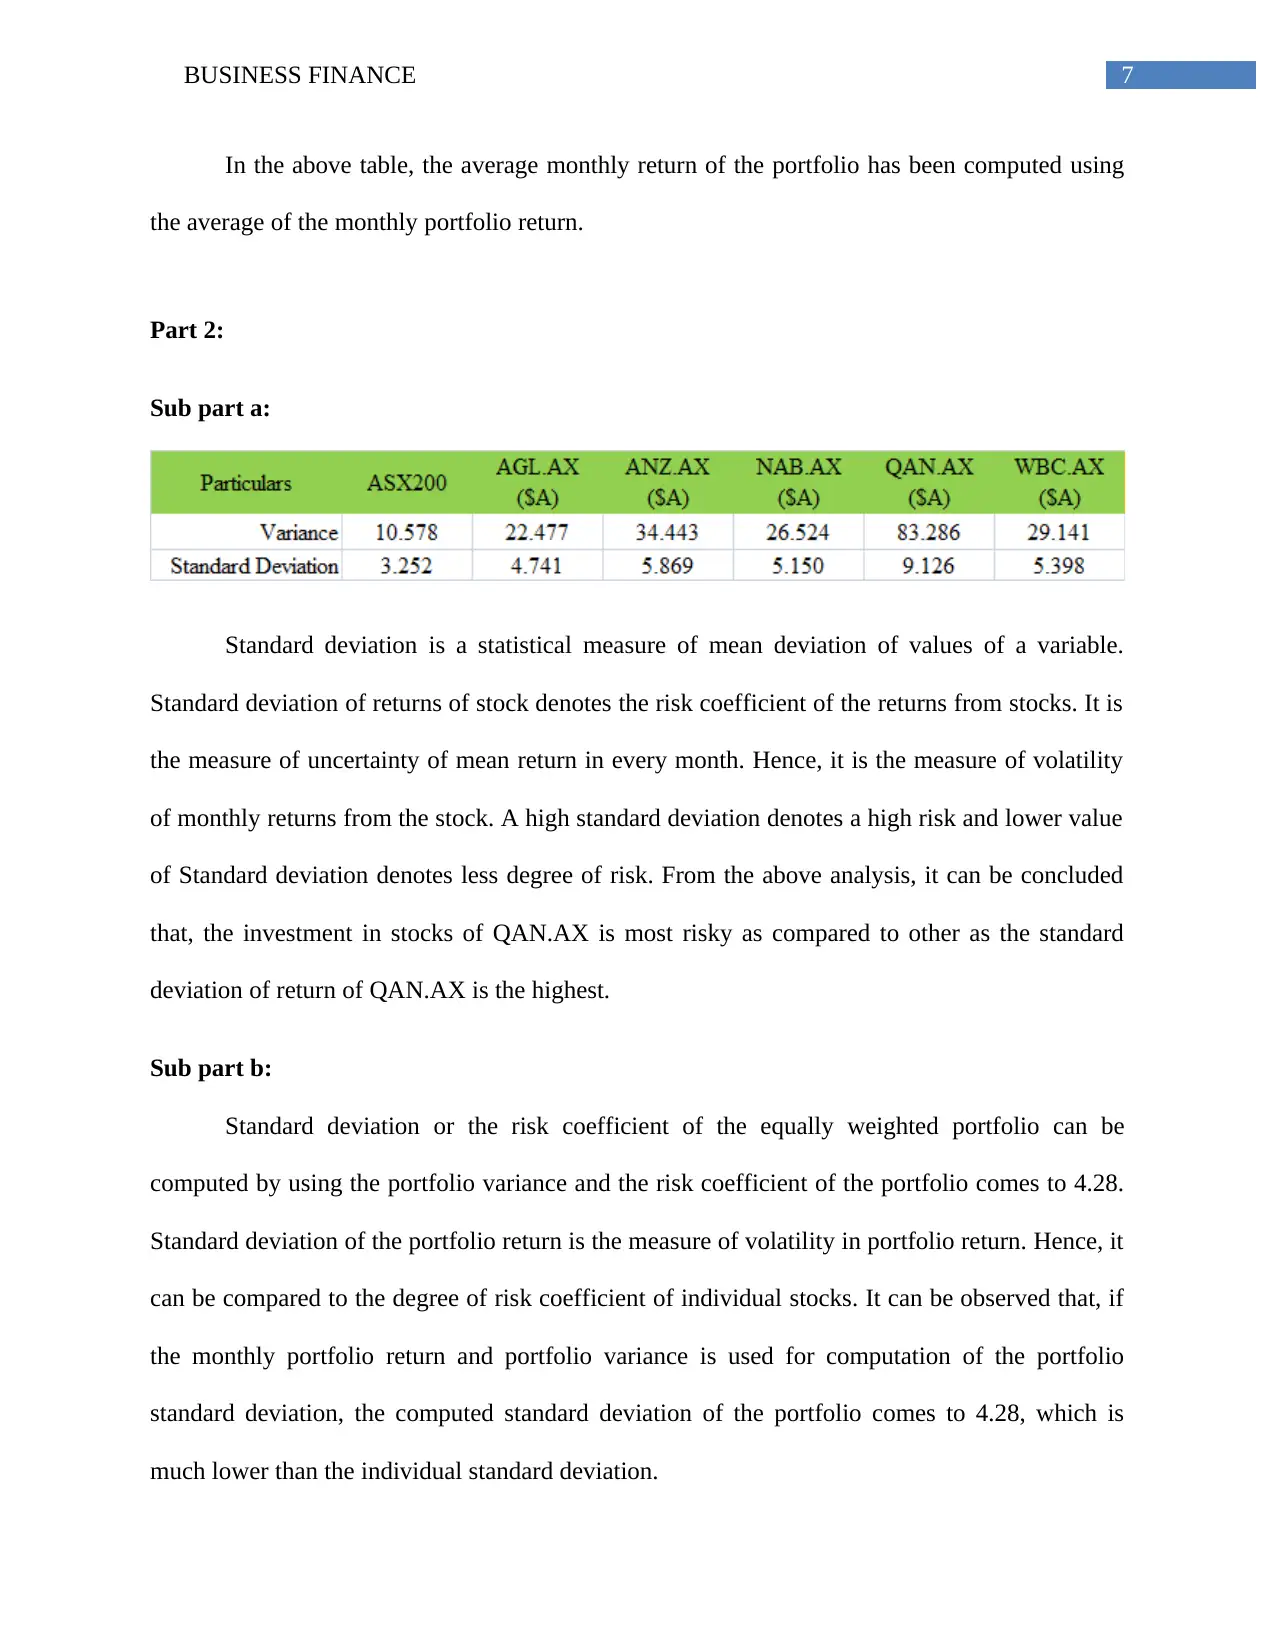
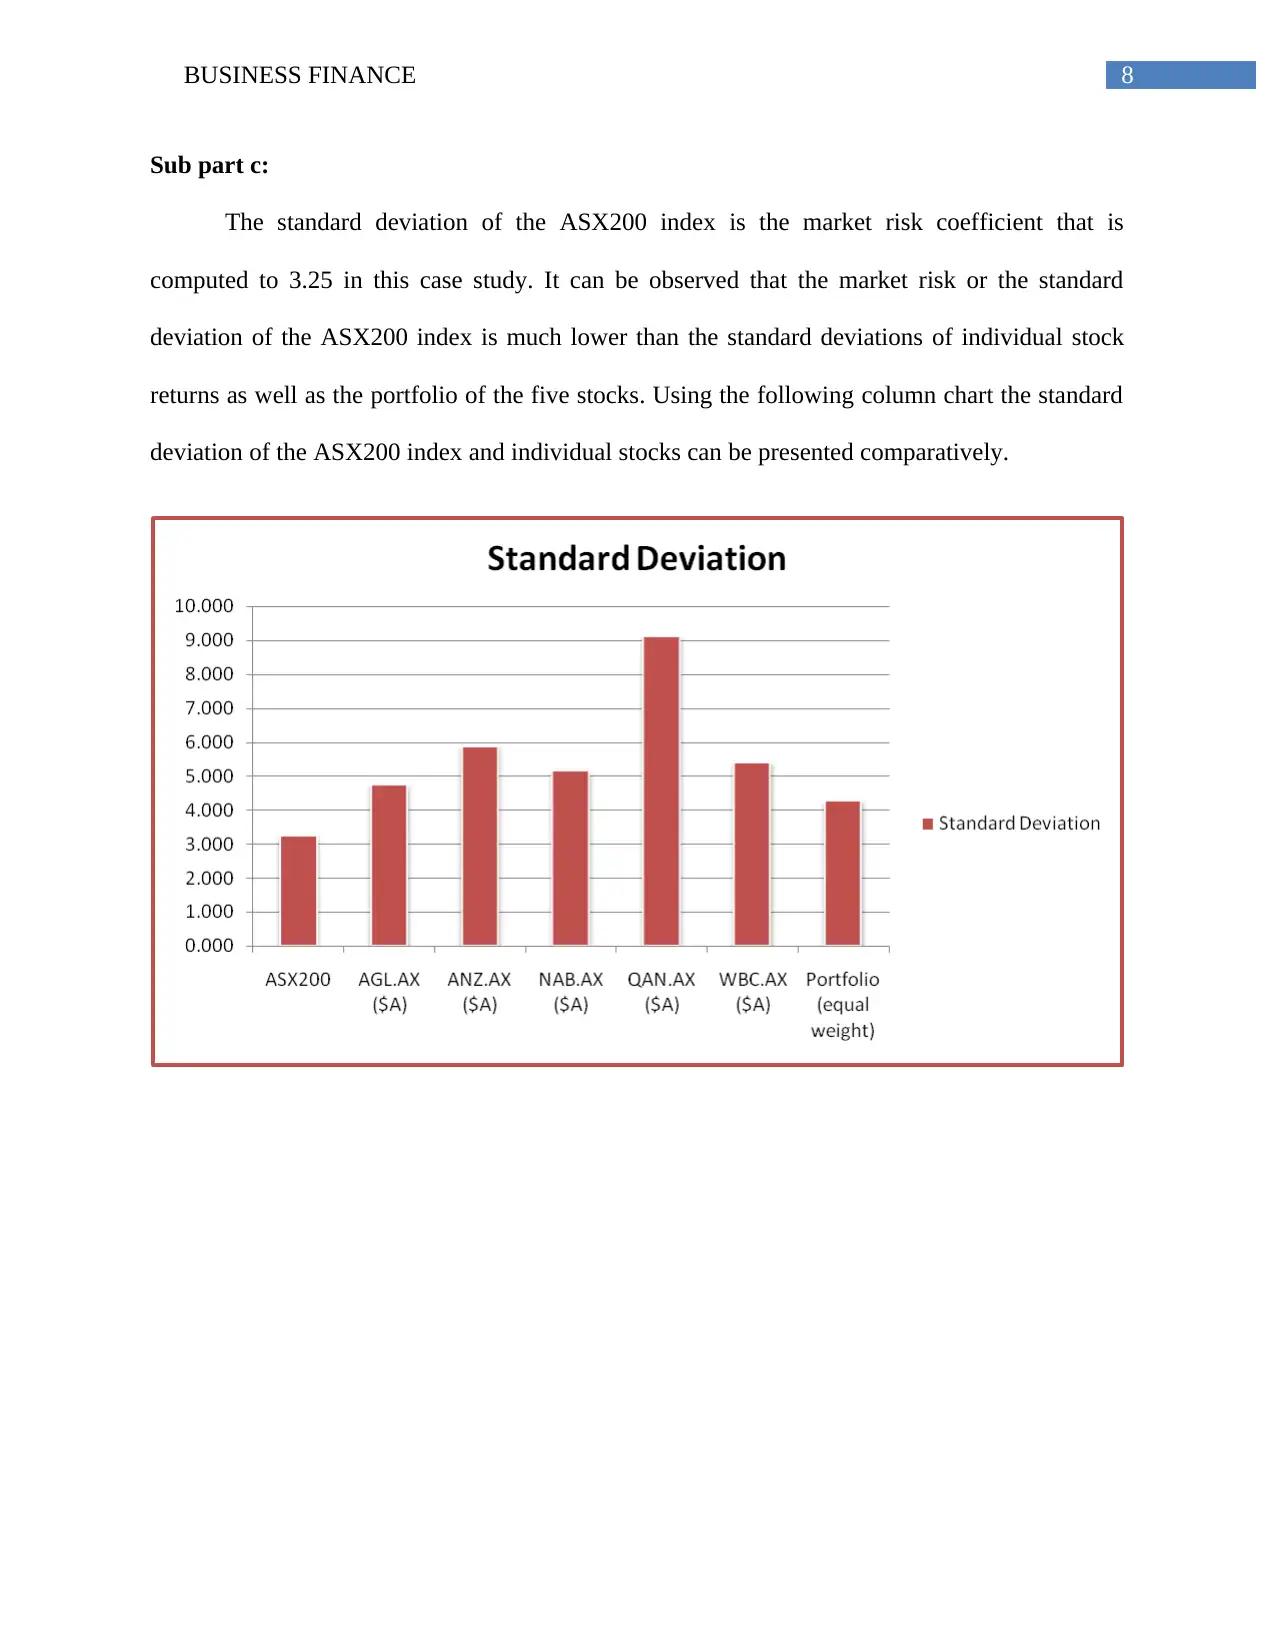
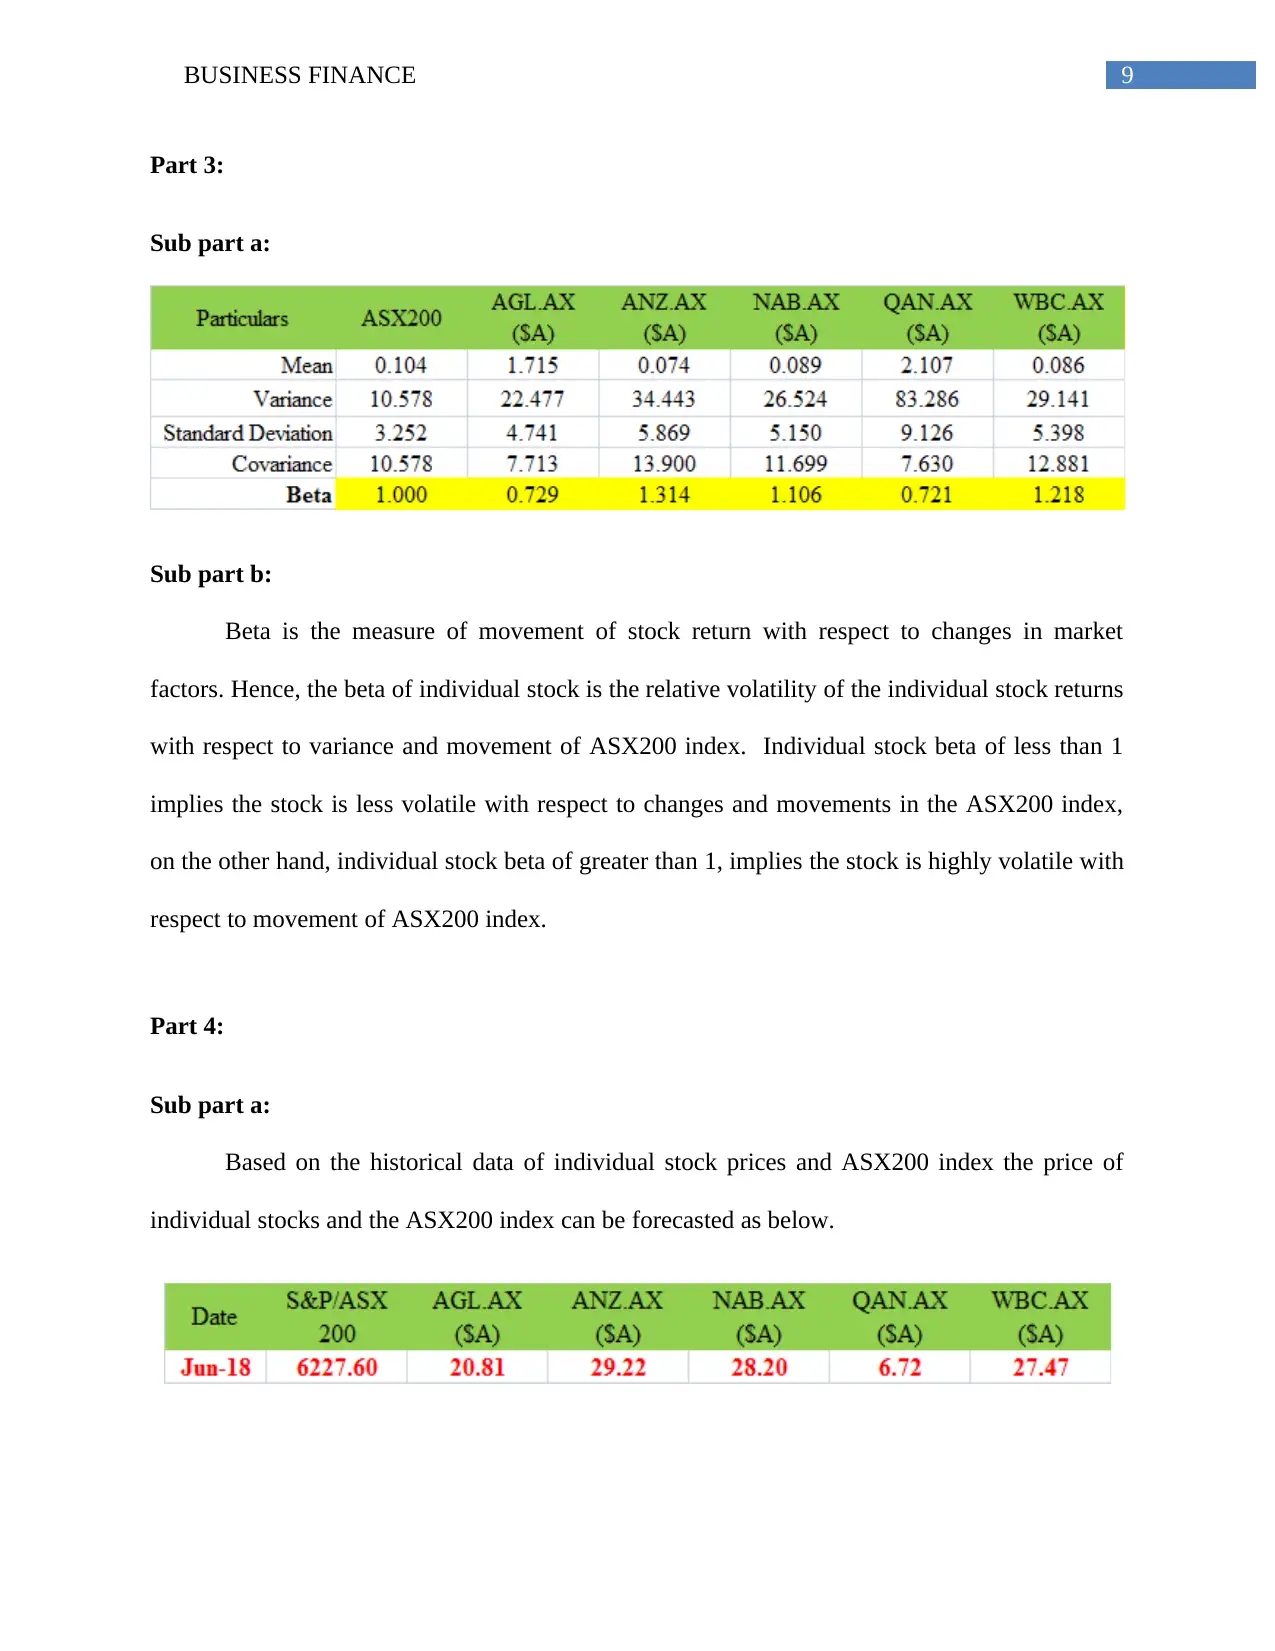
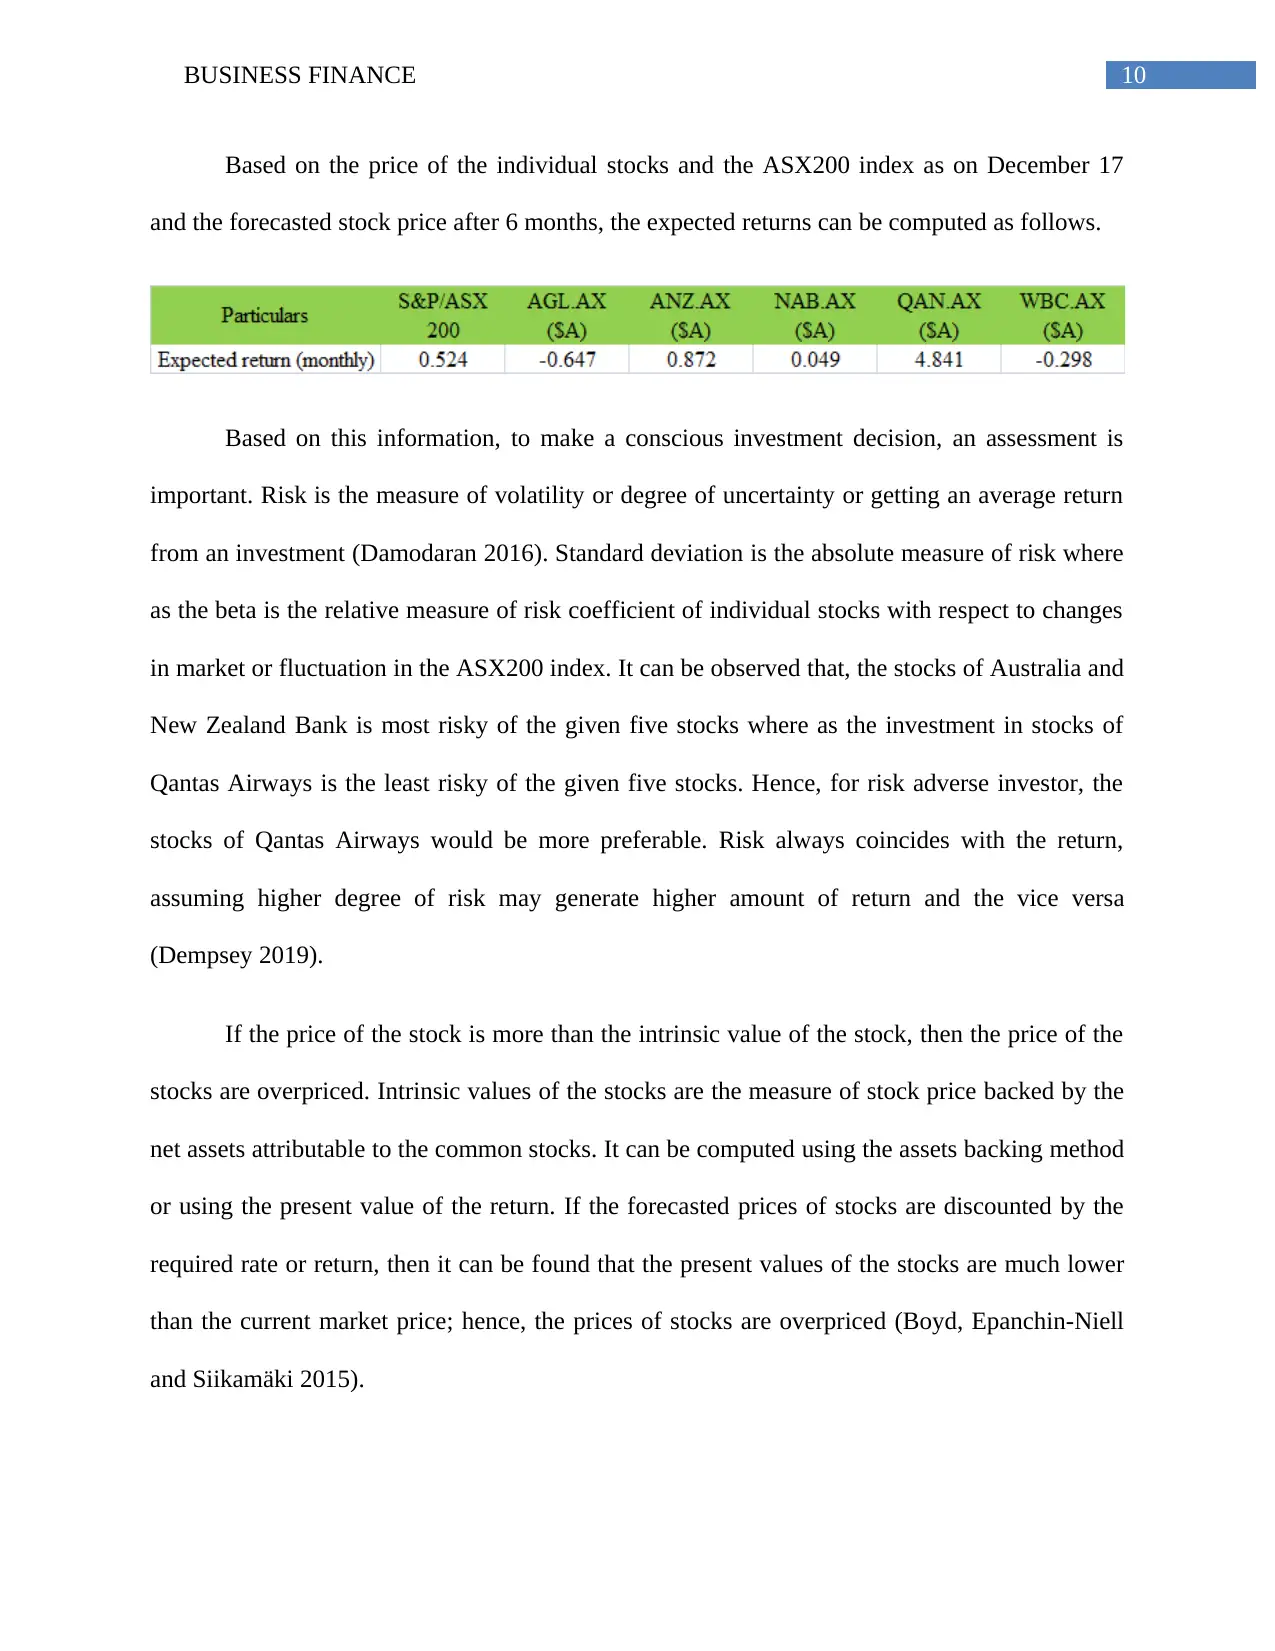
This report analyzes stock data from January 2015 to December 2017, focusing on individual stock returns and the ASX200 index. It computes average monthly returns, standard deviations, and betas for various stocks, including AGL.AX, ANZ.AX, NAB.AX, WBC.AX, QAN.AX. The report examines portfolio construction, risk assessment, and financial forecasting, providing insights into investment strategies and recommendations for investors. It calculates portfolio returns, standard deviations, and beta coefficients. Furthermore, it forecasts future stock prices and assesses investment risks, recommending investment in Qantas Airways due to its lower risk and higher expected return. The report also discusses the concept of intrinsic value and overpricing of stocks.

Running head: BUSINESS FINANCE
Business Finance
Name of the Student:
Name of the University:
Author’s Note:
Business Finance
Name of the Student:
Name of the University:
Author’s Note:
Paraphrase This Document
Need a fresh take? Get an instant paraphrase of this document with our AI Paraphraser

1BUSINESS FINANCE
Table of Contents
Part 1:...............................................................................................................................................2
Sub part a:....................................................................................................................................2
Sub part b:....................................................................................................................................4
Part 2:...............................................................................................................................................6
Sub part a:....................................................................................................................................6
Sub part b:....................................................................................................................................6
Sub part c:....................................................................................................................................7
Part 3:...............................................................................................................................................8
Sub part a:....................................................................................................................................8
Sub part b:....................................................................................................................................8
Part 4:...............................................................................................................................................8
Sub part a:....................................................................................................................................8
Sub part b:..................................................................................................................................10
References and bibliography:........................................................................................................11

2BUSINESS FINANCE
Part 1:
Sub part a:
Part 1:
Sub part a:
⊘ This is a preview!⊘
Do you want full access?
Subscribe today to unlock all pages.

Trusted by 1+ million students worldwide

3BUSINESS FINANCE
In the above table, monthly returns of individual stocks and the ASX200 index have been
computed using the appreciation or change in price within a month with respect to the price
In the above table, monthly returns of individual stocks and the ASX200 index have been
computed using the appreciation or change in price within a month with respect to the price
Paraphrase This Document
Need a fresh take? Get an instant paraphrase of this document with our AI Paraphraser

4BUSINESS FINANCE
prevailing at the end of the previous month. It can be observed from the above table, that each of
the stocks is having different monthly returns. Fluctuations in the monthly returns and market
return can be presented using the following line chart.
Using the monthly returns of each of the stocks and the ASX200 index, average return
can be computed and presented as follows.
It can be observed from the above table, that the ASX200 index is having an average
return of $0.10 while AGL.AX is having an average return of $1.72, which is a significant
return, and above the market return. On the other hand, ANZ.AX, NAB.AX and WBC.AX are
having an average return less than the market return. QAN.AX is having the highest average
return of $2.11 for the period starting from January 2015 to December 2017. Average monthly

5BUSINESS FINANCE
return of each individual stocks and the market can be presented comparatively using the
following column chart.
Sub part b:
If an investor creates a portfolio of investment using the five stocks, in equal weightage,
then the average return from the portfolio can be computed by multiplying the monthly returns
by individual weightage. The average monthly return from the portfolio can be computed in two
ways, first by computing monthly portfolio returns by applying weightage and then making an
average of the monthly portfolio return. In an easiest way, the average monthly return of the
portfolio can be computed by multiplying the monthly average return of individual stocks by the
respective weightage of investment (Boyd, Epanchin-Niell and Siikamäki 2015).
There are five stocks in the portfolio, if each of them is assigned an equal weight, then
the average monthly return of the portfolio can be computed as follows.
⊘ This is a preview!⊘
Do you want full access?
Subscribe today to unlock all pages.

Trusted by 1+ million students worldwide

6BUSINESS FINANCE
= 1.72*20% + 0.07*20% + 0.09*20% + 2.11*20% + 0.09*20% + 0.81*20% = $0.81
In the following table, computations of monthly return of the portfolio and average return
of the portfolio have been shown.
= 1.72*20% + 0.07*20% + 0.09*20% + 2.11*20% + 0.09*20% + 0.81*20% = $0.81
In the following table, computations of monthly return of the portfolio and average return
of the portfolio have been shown.
Paraphrase This Document
Need a fresh take? Get an instant paraphrase of this document with our AI Paraphraser

7BUSINESS FINANCE
In the above table, the average monthly return of the portfolio has been computed using
the average of the monthly portfolio return.
Part 2:
Sub part a:
Standard deviation is a statistical measure of mean deviation of values of a variable.
Standard deviation of returns of stock denotes the risk coefficient of the returns from stocks. It is
the measure of uncertainty of mean return in every month. Hence, it is the measure of volatility
of monthly returns from the stock. A high standard deviation denotes a high risk and lower value
of Standard deviation denotes less degree of risk. From the above analysis, it can be concluded
that, the investment in stocks of QAN.AX is most risky as compared to other as the standard
deviation of return of QAN.AX is the highest.
Sub part b:
Standard deviation or the risk coefficient of the equally weighted portfolio can be
computed by using the portfolio variance and the risk coefficient of the portfolio comes to 4.28.
Standard deviation of the portfolio return is the measure of volatility in portfolio return. Hence, it
can be compared to the degree of risk coefficient of individual stocks. It can be observed that, if
the monthly portfolio return and portfolio variance is used for computation of the portfolio
standard deviation, the computed standard deviation of the portfolio comes to 4.28, which is
much lower than the individual standard deviation.

8BUSINESS FINANCE
Sub part c:
The standard deviation of the ASX200 index is the market risk coefficient that is
computed to 3.25 in this case study. It can be observed that the market risk or the standard
deviation of the ASX200 index is much lower than the standard deviations of individual stock
returns as well as the portfolio of the five stocks. Using the following column chart the standard
deviation of the ASX200 index and individual stocks can be presented comparatively.
⊘ This is a preview!⊘
Do you want full access?
Subscribe today to unlock all pages.

Trusted by 1+ million students worldwide

9BUSINESS FINANCE
Part 3:
Sub part a:
Sub part b:
Beta is the measure of movement of stock return with respect to changes in market
factors. Hence, the beta of individual stock is the relative volatility of the individual stock returns
with respect to variance and movement of ASX200 index. Individual stock beta of less than 1
implies the stock is less volatile with respect to changes and movements in the ASX200 index,
on the other hand, individual stock beta of greater than 1, implies the stock is highly volatile with
respect to movement of ASX200 index.
Part 4:
Sub part a:
Based on the historical data of individual stock prices and ASX200 index the price of
individual stocks and the ASX200 index can be forecasted as below.
Paraphrase This Document
Need a fresh take? Get an instant paraphrase of this document with our AI Paraphraser

10BUSINESS FINANCE
Based on the price of the individual stocks and the ASX200 index as on December 17
and the forecasted stock price after 6 months, the expected returns can be computed as follows.
Based on this information, to make a conscious investment decision, an assessment is
important. Risk is the measure of volatility or degree of uncertainty or getting an average return
from an investment (Damodaran 2016). Standard deviation is the absolute measure of risk where
as the beta is the relative measure of risk coefficient of individual stocks with respect to changes
in market or fluctuation in the ASX200 index. It can be observed that, the stocks of Australia and
New Zealand Bank is most risky of the given five stocks where as the investment in stocks of
Qantas Airways is the least risky of the given five stocks. Hence, for risk adverse investor, the
stocks of Qantas Airways would be more preferable. Risk always coincides with the return,
assuming higher degree of risk may generate higher amount of return and the vice versa
(Dempsey 2019).
If the price of the stock is more than the intrinsic value of the stock, then the price of the
stocks are overpriced. Intrinsic values of the stocks are the measure of stock price backed by the
net assets attributable to the common stocks. It can be computed using the assets backing method
or using the present value of the return. If the forecasted prices of stocks are discounted by the
required rate or return, then it can be found that the present values of the stocks are much lower
than the current market price; hence, the prices of stocks are overpriced (Boyd, Epanchin-Niell
and Siikamäki 2015).

11BUSINESS FINANCE
A conscious investor would always prefer to invest in such investment opportunity,
which will be providing higher return with lower degree of risk coefficient. It can be concluded
and recommended from the above analysis that, as the stocks of Qantas Airways is having the
lowest degree of risk and a highest expected monthly return of 4.84 percent, the investor should
go for investment in stocks of Qantas Airways.
Sub part b:
It can further be recommended that, the investor should not go for an equally weighted portfolio
of five stocks for investment, as the expected return from such a portfolio would be much lower
than the individual return of the stocks of Qantas Airways.
⊘ This is a preview!⊘
Do you want full access?
Subscribe today to unlock all pages.

Trusted by 1+ million students worldwide
1 out of 13
Related Documents
Your All-in-One AI-Powered Toolkit for Academic Success.
 +13062052269
info@desklib.com
Available 24*7 on WhatsApp / Email
Unlock your academic potential
Copyright © 2020–2025 A2Z Services. All Rights Reserved. Developed and managed by ZUCOL.


