Investment Appraisal, WACC & Financial Analysis of AMP Limited
VerifiedAdded on 2023/06/04
|17
|3725
|366
Report
AI Summary
This report provides a comprehensive analysis of investment decisions and capital structure, focusing on AMP Limited. Part A involves calculating after-tax cash flows, payback period, net present value (NPV), and profitability index for proposed investment projects under different scenarios. It also includes a comparison of two investment options based on annualized cost. Part B presents an executive summary, introduction, comparative analysis of Weighted Average Cost of Capital (WACC) and capital structure, financial analysis of AMP Limited using key financial ratios, examination of major changes in AMP Limited's capital structure over the past three years, and a risk analysis. The analysis utilizes financial statements and ratios to assess the company's financial performance and stability, concluding with recommendations based on the findings. Desklib provides access to similar solved assignments.

Accounting and finance
Paraphrase This Document
Need a fresh take? Get an instant paraphrase of this document with our AI Paraphraser
TABLE OF CONTENTS
Part A.........................................................................................................................................3
(i)............................................................................................................................................3
(ii)...........................................................................................................................................5
A.........................................................................................................................................5
B.........................................................................................................................................6
C.........................................................................................................................................7
(iii)..........................................................................................................................................7
Option A.............................................................................................................................7
Option B.............................................................................................................................8
Part B........................................................................................................................................10
Executive summary..............................................................................................................10
Introduction..........................................................................................................................10
Comparative analysis of WAACC and capital structure..................................................10
Financial analysis of AMP Limited.................................................................................12
Major changes held in the capital structure of AMP limited in past three years.............13
AMP Limited’s Risk analysis..........................................................................................14
Conclusion............................................................................................................................15
References................................................................................................................................16
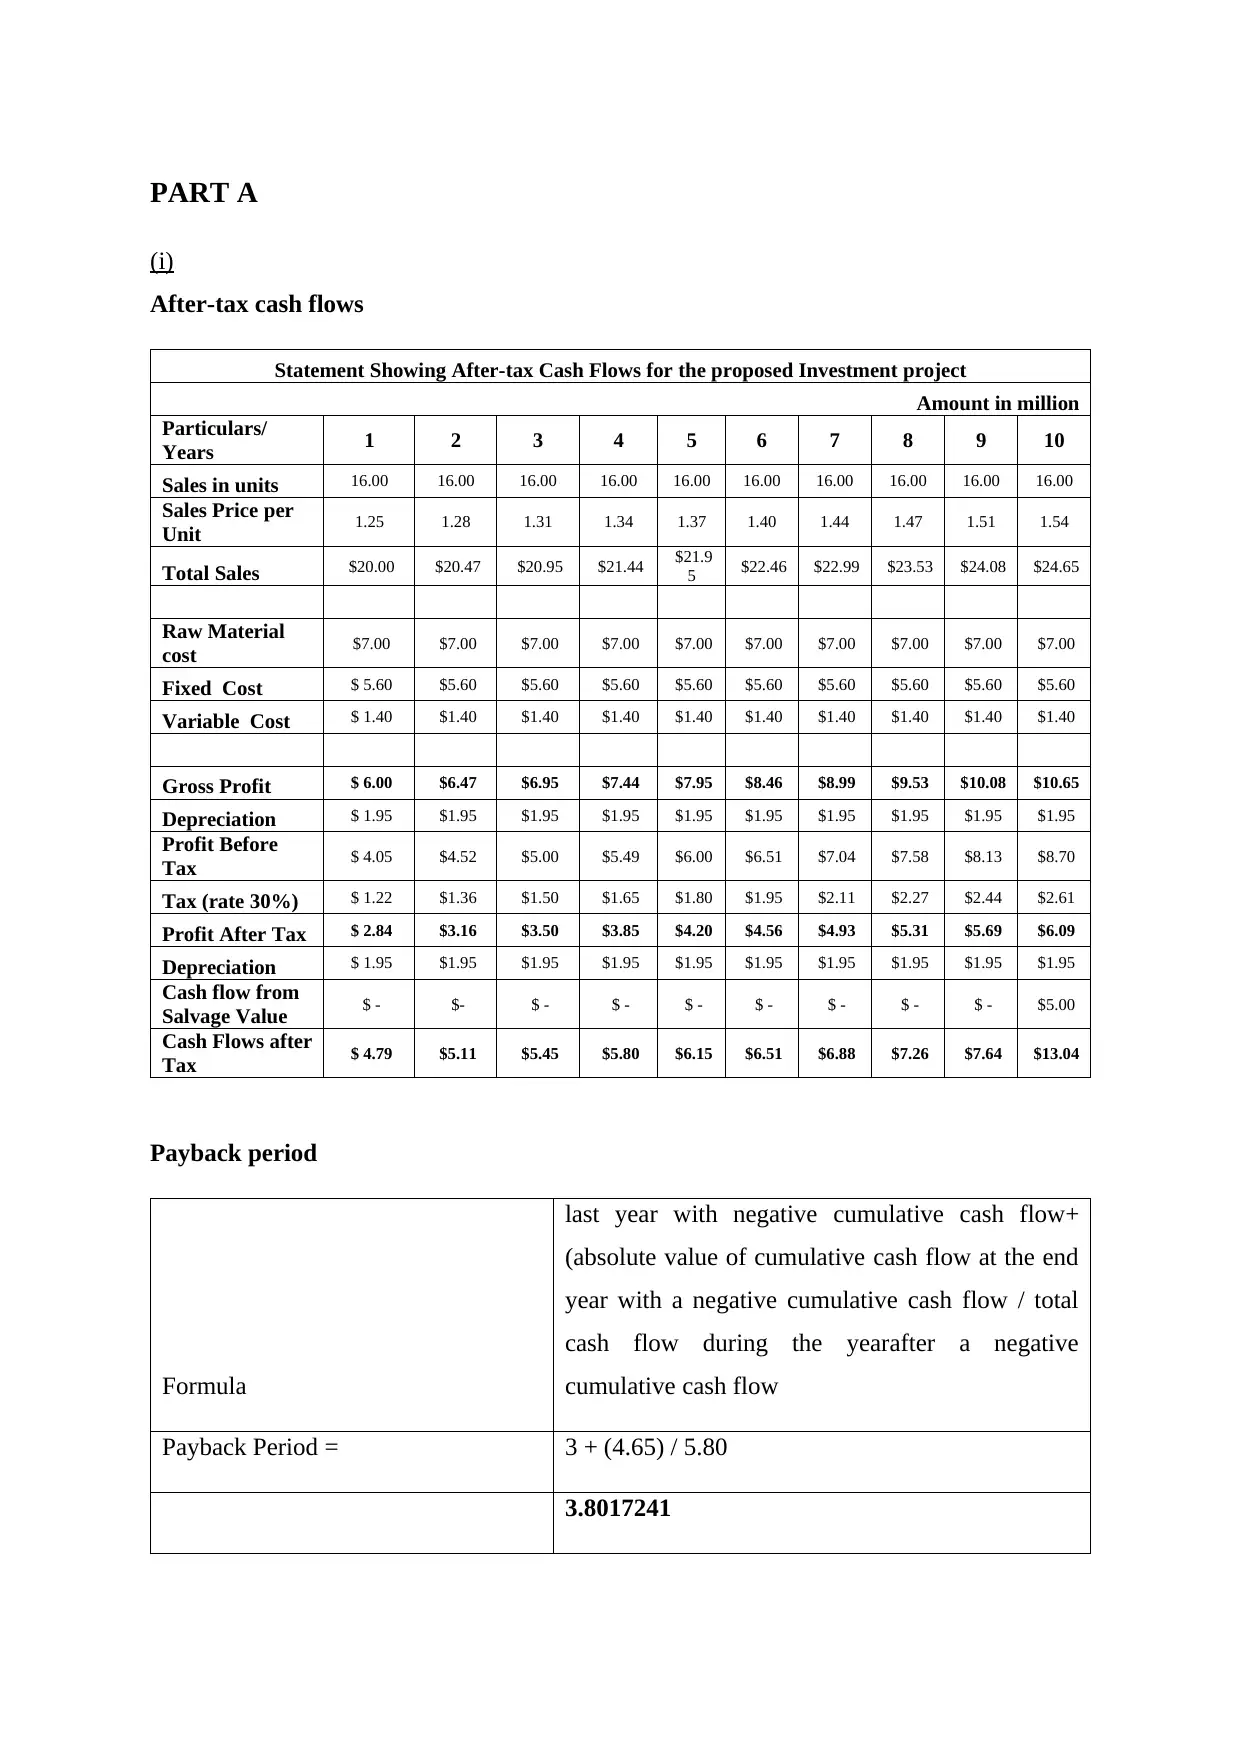
PART A
(i)
After-tax cash flows
Statement Showing After-tax Cash Flows for the proposed Investment project
Amount in million
Particulars/
Years 1 2 3 4 5 6 7 8 9 10
Sales in units 16.00 16.00 16.00 16.00 16.00 16.00 16.00 16.00 16.00 16.00
Sales Price per
Unit 1.25 1.28 1.31 1.34 1.37 1.40 1.44 1.47 1.51 1.54
Total Sales $20.00 $20.47 $20.95 $21.44 $21.9
5 $22.46 $22.99 $23.53 $24.08 $24.65
Raw Material
cost $7.00 $7.00 $7.00 $7.00 $7.00 $7.00 $7.00 $7.00 $7.00 $7.00
Fixed Cost $ 5.60 $5.60 $5.60 $5.60 $5.60 $5.60 $5.60 $5.60 $5.60 $5.60
Variable Cost $ 1.40 $1.40 $1.40 $1.40 $1.40 $1.40 $1.40 $1.40 $1.40 $1.40
Gross Profit $ 6.00 $6.47 $6.95 $7.44 $7.95 $8.46 $8.99 $9.53 $10.08 $10.65
Depreciation $ 1.95 $1.95 $1.95 $1.95 $1.95 $1.95 $1.95 $1.95 $1.95 $1.95
Profit Before
Tax $ 4.05 $4.52 $5.00 $5.49 $6.00 $6.51 $7.04 $7.58 $8.13 $8.70
Tax (rate 30%) $ 1.22 $1.36 $1.50 $1.65 $1.80 $1.95 $2.11 $2.27 $2.44 $2.61
Profit After Tax $ 2.84 $3.16 $3.50 $3.85 $4.20 $4.56 $4.93 $5.31 $5.69 $6.09
Depreciation $ 1.95 $1.95 $1.95 $1.95 $1.95 $1.95 $1.95 $1.95 $1.95 $1.95
Cash flow from
Salvage Value $ - $- $ - $ - $ - $ - $ - $ - $ - $5.00
Cash Flows after
Tax $ 4.79 $5.11 $5.45 $5.80 $6.15 $6.51 $6.88 $7.26 $7.64 $13.04
Payback period
Formula
last year with negative cumulative cash flow+
(absolute value of cumulative cash flow at the end
year with a negative cumulative cash flow / total
cash flow during the yearafter a negative
cumulative cash flow
Payback Period = 3 + (4.65) / 5.80
3.8017241
⊘ This is a preview!⊘
Do you want full access?
Subscribe today to unlock all pages.
Trusted by 1+ million students worldwide
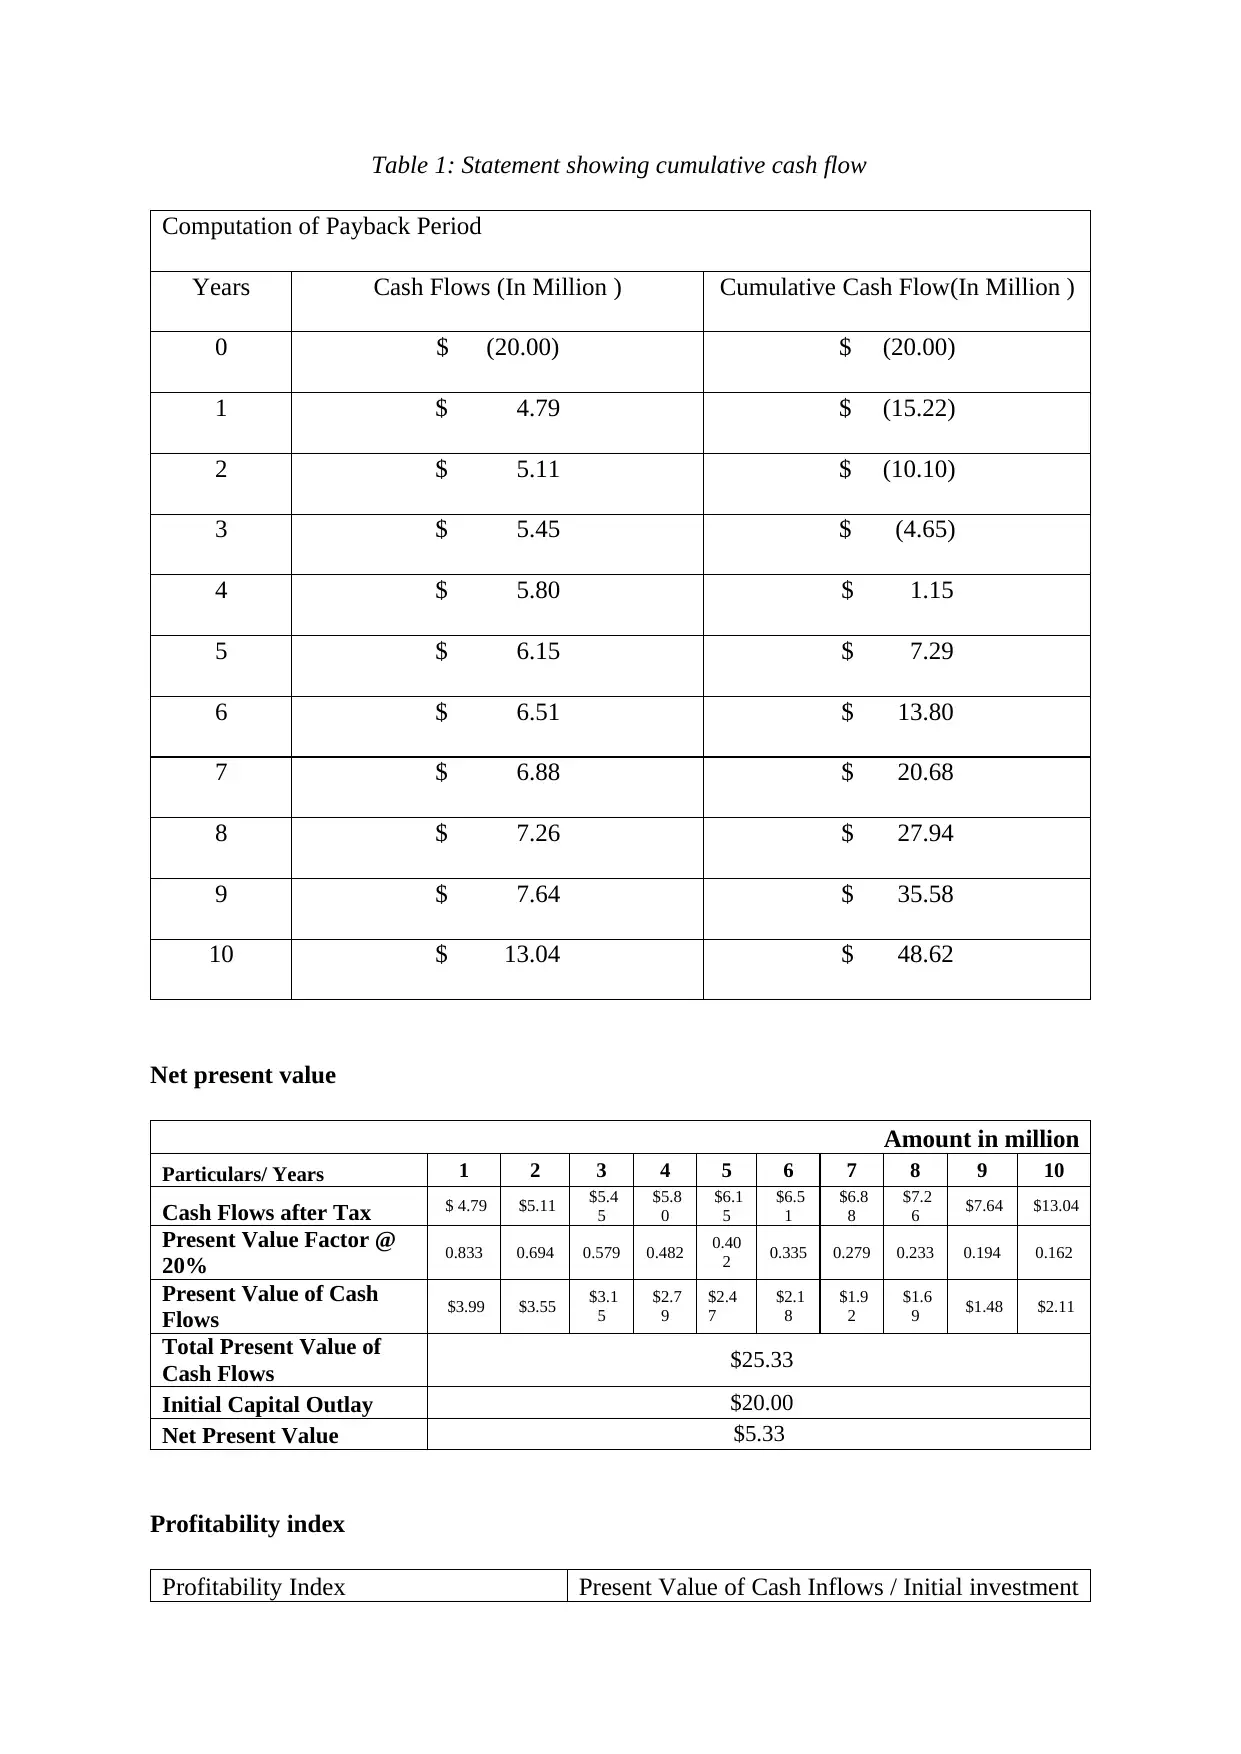
Table 1: Statement showing cumulative cash flow
Computation of Payback Period
Years Cash Flows (In Million ) Cumulative Cash Flow(In Million )
0 $ (20.00) $ (20.00)
1 $ 4.79 $ (15.22)
2 $ 5.11 $ (10.10)
3 $ 5.45 $ (4.65)
4 $ 5.80 $ 1.15
5 $ 6.15 $ 7.29
6 $ 6.51 $ 13.80
7 $ 6.88 $ 20.68
8 $ 7.26 $ 27.94
9 $ 7.64 $ 35.58
10 $ 13.04 $ 48.62
Net present value
Amount in million
Particulars/ Years 1 2 3 4 5 6 7 8 9 10
Cash Flows after Tax $ 4.79 $5.11 $5.4
5
$5.8
0
$6.1
5
$6.5
1
$6.8
8
$7.2
6 $7.64 $13.04
Present Value Factor @
20% 0.833 0.694 0.579 0.482 0.40
2 0.335 0.279 0.233 0.194 0.162
Present Value of Cash
Flows $3.99 $3.55 $3.1
5
$2.7
9
$2.4
7
$2.1
8
$1.9
2
$1.6
9 $1.48 $2.11
Total Present Value of
Cash Flows $25.33
Initial Capital Outlay $20.00
Net Present Value $5.33
Profitability index
Profitability Index Present Value of Cash Inflows / Initial investment
Paraphrase This Document
Need a fresh take? Get an instant paraphrase of this document with our AI Paraphraser
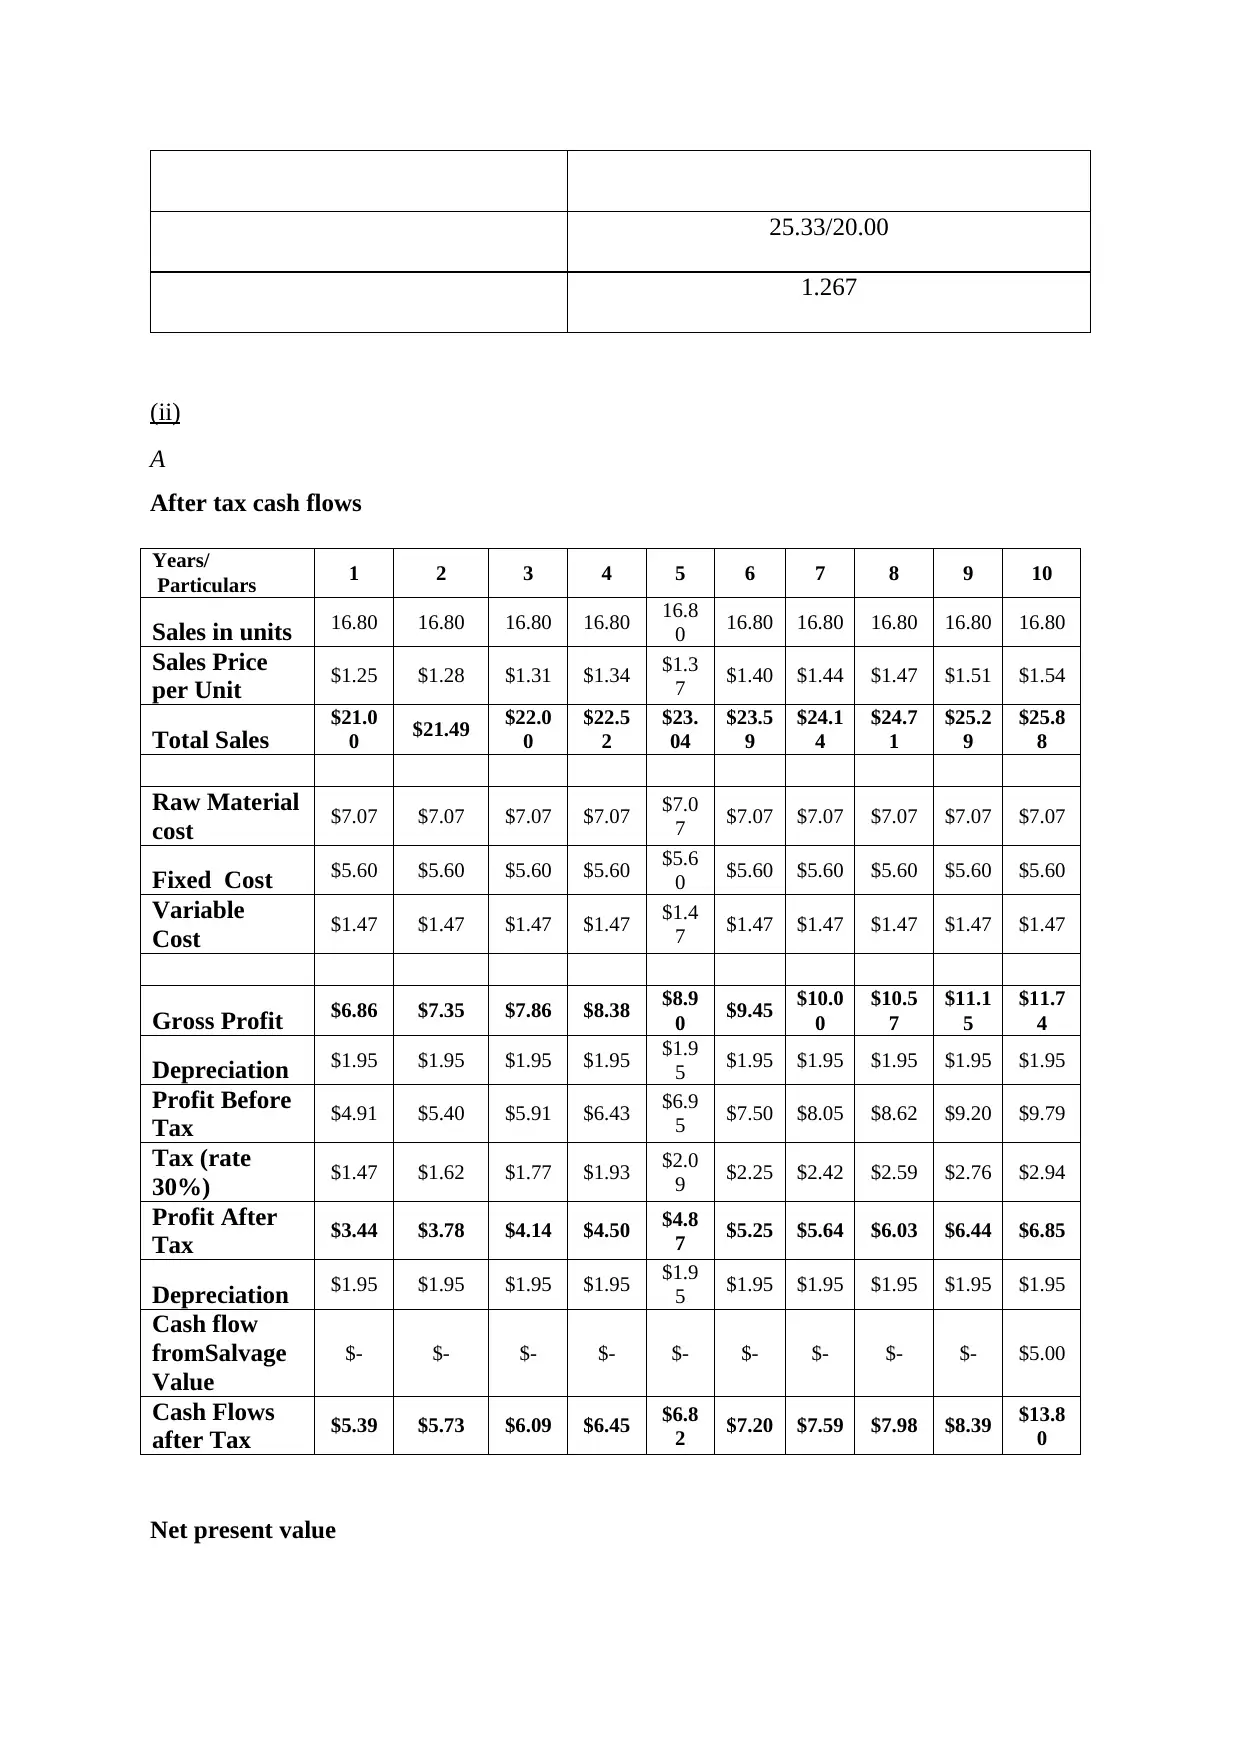
25.33/20.00
1.267
(ii)
A
After tax cash flows
Years/
Particulars 1 2 3 4 5 6 7 8 9 10
Sales in units 16.80 16.80 16.80 16.80 16.8
0 16.80 16.80 16.80 16.80 16.80
Sales Price
per Unit $1.25 $1.28 $1.31 $1.34 $1.3
7 $1.40 $1.44 $1.47 $1.51 $1.54
Total Sales $21.0
0 $21.49 $22.0
0
$22.5
2
$23.
04
$23.5
9
$24.1
4
$24.7
1
$25.2
9
$25.8
8
Raw Material
cost $7.07 $7.07 $7.07 $7.07 $7.0
7 $7.07 $7.07 $7.07 $7.07 $7.07
Fixed Cost $5.60 $5.60 $5.60 $5.60 $5.6
0 $5.60 $5.60 $5.60 $5.60 $5.60
Variable
Cost $1.47 $1.47 $1.47 $1.47 $1.4
7 $1.47 $1.47 $1.47 $1.47 $1.47
Gross Profit $6.86 $7.35 $7.86 $8.38 $8.9
0 $9.45 $10.0
0
$10.5
7
$11.1
5
$11.7
4
Depreciation $1.95 $1.95 $1.95 $1.95 $1.9
5 $1.95 $1.95 $1.95 $1.95 $1.95
Profit Before
Tax $4.91 $5.40 $5.91 $6.43 $6.9
5 $7.50 $8.05 $8.62 $9.20 $9.79
Tax (rate
30%) $1.47 $1.62 $1.77 $1.93 $2.0
9 $2.25 $2.42 $2.59 $2.76 $2.94
Profit After
Tax $3.44 $3.78 $4.14 $4.50 $4.8
7 $5.25 $5.64 $6.03 $6.44 $6.85
Depreciation $1.95 $1.95 $1.95 $1.95 $1.9
5 $1.95 $1.95 $1.95 $1.95 $1.95
Cash flow
fromSalvage
Value
$- $- $- $- $- $- $- $- $- $5.00
Cash Flows
after Tax $5.39 $5.73 $6.09 $6.45 $6.8
2 $7.20 $7.59 $7.98 $8.39 $13.8
0
Net present value
Amount in million
Years/
Particulars/ 1 2 3 4 5 6 7 8 9 10
Cash Flows
after Tax $5.39 $5.73 $6.09 $6.45 $6.82 $7.20 $7.59 $7.98 $8.39 $13.8
0
Present
Value Factor
@ 20%
0.833 0.694 0.579 0.482 0.402 0.335 0.279 0.233 0.194 0.162
Present
Value of
Cash Flows
$4.49 $3.98 $3.52 $3.11 $2.74 $2.41 $2.12 $1.86 $1.63 $2.23
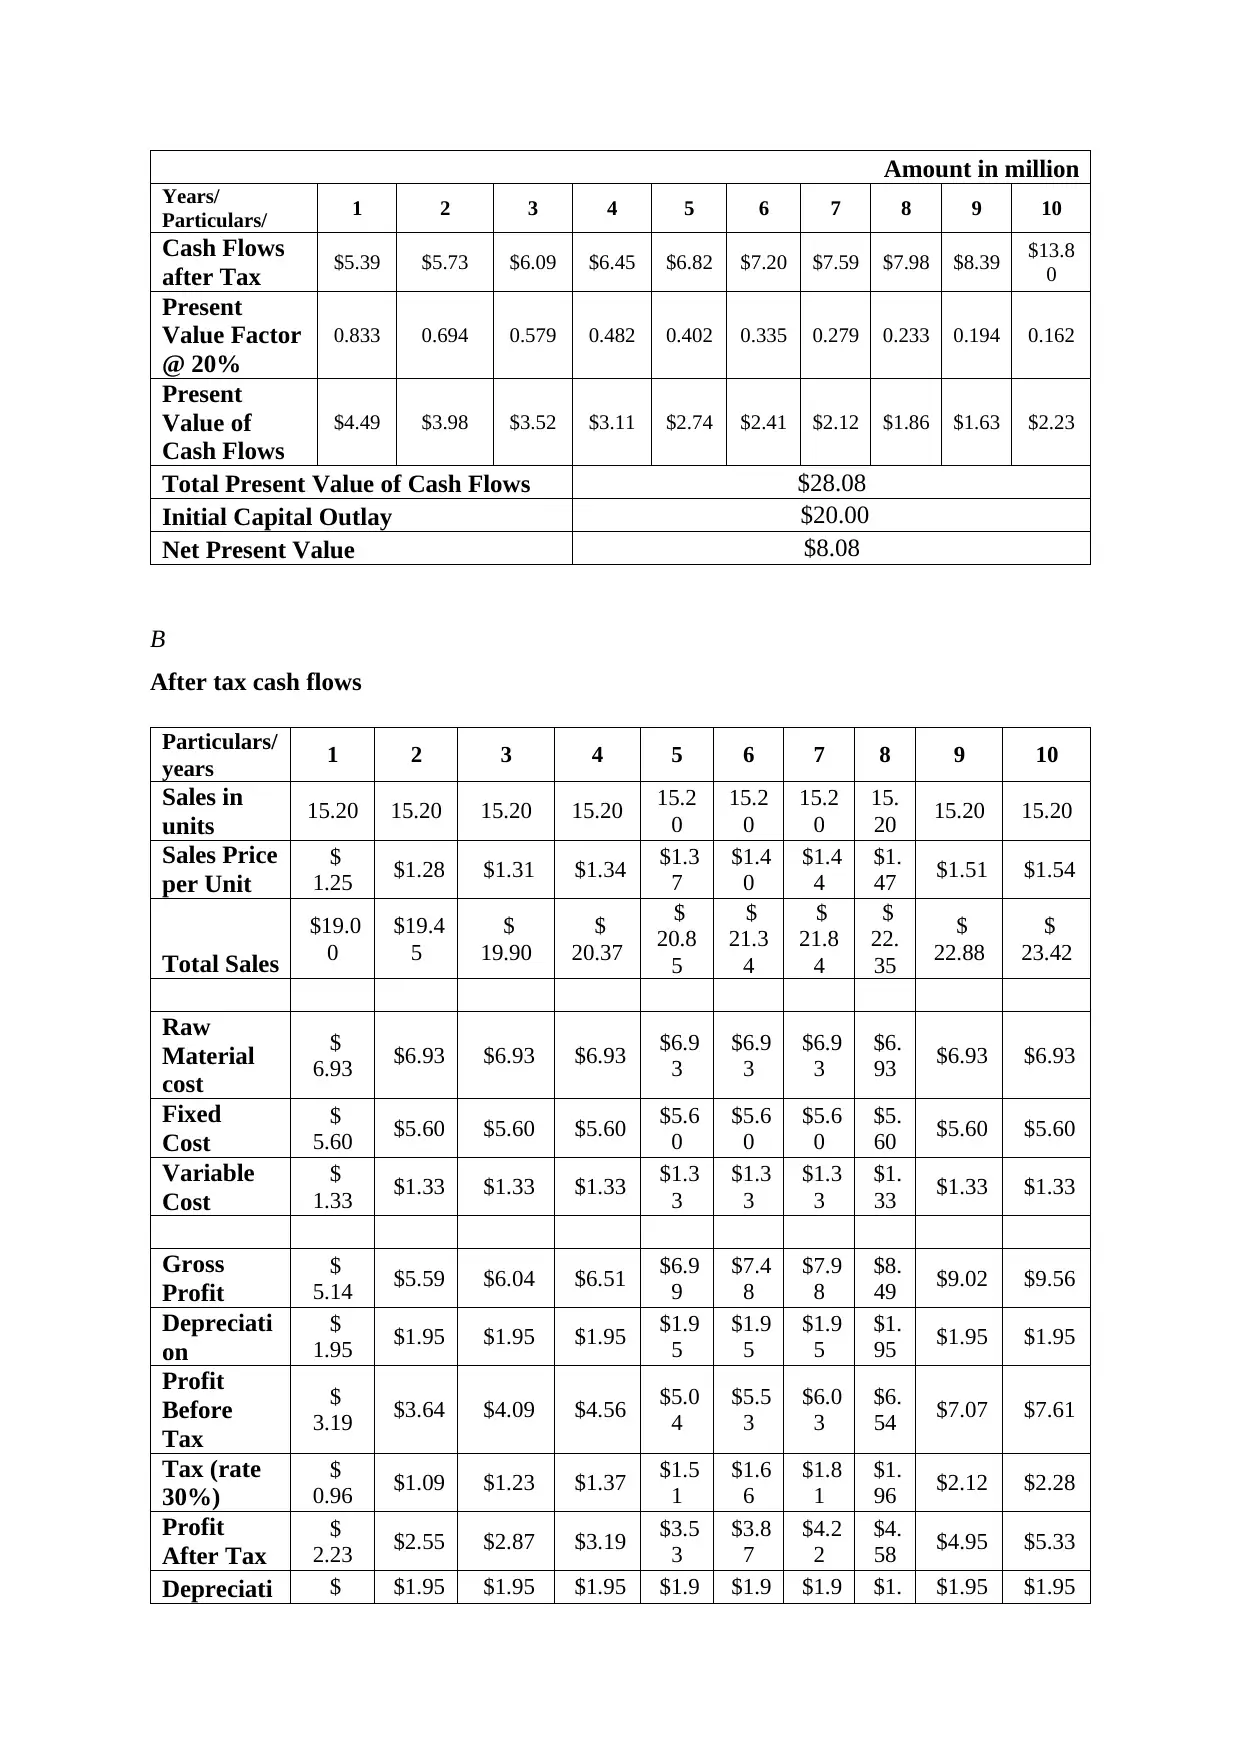
Total Present Value of Cash Flows $28.08
Initial Capital Outlay $20.00
Net Present Value $8.08
B
After tax cash flows
Particulars/
years 1 2 3 4 5 6 7 8 9 10
Sales in
units 15.20 15.20 15.20 15.20 15.2
0
15.2
0
15.2
0
15.
20 15.20 15.20
Sales Price
per Unit
$
1.25 $1.28 $1.31 $1.34 $1.3
7
$1.4
0
$1.4
4
$1.
47 $1.51 $1.54
Total Sales
$19.0
0
$19.4
5
$
19.90
$
20.37
$
20.8
5
$
21.3
4
$
21.8
4
$
22.
35
$
22.88
$
23.42
Raw
Material
cost
$
6.93 $6.93 $6.93 $6.93 $6.9
3
$6.9
3
$6.9
3
$6.
93 $6.93 $6.93
Fixed
Cost
$
5.60 $5.60 $5.60 $5.60 $5.6
0
$5.6
0
$5.6
0
$5.
60 $5.60 $5.60
Variable
Cost
$
1.33 $1.33 $1.33 $1.33 $1.3
3
$1.3
3
$1.3
3
$1.
33 $1.33 $1.33
Gross
Profit
$
5.14 $5.59 $6.04 $6.51 $6.9
9
$7.4
8
$7.9
8
$8.
49 $9.02 $9.56
Depreciati
on
$
1.95 $1.95 $1.95 $1.95 $1.9
5
$1.9
5
$1.9
5
$1.
95 $1.95 $1.95
Profit
Before
Tax
$
3.19 $3.64 $4.09 $4.56 $5.0
4
$5.5
3
$6.0
3
$6.
54 $7.07 $7.61
Tax (rate
30%)
$
0.96 $1.09 $1.23 $1.37 $1.5
1
$1.6
6
$1.8
1
$1.
96 $2.12 $2.28
Profit
After Tax
$
2.23 $2.55 $2.87 $3.19 $3.5
3
$3.8
7
$4.2
2
$4.
58 $4.95 $5.33
Depreciati $ $1.95 $1.95 $1.95 $1.9 $1.9 $1.9 $1. $1.95 $1.95
Years/
Particulars/ 1 2 3 4 5 6 7 8 9 10
Cash Flows
after Tax $5.39 $5.73 $6.09 $6.45 $6.82 $7.20 $7.59 $7.98 $8.39 $13.8
0
Present
Value Factor
@ 20%
0.833 0.694 0.579 0.482 0.402 0.335 0.279 0.233 0.194 0.162
Present
Value of
Cash Flows
$4.49 $3.98 $3.52 $3.11 $2.74 $2.41 $2.12 $1.86 $1.63 $2.23
Total Present Value of Cash Flows $28.08
Initial Capital Outlay $20.00
Net Present Value $8.08
B
After tax cash flows
Particulars/
years 1 2 3 4 5 6 7 8 9 10
Sales in
units 15.20 15.20 15.20 15.20 15.2
0
15.2
0
15.2
0
15.
20 15.20 15.20
Sales Price
per Unit
$
1.25 $1.28 $1.31 $1.34 $1.3
7
$1.4
0
$1.4
4
$1.
47 $1.51 $1.54
Total Sales
$19.0
0
$19.4
5
$
19.90
$
20.37
$
20.8
5
$
21.3
4
$
21.8
4
$
22.
35
$
22.88
$
23.42
Raw
Material
cost
$
6.93 $6.93 $6.93 $6.93 $6.9
3
$6.9
3
$6.9
3
$6.
93 $6.93 $6.93
Fixed
Cost
$
5.60 $5.60 $5.60 $5.60 $5.6
0
$5.6
0
$5.6
0
$5.
60 $5.60 $5.60
Variable
Cost
$
1.33 $1.33 $1.33 $1.33 $1.3
3
$1.3
3
$1.3
3
$1.
33 $1.33 $1.33
Gross
Profit
$
5.14 $5.59 $6.04 $6.51 $6.9
9
$7.4
8
$7.9
8
$8.
49 $9.02 $9.56
Depreciati
on
$
1.95 $1.95 $1.95 $1.95 $1.9
5
$1.9
5
$1.9
5
$1.
95 $1.95 $1.95
Profit
Before
Tax
$
3.19 $3.64 $4.09 $4.56 $5.0
4
$5.5
3
$6.0
3
$6.
54 $7.07 $7.61
Tax (rate
30%)
$
0.96 $1.09 $1.23 $1.37 $1.5
1
$1.6
6
$1.8
1
$1.
96 $2.12 $2.28
Profit
After Tax
$
2.23 $2.55 $2.87 $3.19 $3.5
3
$3.8
7
$4.2
2
$4.
58 $4.95 $5.33
Depreciati $ $1.95 $1.95 $1.95 $1.9 $1.9 $1.9 $1. $1.95 $1.95
⊘ This is a preview!⊘
Do you want full access?
Subscribe today to unlock all pages.
Trusted by 1+ million students worldwide
on 1.95 5 5 5 95
Cash flow
fromSalva
ge Value
$ - $ - $ - $ - $ - $ - $ - $ - $ - $5.00
Cash
Flows
after Tax
$
4.18 $4.50 $4.82 $5.14 $5.4
8
$5.8
2
$6.1
7
$6.
53 $6.90 $
12.28
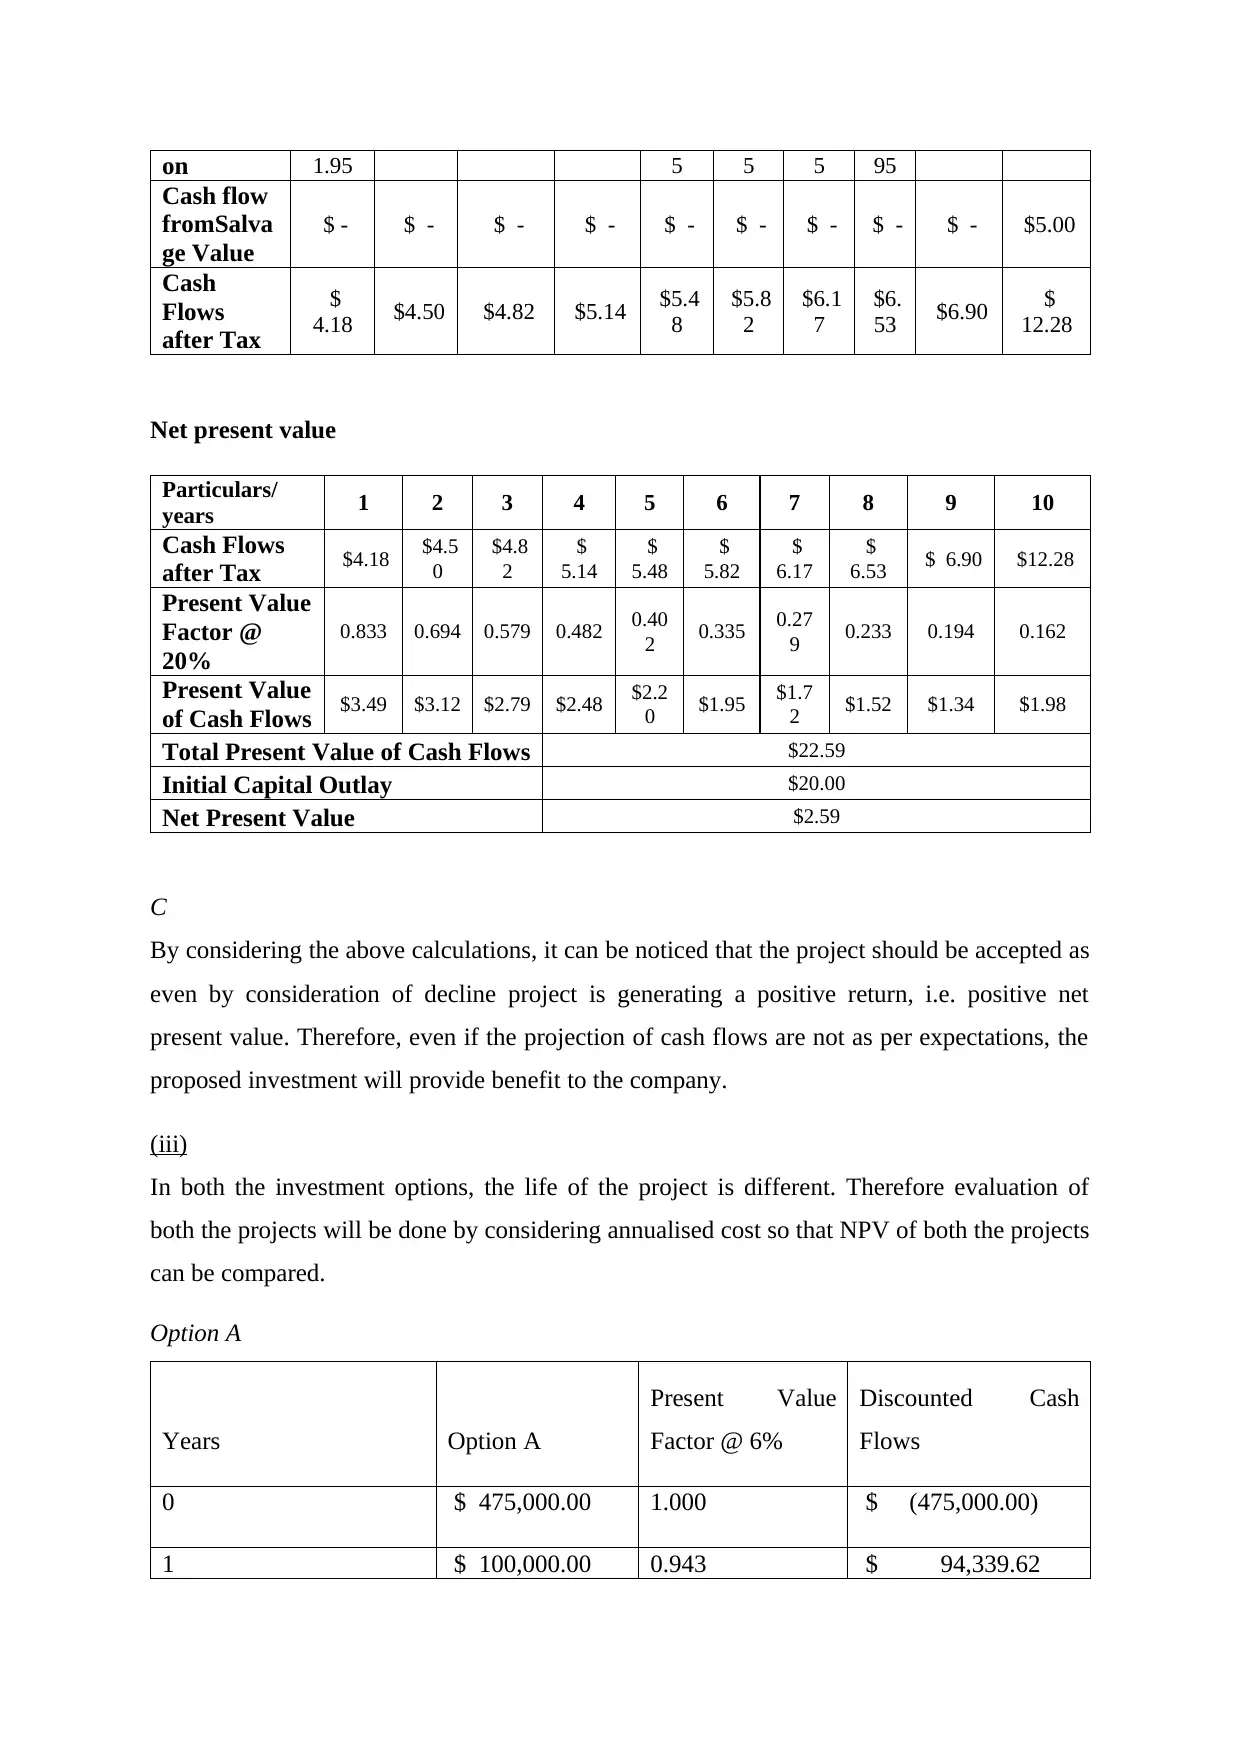
Net present value
Particulars/
years 1 2 3 4 5 6 7 8 9 10
Cash Flows
after Tax $4.18 $4.5
0
$4.8
2
$
5.14
$
5.48
$
5.82
$
6.17
$
6.53 $ 6.90 $12.28
Present Value
Factor @
20%
0.833 0.694 0.579 0.482 0.40
2 0.335 0.27
9 0.233 0.194 0.162
Present Value
of Cash Flows $3.49 $3.12 $2.79 $2.48 $2.2
0 $1.95 $1.7
2 $1.52 $1.34 $1.98
Total Present Value of Cash Flows $22.59
Initial Capital Outlay $20.00
Net Present Value $2.59
C
By considering the above calculations, it can be noticed that the project should be accepted as
even by consideration of decline project is generating a positive return, i.e. positive net
present value. Therefore, even if the projection of cash flows are not as per expectations, the
proposed investment will provide benefit to the company.
(iii)
In both the investment options, the life of the project is different. Therefore evaluation of
both the projects will be done by considering annualised cost so that NPV of both the projects
can be compared.
Option A
Years Option A
Present Value
Factor @ 6%
Discounted Cash
Flows
0 $ 475,000.00 1.000 $ (475,000.00)
1 $ 100,000.00 0.943 $ 94,339.62
Cash flow
fromSalva
ge Value
$ - $ - $ - $ - $ - $ - $ - $ - $ - $5.00
Cash
Flows
after Tax
$
4.18 $4.50 $4.82 $5.14 $5.4
8
$5.8
2
$6.1
7
$6.
53 $6.90 $
12.28
Net present value
Particulars/
years 1 2 3 4 5 6 7 8 9 10
Cash Flows
after Tax $4.18 $4.5
0
$4.8
2
$
5.14
$
5.48
$
5.82
$
6.17
$
6.53 $ 6.90 $12.28
Present Value
Factor @
20%
0.833 0.694 0.579 0.482 0.40
2 0.335 0.27
9 0.233 0.194 0.162
Present Value
of Cash Flows $3.49 $3.12 $2.79 $2.48 $2.2
0 $1.95 $1.7
2 $1.52 $1.34 $1.98
Total Present Value of Cash Flows $22.59
Initial Capital Outlay $20.00
Net Present Value $2.59
C
By considering the above calculations, it can be noticed that the project should be accepted as
even by consideration of decline project is generating a positive return, i.e. positive net
present value. Therefore, even if the projection of cash flows are not as per expectations, the
proposed investment will provide benefit to the company.
(iii)
In both the investment options, the life of the project is different. Therefore evaluation of
both the projects will be done by considering annualised cost so that NPV of both the projects
can be compared.
Option A
Years Option A
Present Value
Factor @ 6%
Discounted Cash
Flows
0 $ 475,000.00 1.000 $ (475,000.00)
1 $ 100,000.00 0.943 $ 94,339.62
Paraphrase This Document
Need a fresh take? Get an instant paraphrase of this document with our AI Paraphraser
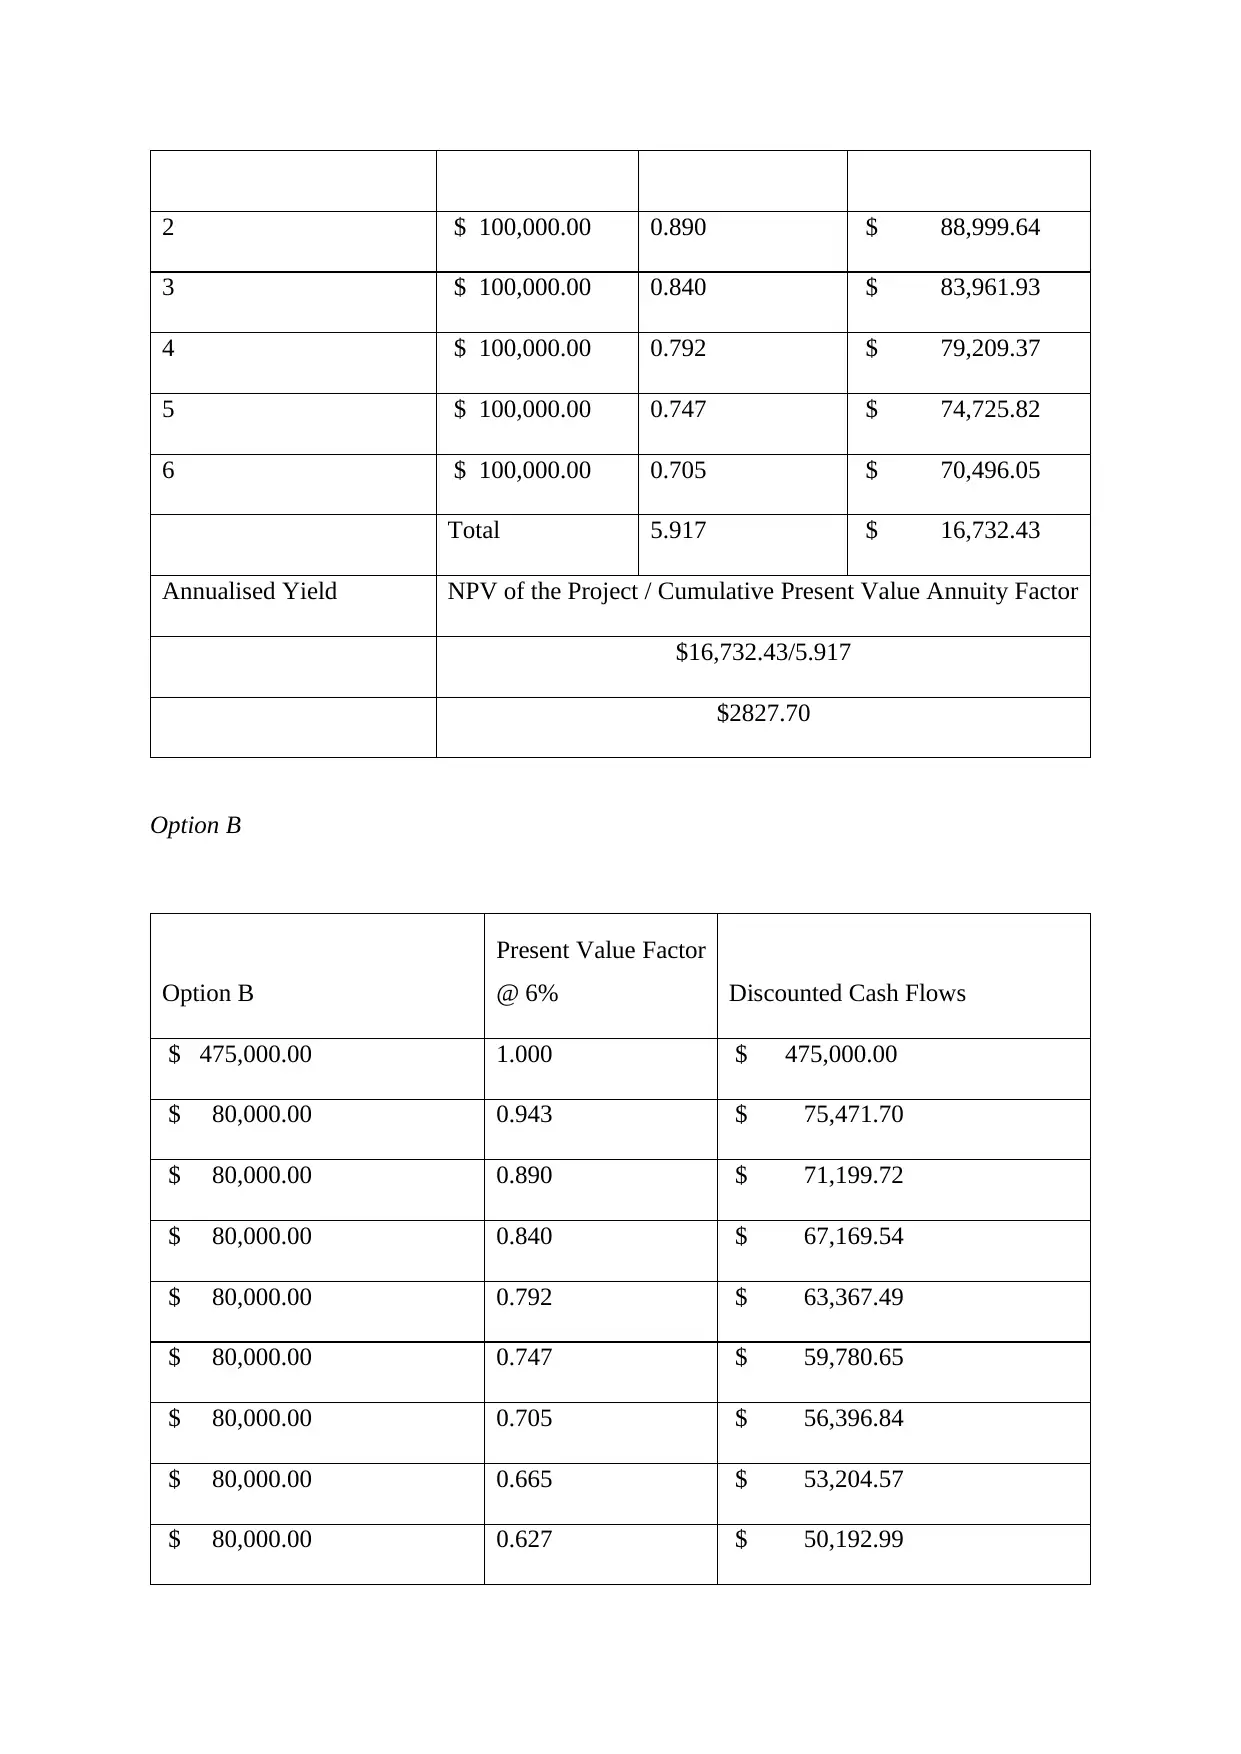
2 $ 100,000.00 0.890 $ 88,999.64
3 $ 100,000.00 0.840 $ 83,961.93
4 $ 100,000.00 0.792 $ 79,209.37
5 $ 100,000.00 0.747 $ 74,725.82
6 $ 100,000.00 0.705 $ 70,496.05
Total 5.917 $ 16,732.43
Annualised Yield NPV of the Project / Cumulative Present Value Annuity Factor
$16,732.43/5.917
$2827.70
Option B
Option B
Present Value Factor
@ 6% Discounted Cash Flows
$ 475,000.00 1.000 $ 475,000.00
$ 80,000.00 0.943 $ 75,471.70
$ 80,000.00 0.890 $ 71,199.72
$ 80,000.00 0.840 $ 67,169.54
$ 80,000.00 0.792 $ 63,367.49
$ 80,000.00 0.747 $ 59,780.65
$ 80,000.00 0.705 $ 56,396.84
$ 80,000.00 0.665 $ 53,204.57
$ 80,000.00 0.627 $ 50,192.99
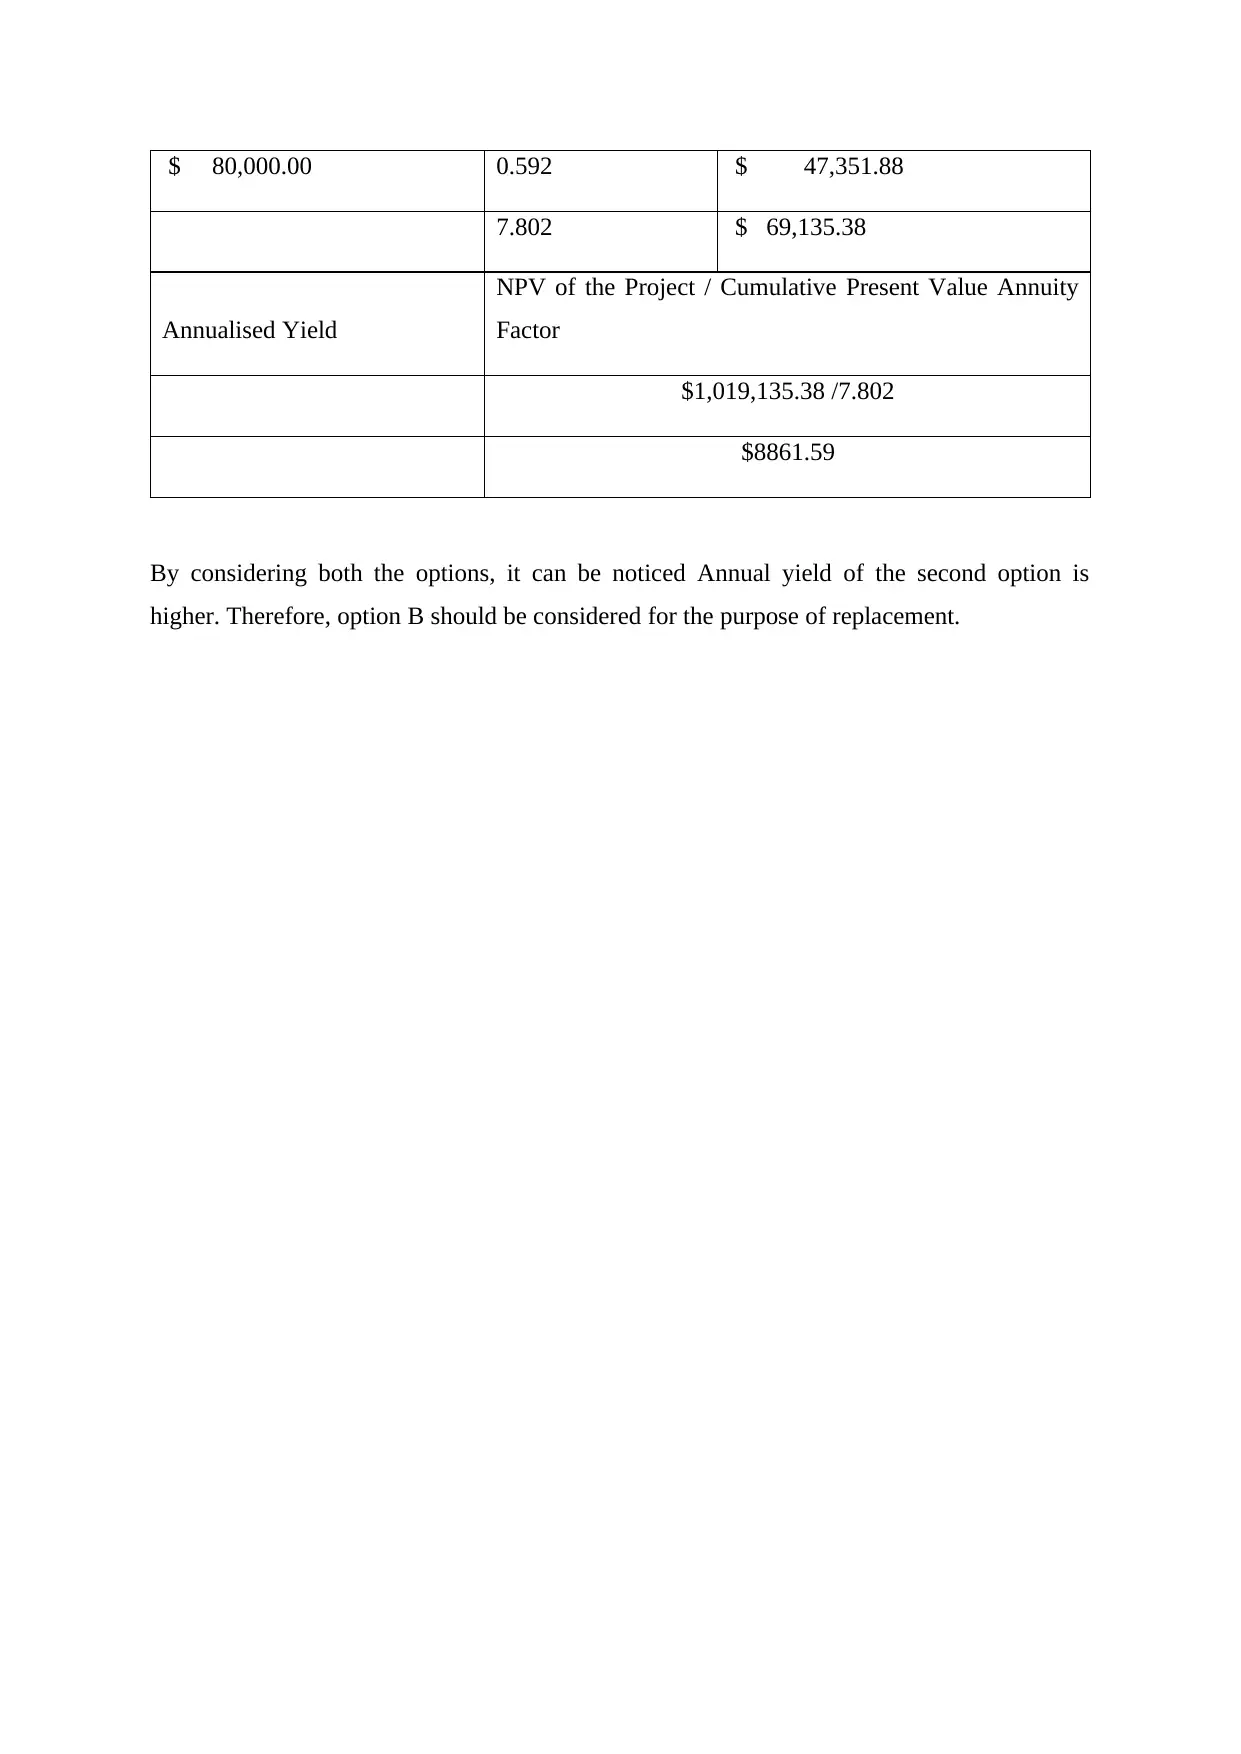
$ 80,000.00 0.592 $ 47,351.88
7.802 $ 69,135.38
Annualised Yield
NPV of the Project / Cumulative Present Value Annuity
Factor
$1,019,135.38 /7.802
$8861.59
By considering both the options, it can be noticed Annual yield of the second option is
higher. Therefore, option B should be considered for the purpose of replacement.
7.802 $ 69,135.38
Annualised Yield
NPV of the Project / Cumulative Present Value Annuity
Factor
$1,019,135.38 /7.802
$8861.59
By considering both the options, it can be noticed Annual yield of the second option is
higher. Therefore, option B should be considered for the purpose of replacement.
⊘ This is a preview!⊘
Do you want full access?
Subscribe today to unlock all pages.
Trusted by 1+ million students worldwide
PART B
Executive summary
Financial analysis is considered as the procedure of assessing business, budgets, projects and
another financial related business enterprise to identify the validity and performance. It is
employed to evaluate if or if not the business entity has enough profitability, solvency,
stability and liquidity to ensure a monetary investment. The prevailing study is based on the
financial analysis of the AMP limited to assess the involved risks and estimate the
performance of the company. The present study shows that the company has maintained an
effective financial structure, by raising balanced equity and debt and fixing the returns of
shareholders.
Introduction
The present study aims to evaluate and analyze the Annual Report of AMP Limited critically;
so as to conduct the comparative analysis of WAACC and capital structure, as well as the
study also covers the evaluation of key financial ratios of the AMP limited, to assess the
financial performance of the company. Following to this, the study also intends to consider
the major changes held in the capital structure of AMP limited in the past three years, with
the consideration towards the material risks identified in the annual report supported by the
appropriate mitigation strategies adopted by the company.
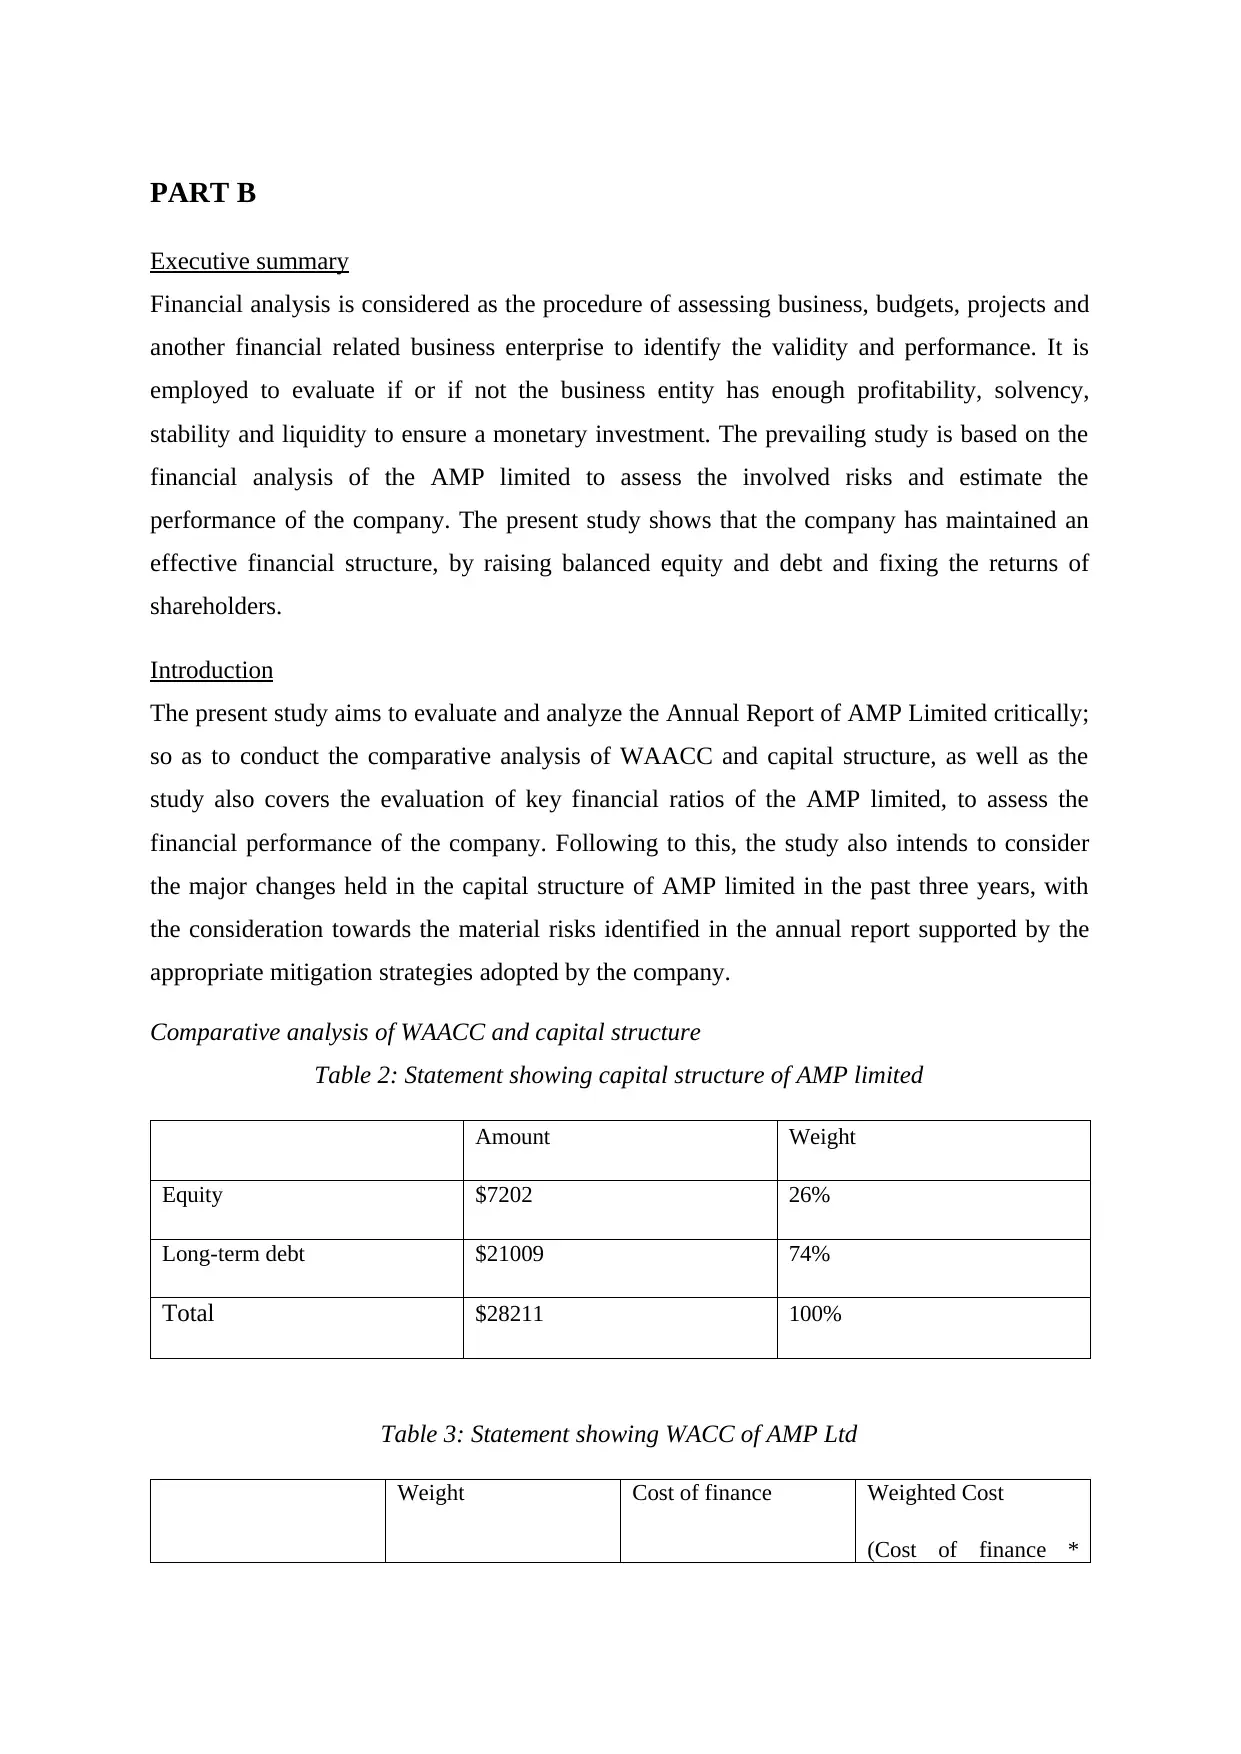
Comparative analysis of WAACC and capital structure
Table 2: Statement showing capital structure of AMP limited
Amount Weight
Equity $7202 26%
Long-term debt $21009 74%
Total $28211 100%
Table 3: Statement showing WACC of AMP Ltd
Weight Cost of finance Weighted Cost
(Cost of finance *
Executive summary
Financial analysis is considered as the procedure of assessing business, budgets, projects and
another financial related business enterprise to identify the validity and performance. It is
employed to evaluate if or if not the business entity has enough profitability, solvency,
stability and liquidity to ensure a monetary investment. The prevailing study is based on the
financial analysis of the AMP limited to assess the involved risks and estimate the
performance of the company. The present study shows that the company has maintained an
effective financial structure, by raising balanced equity and debt and fixing the returns of
shareholders.
Introduction
The present study aims to evaluate and analyze the Annual Report of AMP Limited critically;
so as to conduct the comparative analysis of WAACC and capital structure, as well as the
study also covers the evaluation of key financial ratios of the AMP limited, to assess the
financial performance of the company. Following to this, the study also intends to consider
the major changes held in the capital structure of AMP limited in the past three years, with
the consideration towards the material risks identified in the annual report supported by the
appropriate mitigation strategies adopted by the company.
Comparative analysis of WAACC and capital structure
Table 2: Statement showing capital structure of AMP limited
Amount Weight
Equity $7202 26%
Long-term debt $21009 74%
Total $28211 100%
Table 3: Statement showing WACC of AMP Ltd
Weight Cost of finance Weighted Cost
(Cost of finance *
Paraphrase This Document
Need a fresh take? Get an instant paraphrase of this document with our AI Paraphraser
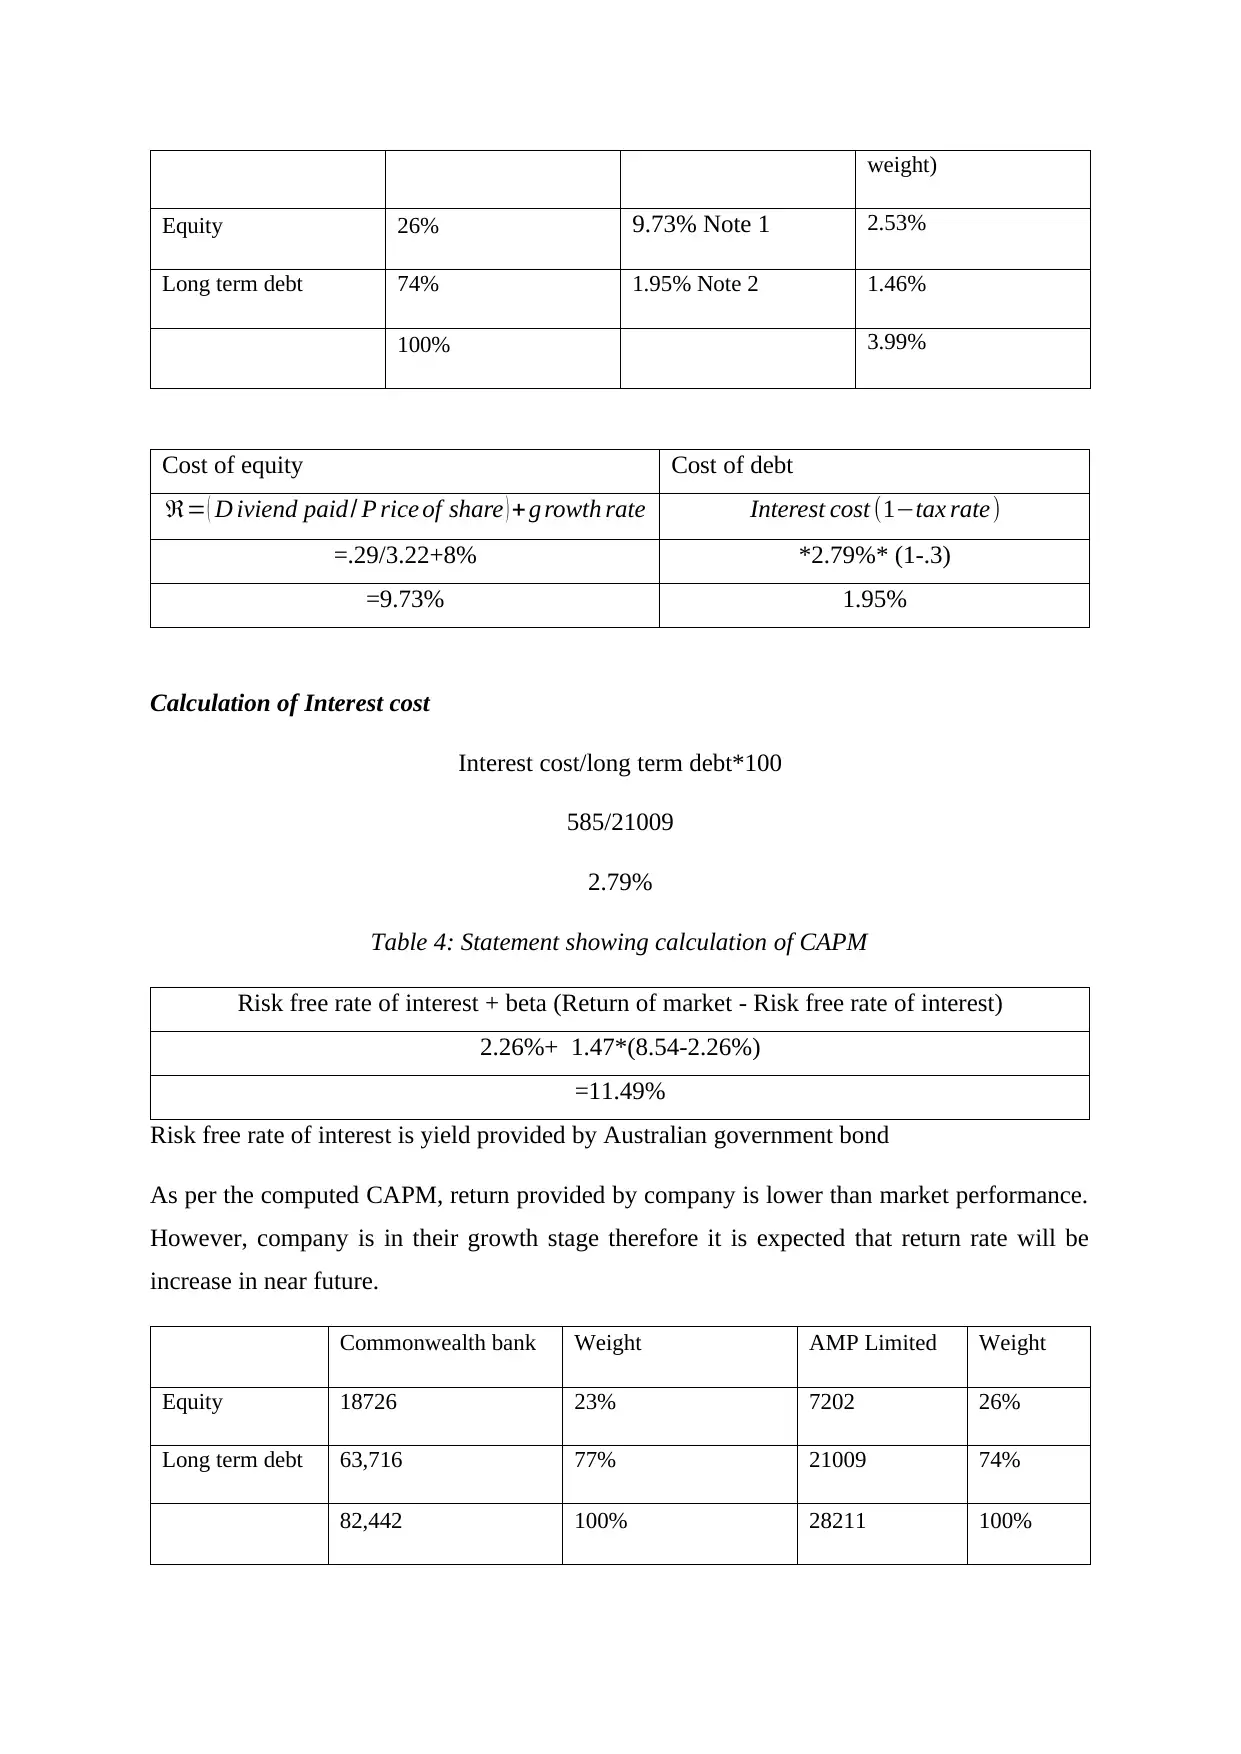
weight)
Equity 26% 9.73% Note 1 2.53%
Long term debt 74% 1.95% Note 2 1.46%
100% 3.99%
Cost of equity Cost of debt
ℜ= ( D iviend paid/ P rice of share ) + g rowth rate Interest cost (1−tax rate)
=.29/3.22+8% *2.79%* (1-.3)
=9.73% 1.95%
Calculation of Interest cost
Interest cost/long term debt*100
585/21009
2.79%
Table 4: Statement showing calculation of CAPM
Risk free rate of interest + beta (Return of market - Risk free rate of interest)
2.26%+ 1.47*(8.54-2.26%)
=11.49%
Risk free rate of interest is yield provided by Australian government bond
As per the computed CAPM, return provided by company is lower than market performance.
However, company is in their growth stage therefore it is expected that return rate will be
increase in near future.
Commonwealth bank Weight AMP Limited Weight
Equity 18726 23% 7202 26%
Long term debt 63,716 77% 21009 74%
82,442 100% 28211 100%
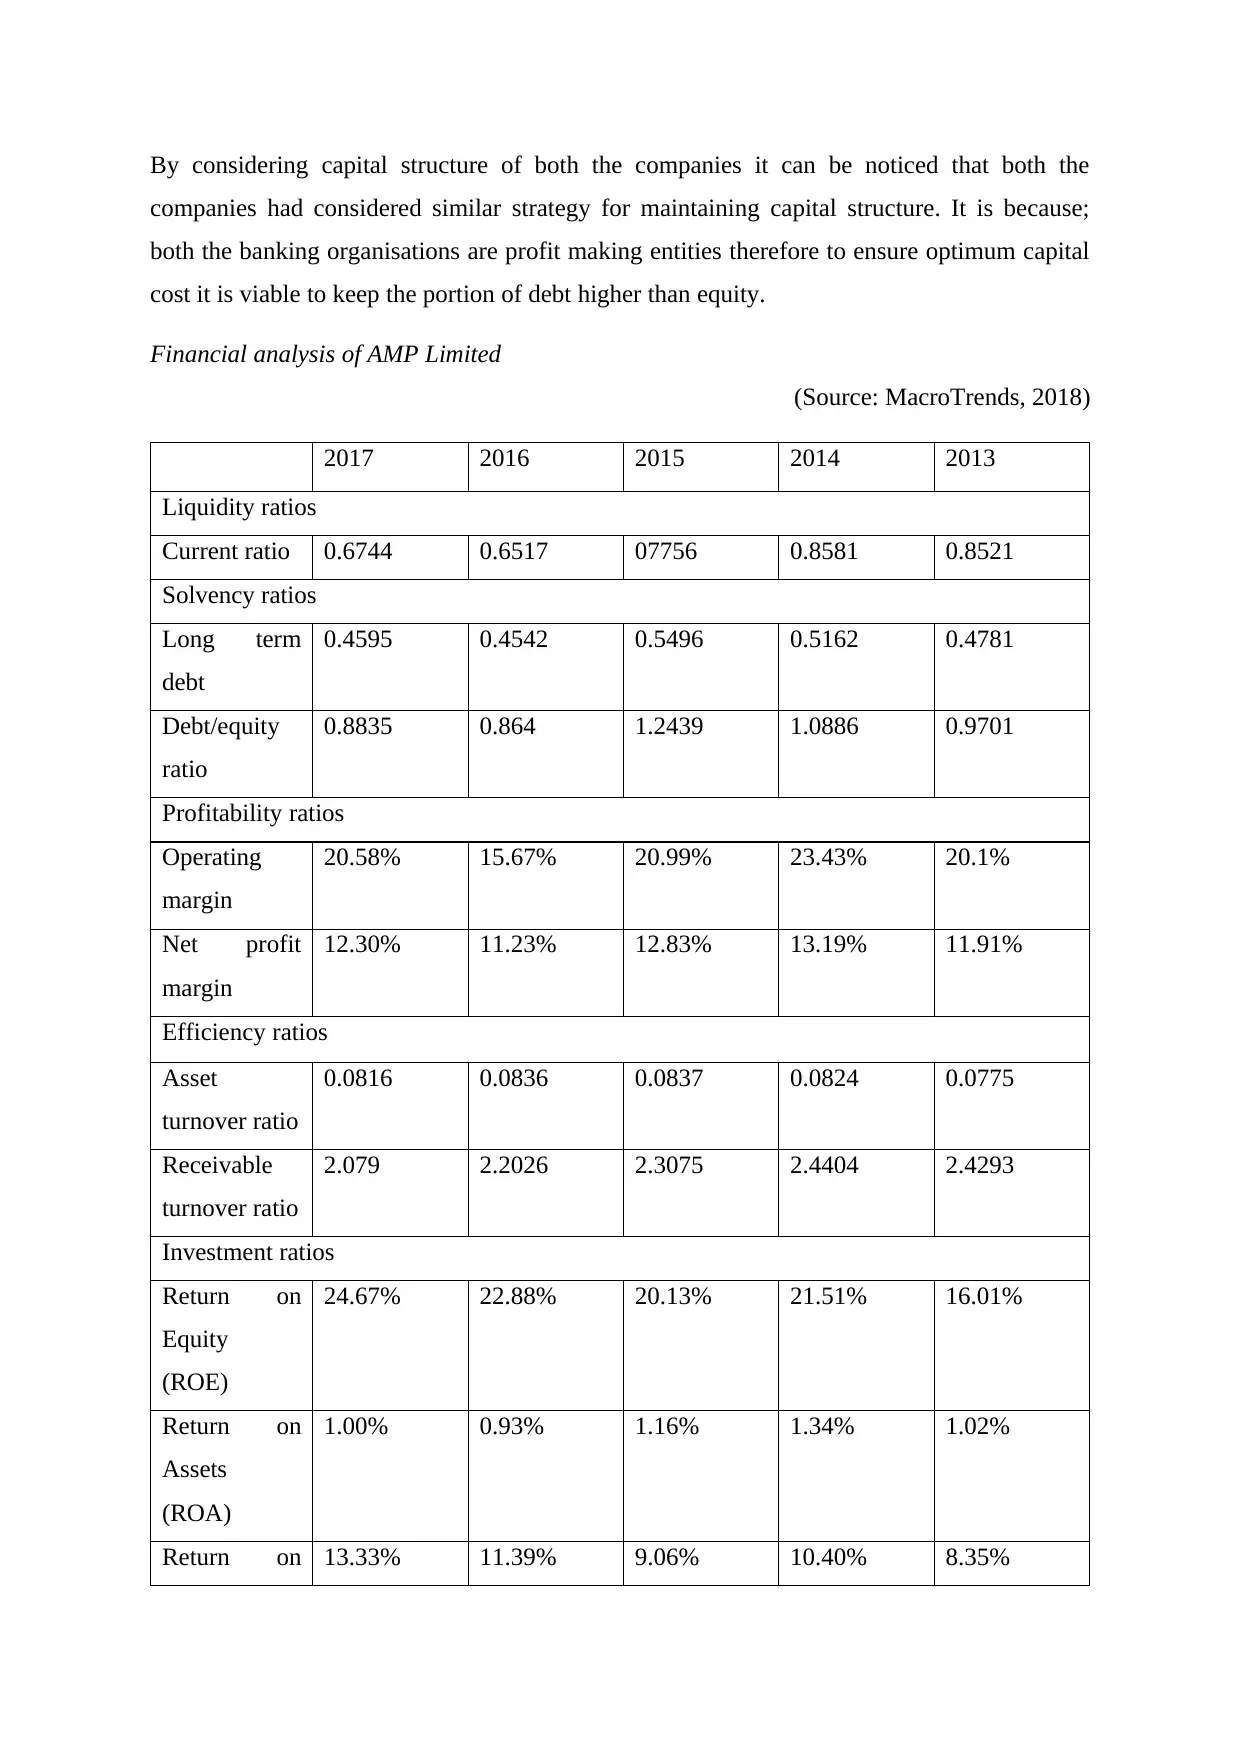
By considering capital structure of both the companies it can be noticed that both the
companies had considered similar strategy for maintaining capital structure. It is because;
both the banking organisations are profit making entities therefore to ensure optimum capital
cost it is viable to keep the portion of debt higher than equity.
Financial analysis of AMP Limited
(Source: MacroTrends, 2018)
2017 2016 2015 2014 2013
Liquidity ratios
Current ratio 0.6744 0.6517 07756 0.8581 0.8521
Solvency ratios
Long term
debt
0.4595 0.4542 0.5496 0.5162 0.4781
Debt/equity
ratio
0.8835 0.864 1.2439 1.0886 0.9701
Profitability ratios
Operating
margin
20.58% 15.67% 20.99% 23.43% 20.1%
Net profit
margin
12.30% 11.23% 12.83% 13.19% 11.91%
Efficiency ratios
Asset
turnover ratio
0.0816 0.0836 0.0837 0.0824 0.0775
Receivable
turnover ratio
2.079 2.2026 2.3075 2.4404 2.4293
Investment ratios
Return on
Equity
(ROE)
24.67% 22.88% 20.13% 21.51% 16.01%
Return on
Assets
(ROA)
1.00% 0.93% 1.16% 1.34% 1.02%
Return on 13.33% 11.39% 9.06% 10.40% 8.35%
⊘ This is a preview!⊘
Do you want full access?
Subscribe today to unlock all pages.
Trusted by 1+ million students worldwide
1 out of 17


Your All-in-One AI-Powered Toolkit for Academic Success.
+13062052269
info@desklib.com
Available 24*7 on WhatsApp / Email
![[object Object]](/_next/static/media/star-bottom.7253800d.svg)
Unlock your academic potential
Copyright © 2020–2026 A2Z Services. All Rights Reserved. Developed and managed by ZUCOL.