Decision Support Tools: Investment Analysis and Simulation Models
VerifiedAdded on 2023/06/04
|17
|1703
|186
Homework Assignment
AI Summary
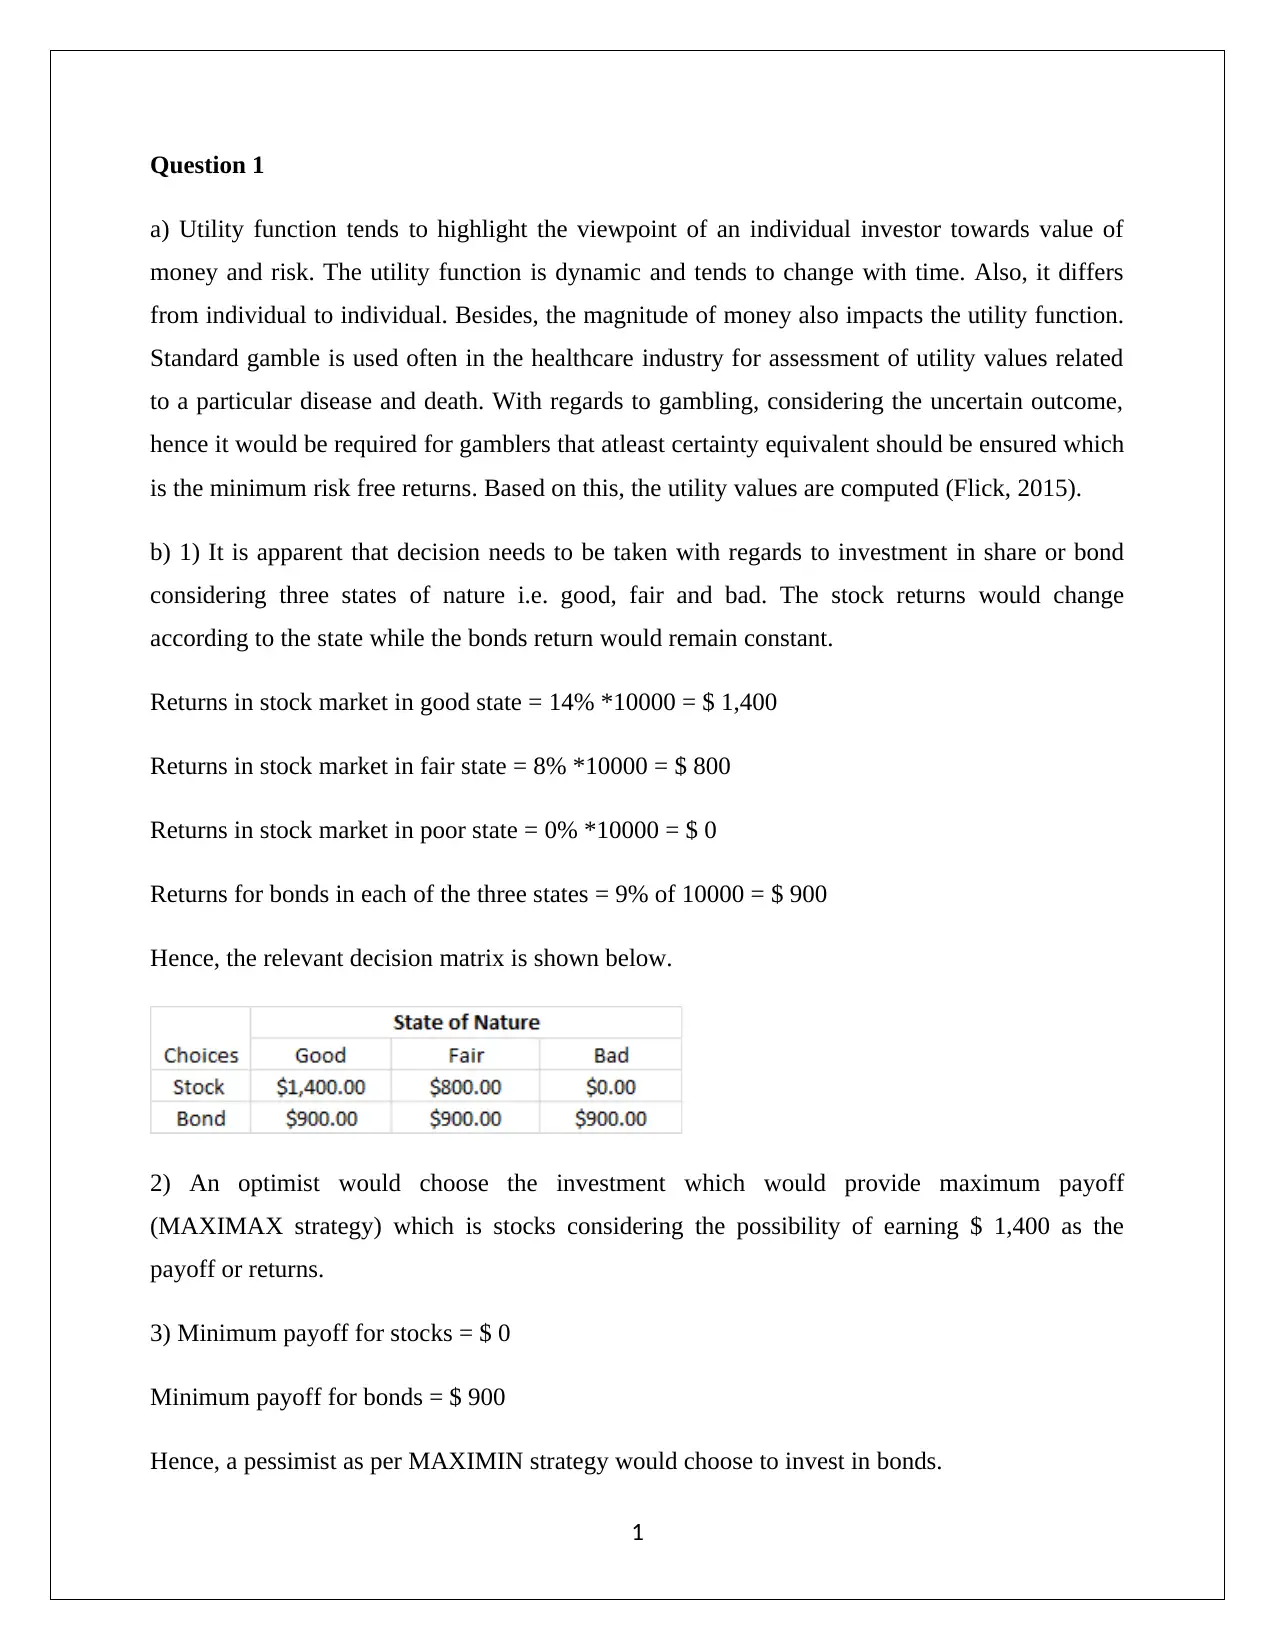
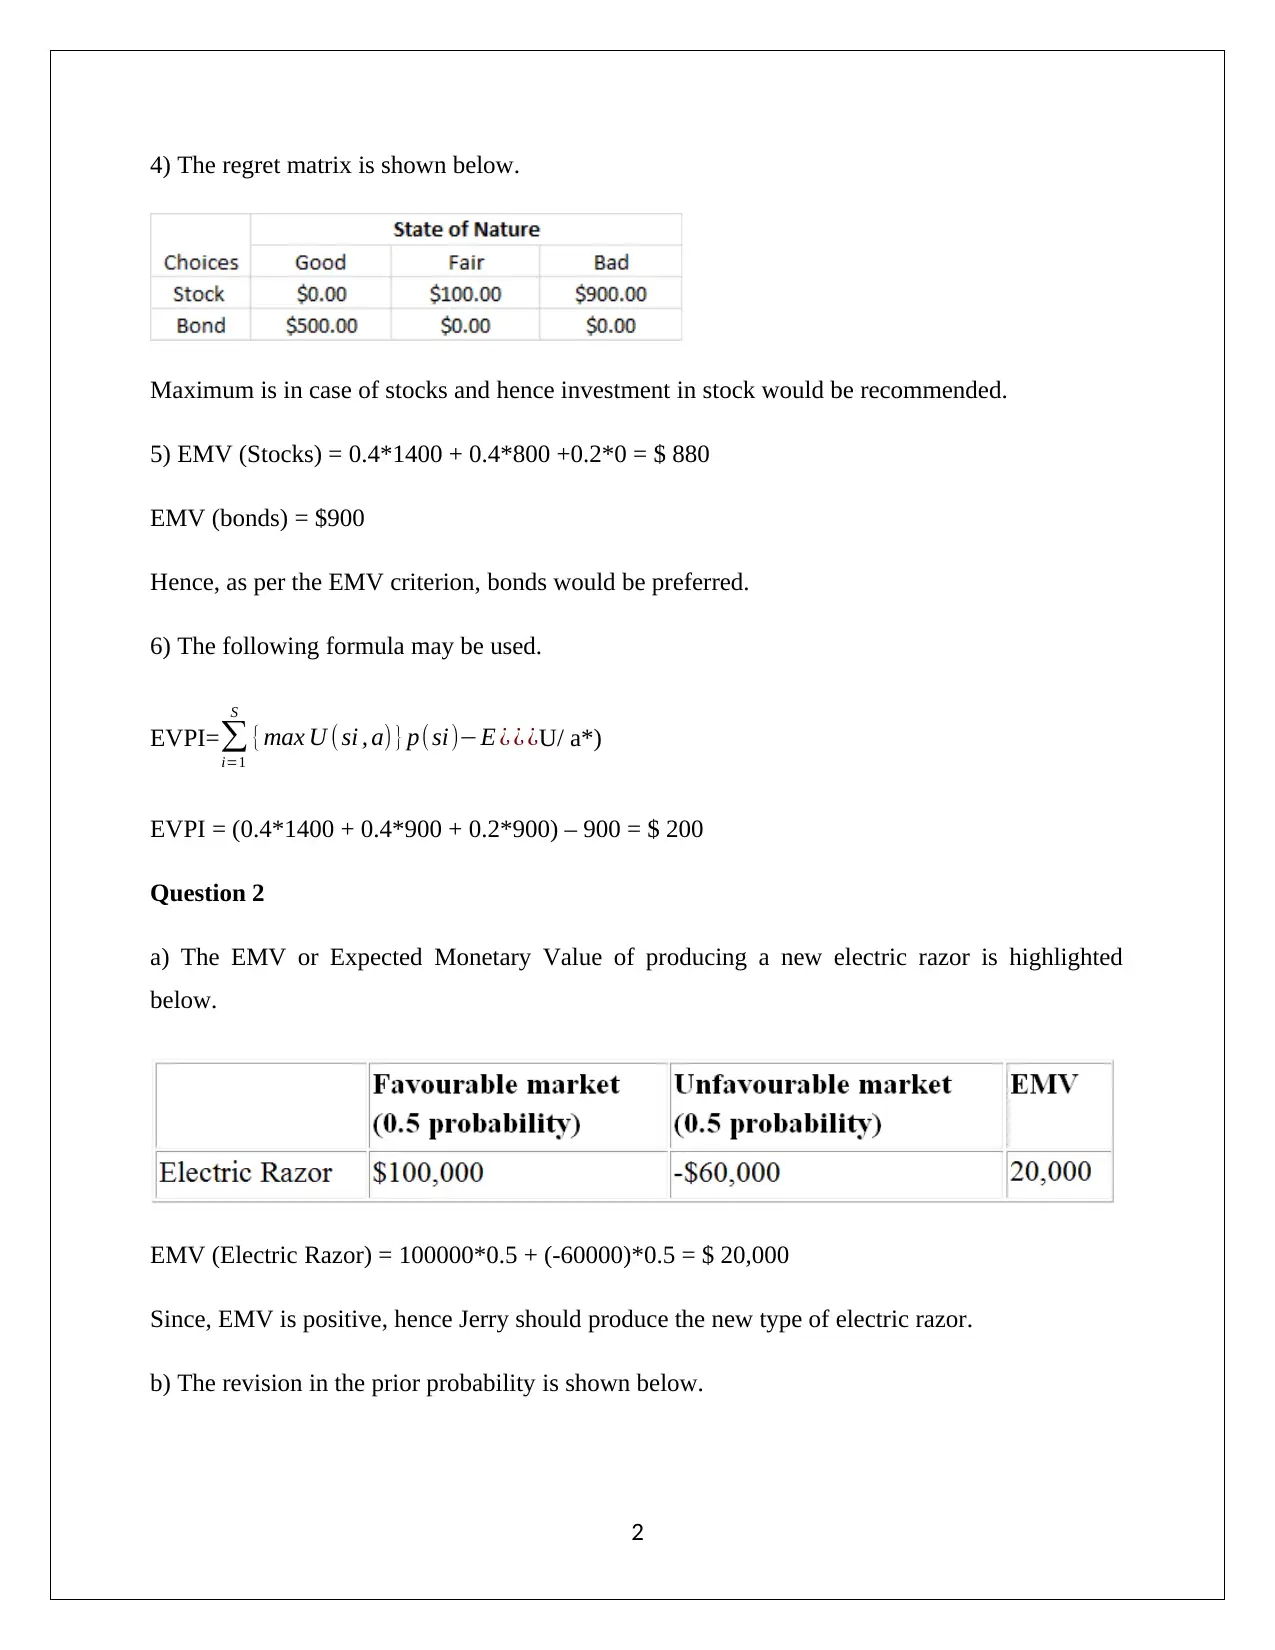
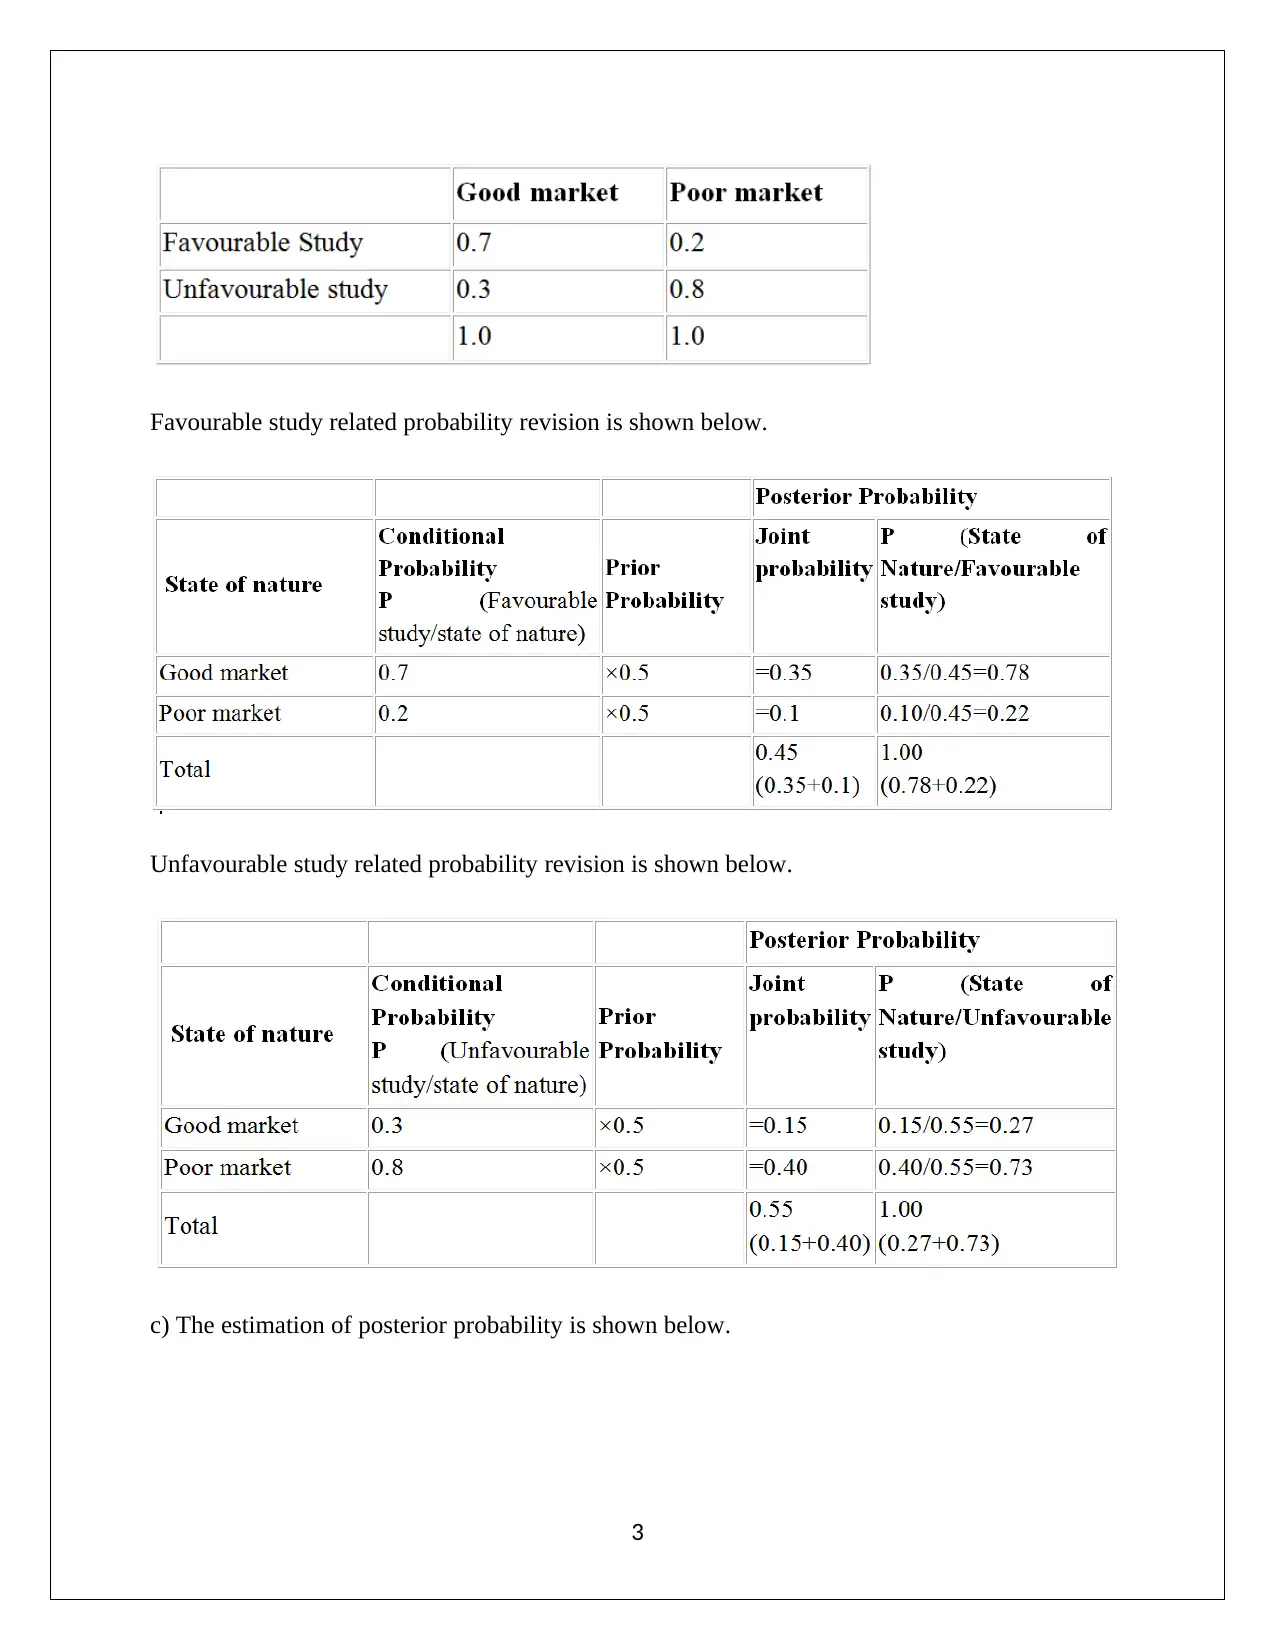
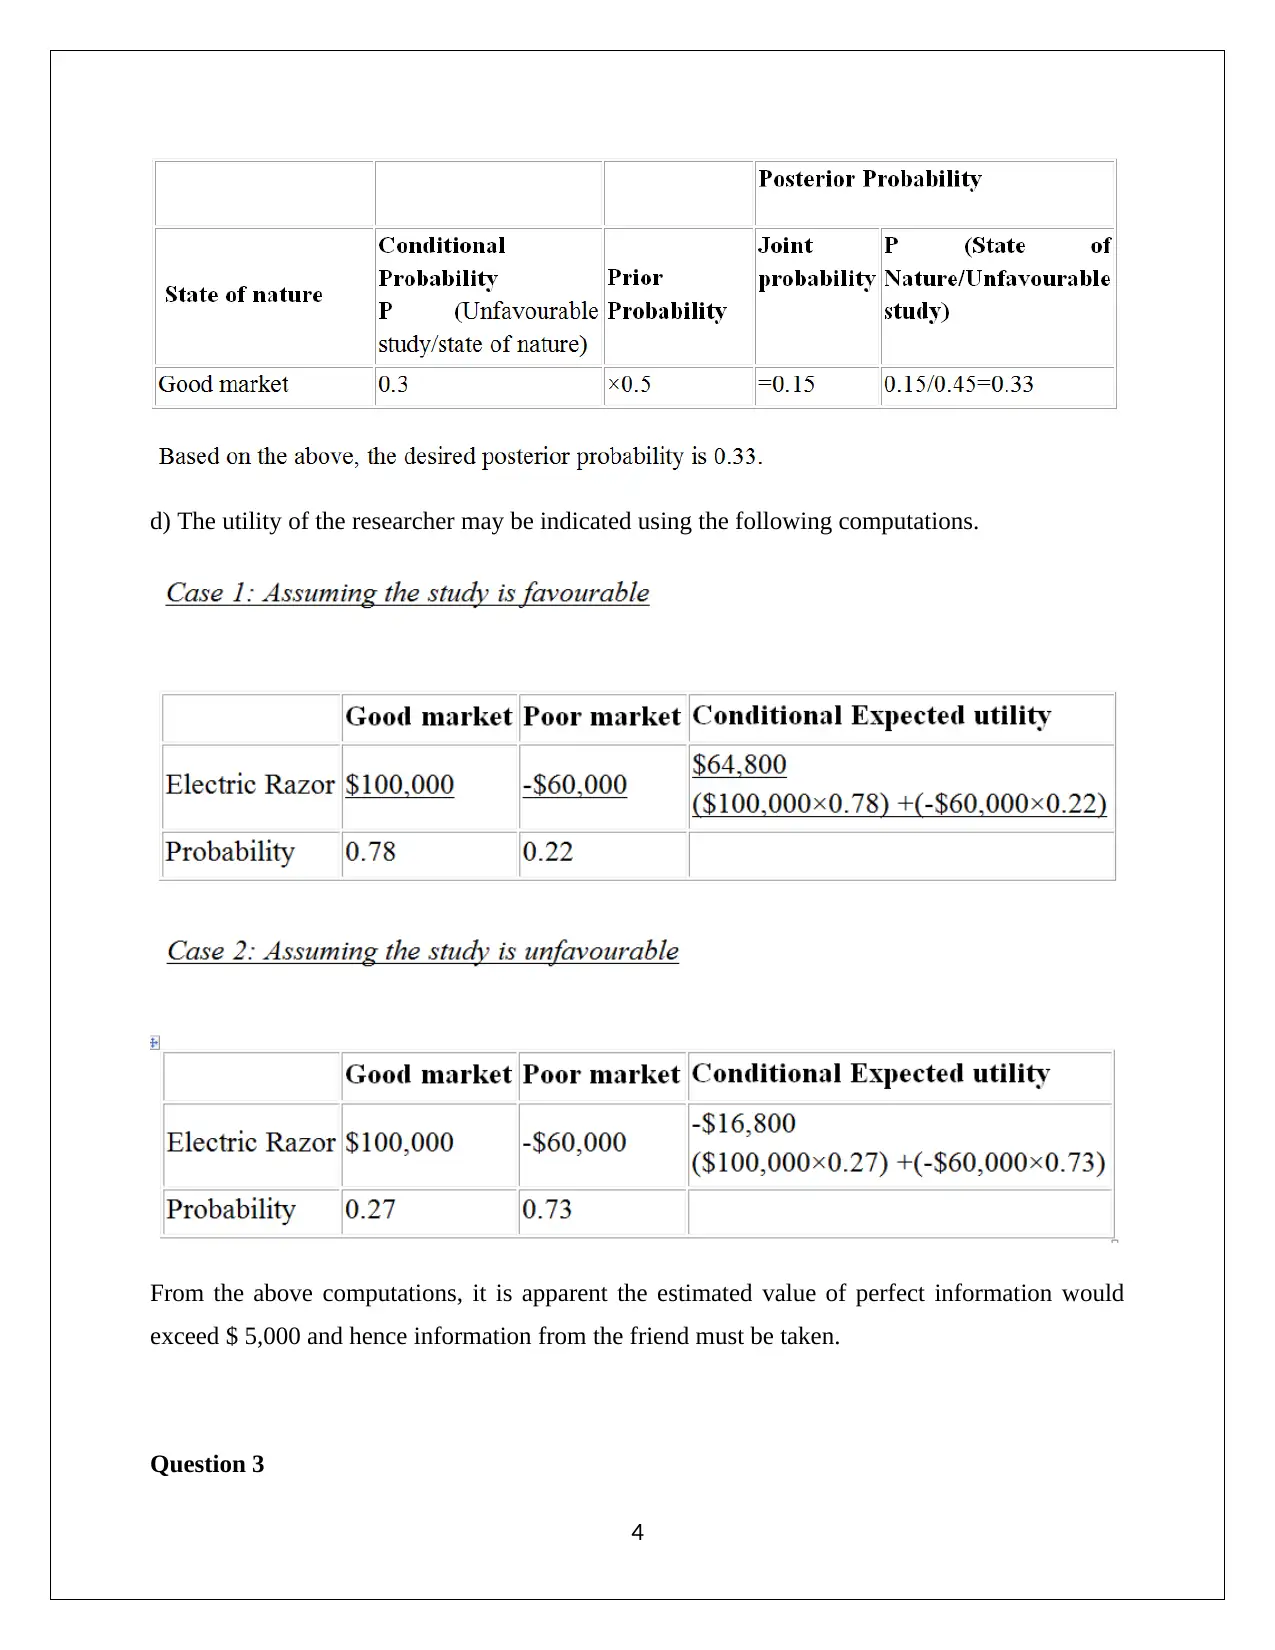
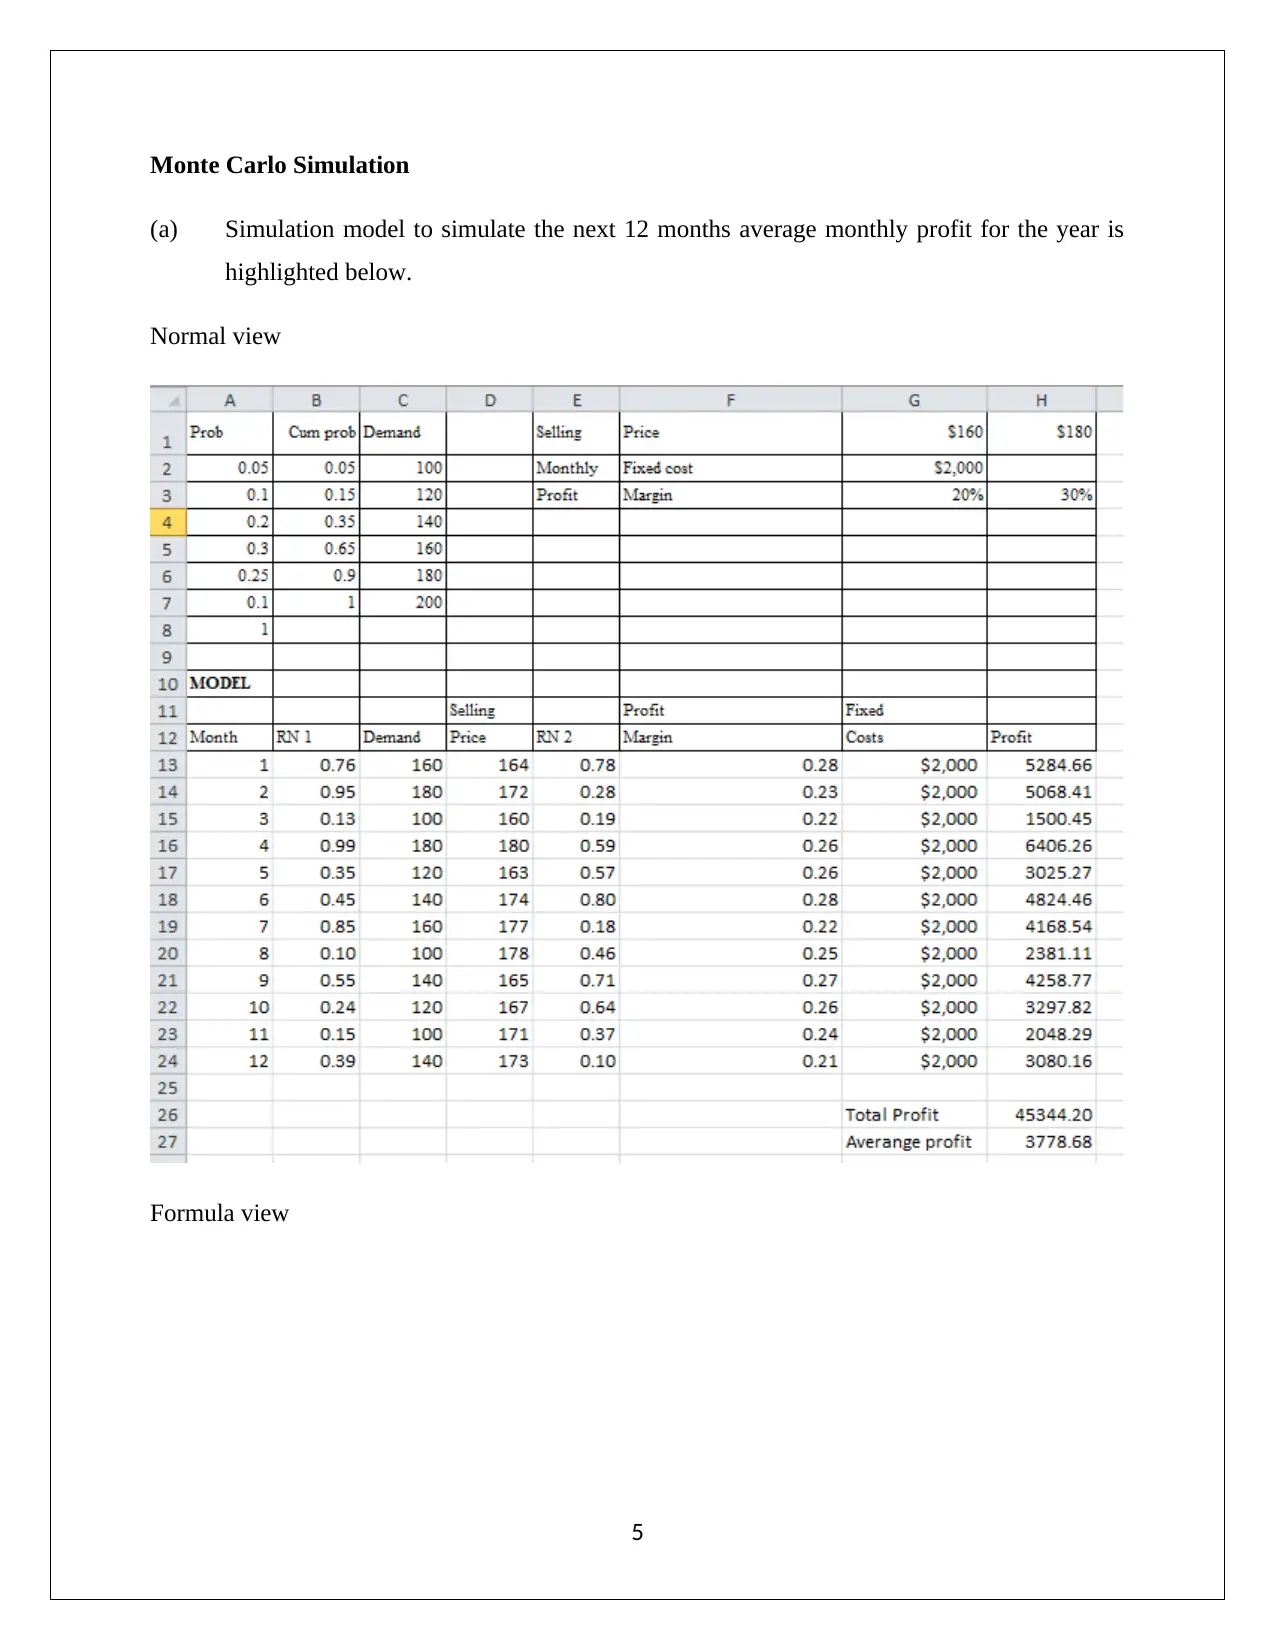
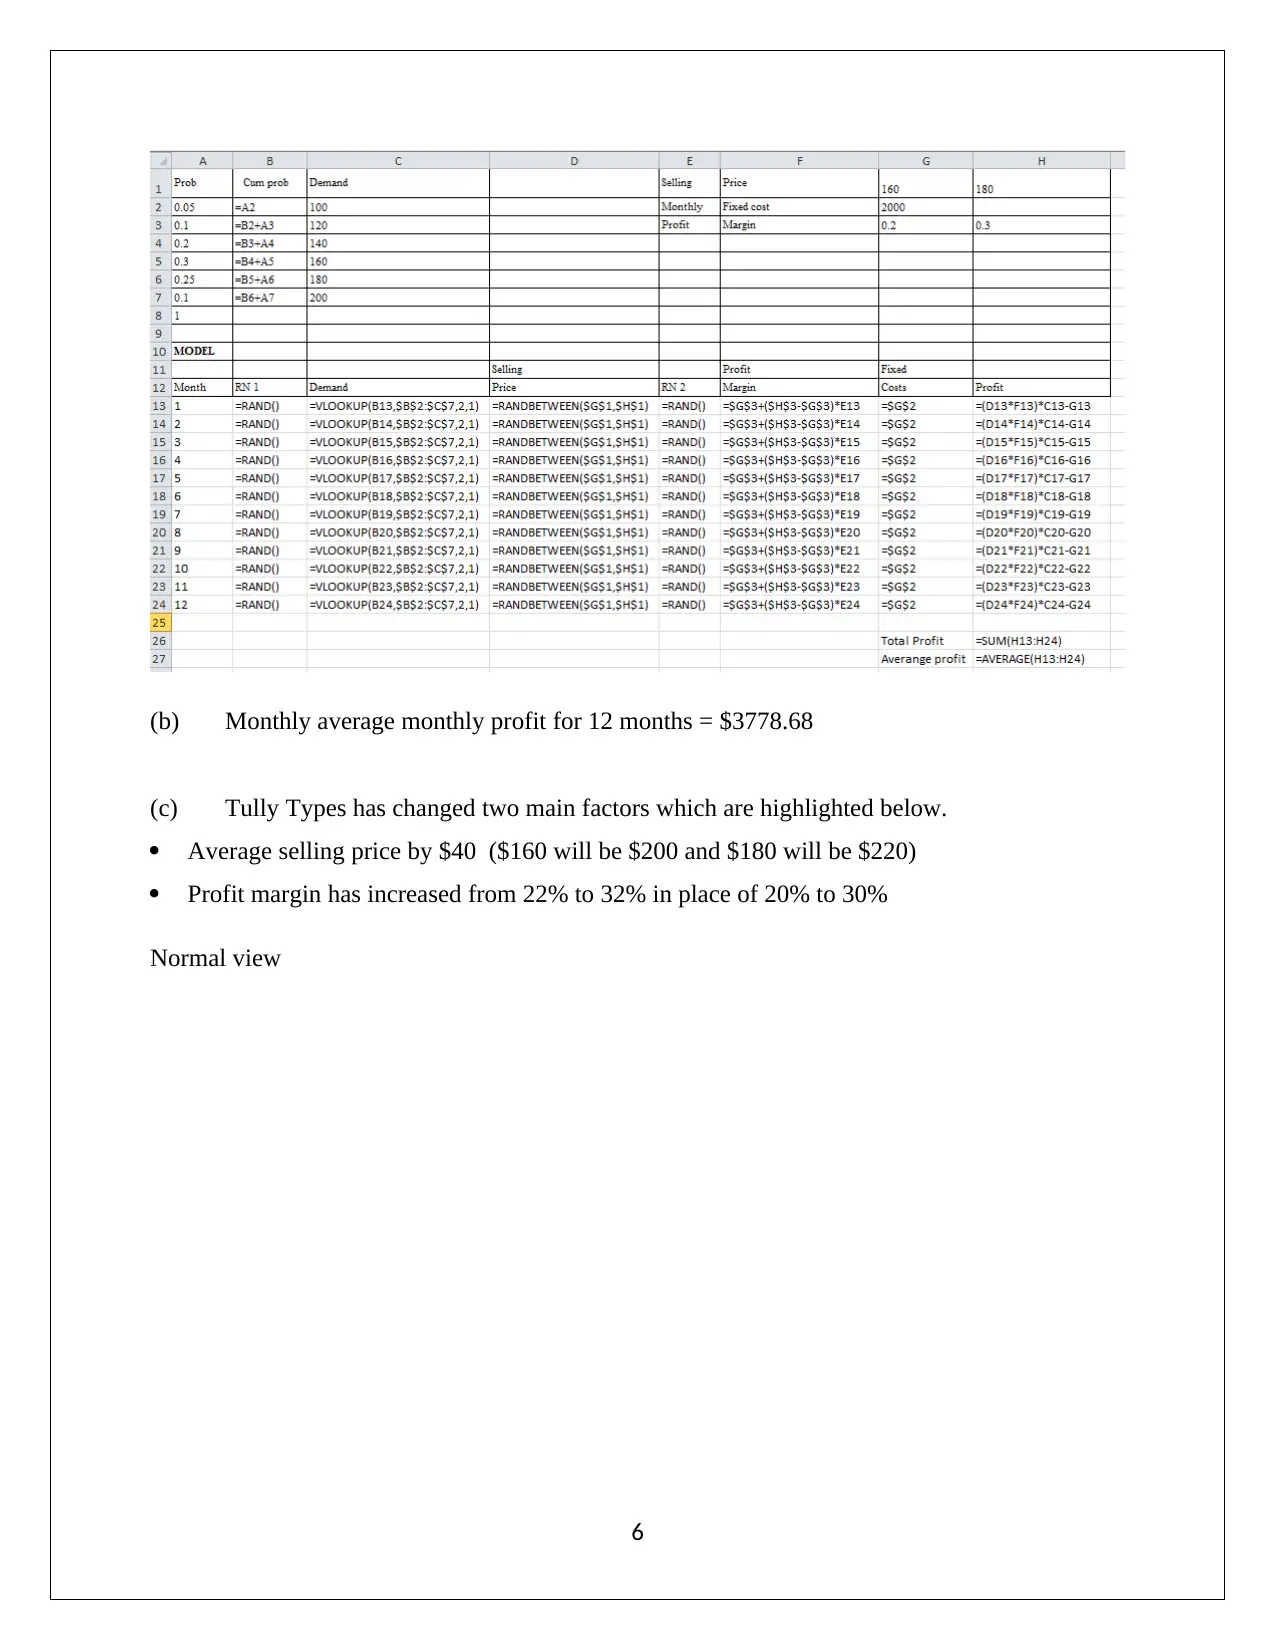
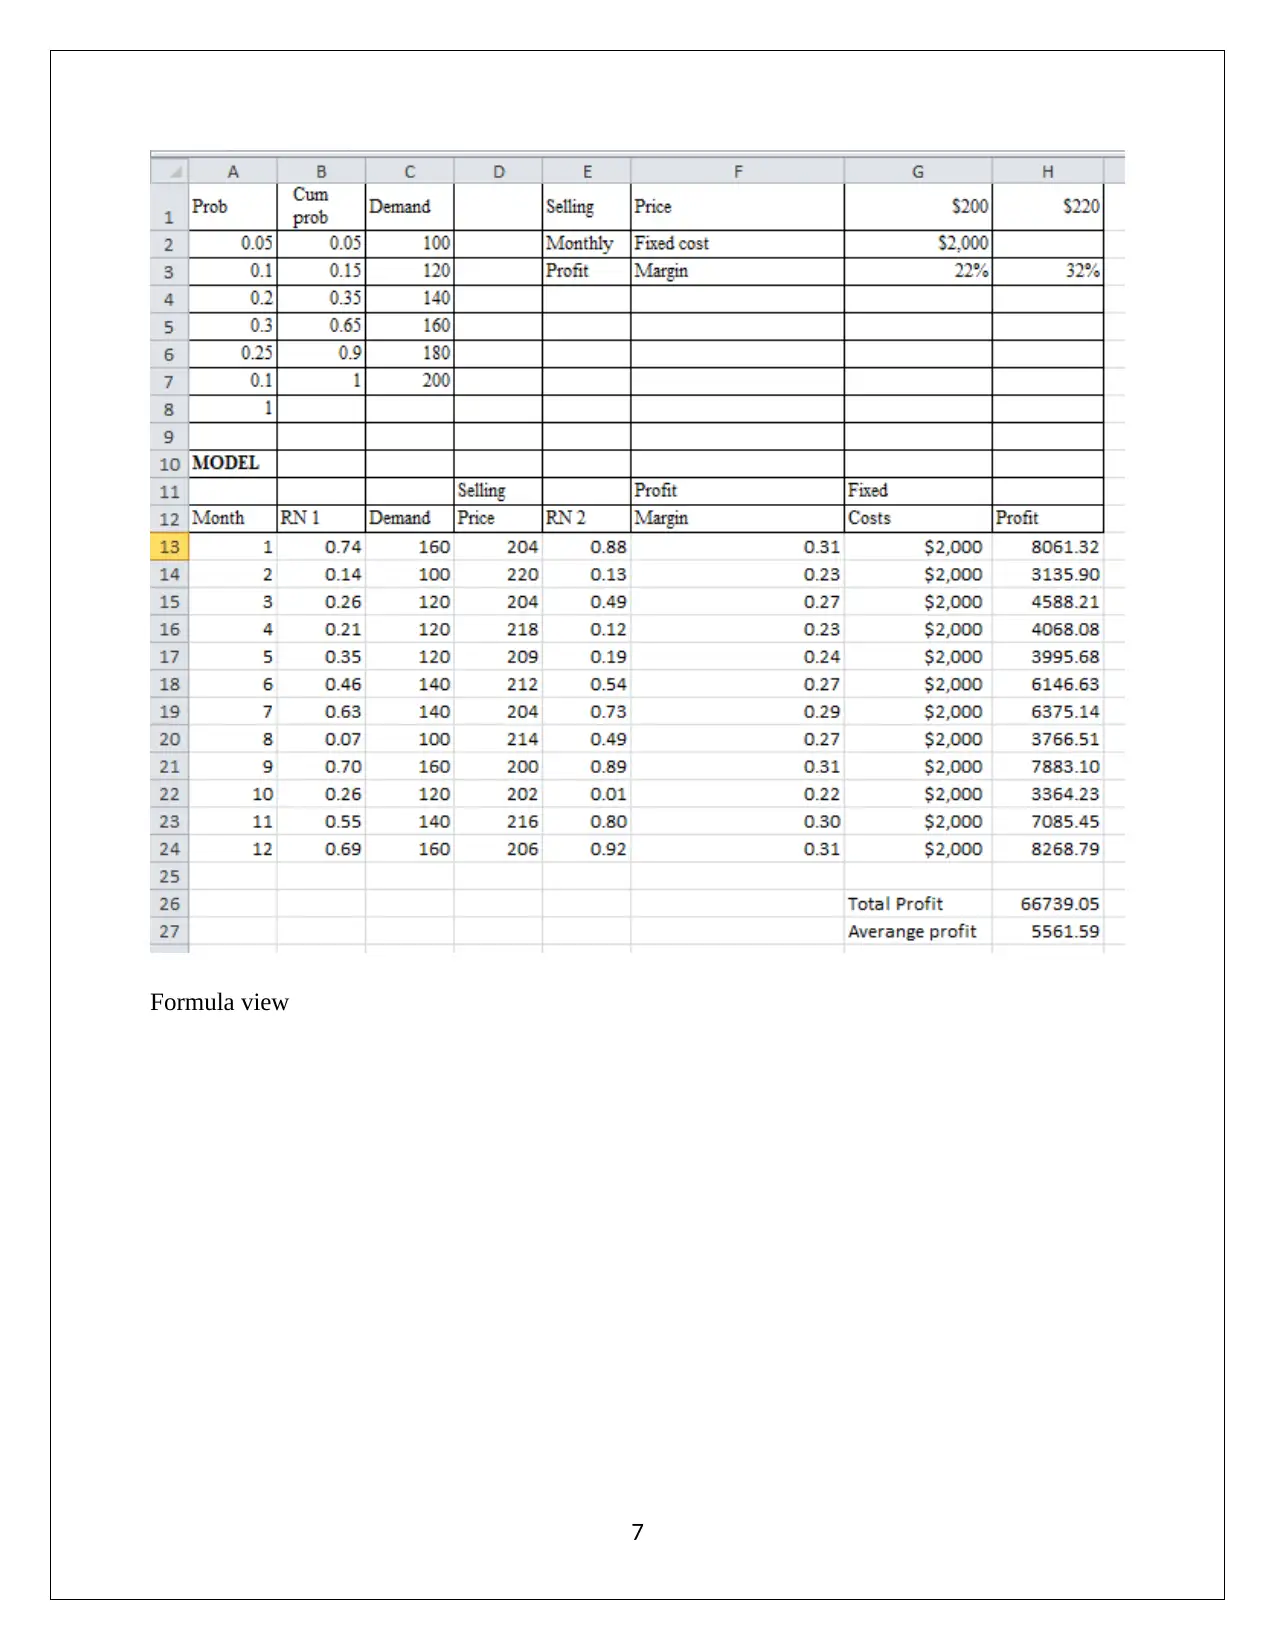
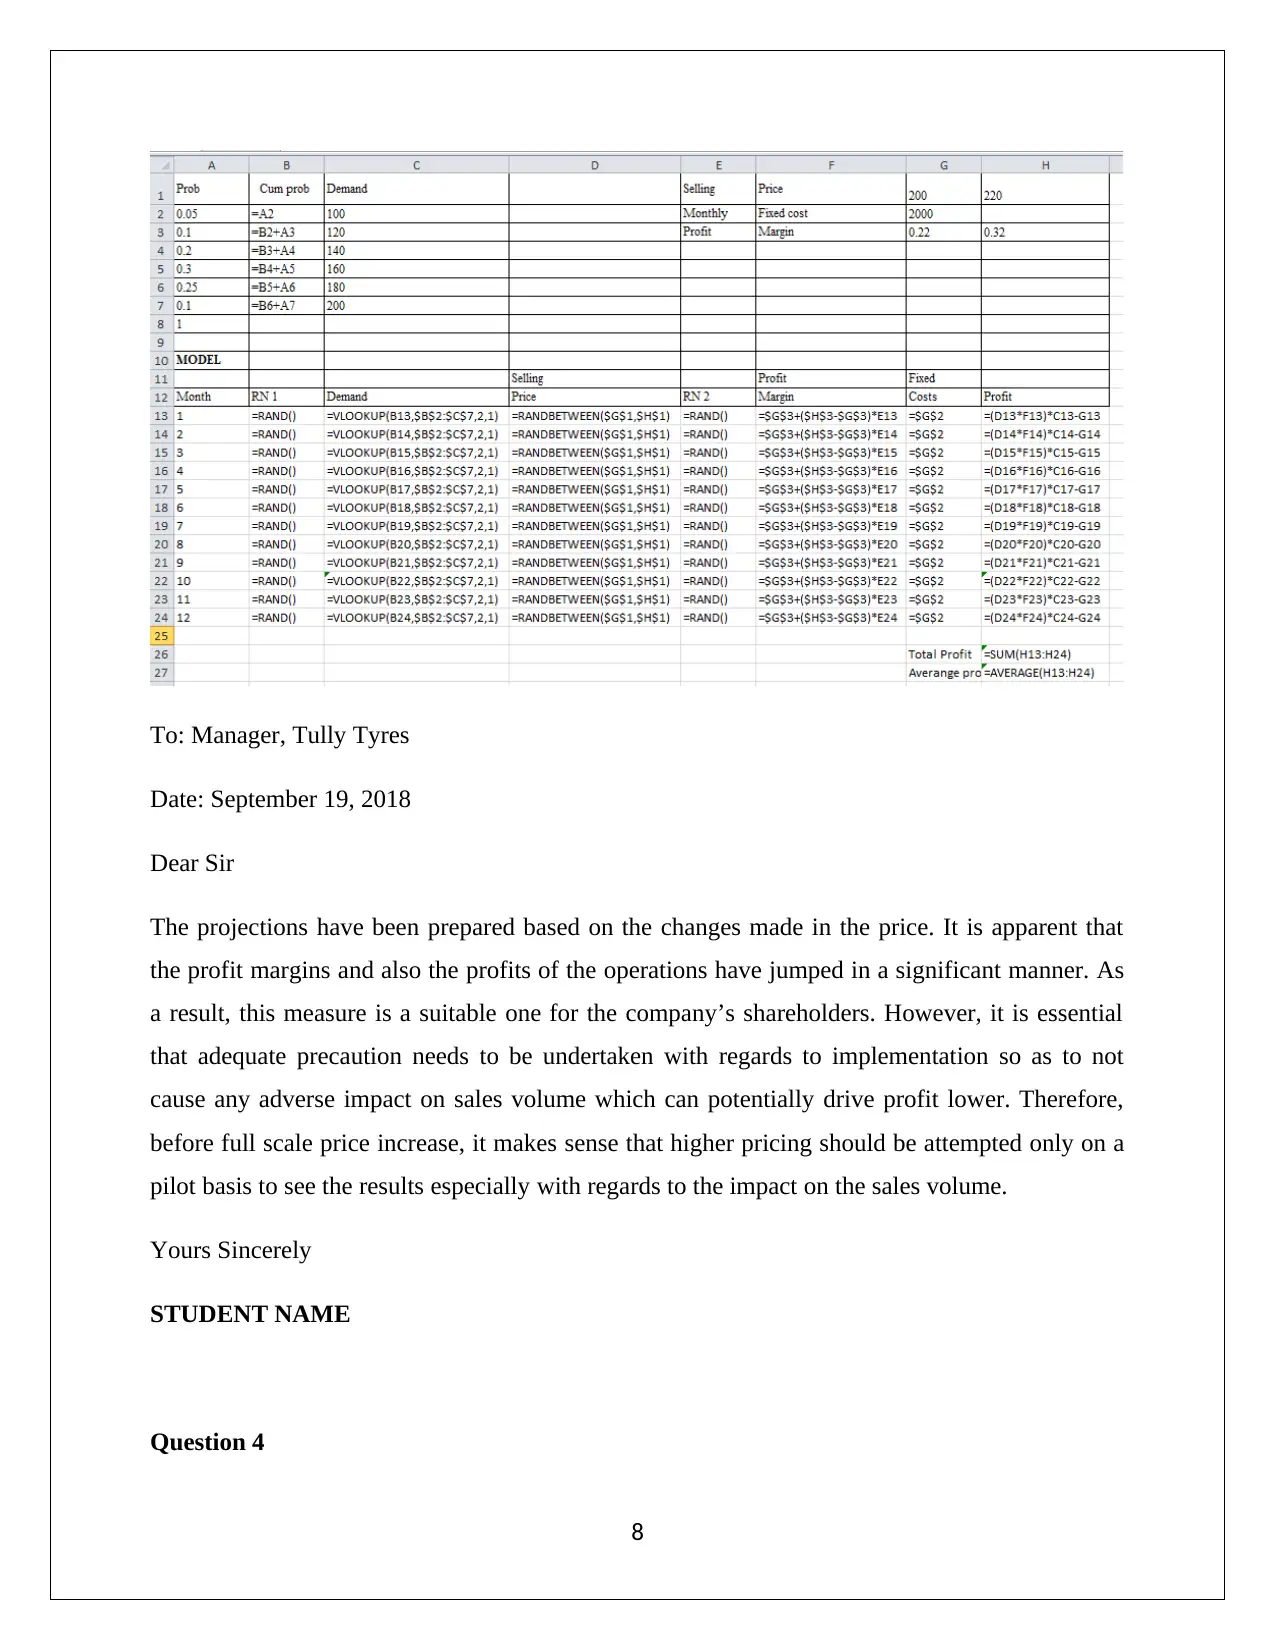
This assignment solution covers various decision support tools applied to investment analysis and simulation. It includes utility function assessment, decision matrix creation for stock and bond investments under different market conditions, and the application of MAXIMAX, MAXIMIN, regret matrix, and EMV criteria. The solution also addresses expected monetary value calculations for new product launches, probability revisions using Bayesian analysis, and the utility of acquiring additional information. Furthermore, it demonstrates Monte Carlo simulation for profit forecasting, break-even analysis, and cost estimation using the high-low method and regression models, providing a comprehensive overview of financial decision-making techniques. This document is available on Desklib, a platform offering a wide range of study tools and solved assignments for students.

DECISION SUPPORT TOOLS
Student Name
[Pick the date]
Student Name
[Pick the date]
Paraphrase This Document
Need a fresh take? Get an instant paraphrase of this document with our AI Paraphraser

Question 1
a) Utility function tends to highlight the viewpoint of an individual investor towards value of
money and risk. The utility function is dynamic and tends to change with time. Also, it differs
from individual to individual. Besides, the magnitude of money also impacts the utility function.
Standard gamble is used often in the healthcare industry for assessment of utility values related
to a particular disease and death. With regards to gambling, considering the uncertain outcome,
hence it would be required for gamblers that atleast certainty equivalent should be ensured which
is the minimum risk free returns. Based on this, the utility values are computed (Flick, 2015).
b) 1) It is apparent that decision needs to be taken with regards to investment in share or bond
considering three states of nature i.e. good, fair and bad. The stock returns would change
according to the state while the bonds return would remain constant.
Returns in stock market in good state = 14% *10000 = $ 1,400
Returns in stock market in fair state = 8% *10000 = $ 800
Returns in stock market in poor state = 0% *10000 = $ 0
Returns for bonds in each of the three states = 9% of 10000 = $ 900
Hence, the relevant decision matrix is shown below.
2) An optimist would choose the investment which would provide maximum payoff
(MAXIMAX strategy) which is stocks considering the possibility of earning $ 1,400 as the
payoff or returns.
3) Minimum payoff for stocks = $ 0
Minimum payoff for bonds = $ 900
Hence, a pessimist as per MAXIMIN strategy would choose to invest in bonds.
1

4) The regret matrix is shown below.
Maximum is in case of stocks and hence investment in stock would be recommended.
5) EMV (Stocks) = 0.4*1400 + 0.4*800 +0.2*0 = $ 880
EMV (bonds) = $900
Hence, as per the EMV criterion, bonds would be preferred.
6) The following formula may be used.
EVPI= ∑
i=1
S
{max U ( si , a)} p(si)−E ¿ ¿ ¿U/ a*)
EVPI = (0.4*1400 + 0.4*900 + 0.2*900) – 900 = $ 200
Question 2
a) The EMV or Expected Monetary Value of producing a new electric razor is highlighted
below.
EMV (Electric Razor) = 100000*0.5 + (-60000)*0.5 = $ 20,000
Since, EMV is positive, hence Jerry should produce the new type of electric razor.
b) The revision in the prior probability is shown below.
2
⊘ This is a preview!⊘
Do you want full access?
Subscribe today to unlock all pages.

Trusted by 1+ million students worldwide

Favourable study related probability revision is shown below.
Unfavourable study related probability revision is shown below.
c) The estimation of posterior probability is shown below.
3
Unfavourable study related probability revision is shown below.
c) The estimation of posterior probability is shown below.
3
Paraphrase This Document
Need a fresh take? Get an instant paraphrase of this document with our AI Paraphraser

d) The utility of the researcher may be indicated using the following computations.
From the above computations, it is apparent the estimated value of perfect information would
exceed $ 5,000 and hence information from the friend must be taken.
Question 3
4
From the above computations, it is apparent the estimated value of perfect information would
exceed $ 5,000 and hence information from the friend must be taken.
Question 3
4

Monte Carlo Simulation
(a) Simulation model to simulate the next 12 months average monthly profit for the year is
highlighted below.
Normal view
Formula view
5
(a) Simulation model to simulate the next 12 months average monthly profit for the year is
highlighted below.
Normal view
Formula view
5
⊘ This is a preview!⊘
Do you want full access?
Subscribe today to unlock all pages.

Trusted by 1+ million students worldwide

(b) Monthly average monthly profit for 12 months = $3778.68
(c) Tully Types has changed two main factors which are highlighted below.
Average selling price by $40 ($160 will be $200 and $180 will be $220)
Profit margin has increased from 22% to 32% in place of 20% to 30%
Normal view
6
(c) Tully Types has changed two main factors which are highlighted below.
Average selling price by $40 ($160 will be $200 and $180 will be $220)
Profit margin has increased from 22% to 32% in place of 20% to 30%
Normal view
6
Paraphrase This Document
Need a fresh take? Get an instant paraphrase of this document with our AI Paraphraser

Formula view
7
7

To: Manager, Tully Tyres
Date: September 19, 2018
Dear Sir
The projections have been prepared based on the changes made in the price. It is apparent that
the profit margins and also the profits of the operations have jumped in a significant manner. As
a result, this measure is a suitable one for the company’s shareholders. However, it is essential
that adequate precaution needs to be undertaken with regards to implementation so as to not
cause any adverse impact on sales volume which can potentially drive profit lower. Therefore,
before full scale price increase, it makes sense that higher pricing should be attempted only on a
pilot basis to see the results especially with regards to the impact on the sales volume.
Yours Sincerely
STUDENT NAME
Question 4
8
⊘ This is a preview!⊘
Do you want full access?
Subscribe today to unlock all pages.

Trusted by 1+ million students worldwide

Deborah collected data shown below.
(a) High- low method
Variable cost per unit = 48000−46000
3800−1800 =$ 1.00
¿ cost=48000− (3800∗1 )=$ 44,200
Total machine hours=3000 hrs
Total
head cost=FC +(Variable cost per unit∗Total machine hours )
Total
head cost=44200+ ( 1∗3000 ) =$ 47,200
9
(a) High- low method
Variable cost per unit = 48000−46000
3800−1800 =$ 1.00
¿ cost=48000− (3800∗1 )=$ 44,200
Total machine hours=3000 hrs
Total
head cost=FC +(Variable cost per unit∗Total machine hours )
Total
head cost=44200+ ( 1∗3000 ) =$ 47,200
9
Paraphrase This Document
Need a fresh take? Get an instant paraphrase of this document with our AI Paraphraser

(b) Regression model (Overhead cost and machine hours)
Regression equation
¿ head cost=59198.78−(2.30 × Machine hours )
R2=0.0109( Low)
Let the significance level = 5%
The p value for slope coefficient (MH) comes out to be 0.77 which is higher than the level of
significance. Hence, it can be said that slope is not significant. Also, the conclusion can be drawn
based on the ANOVA table that significance F is also higher than level of significance and thus,
the regression model is not good fit (Hair et. al., 2015).
Regression model (Overhead cost and batches)
10

Regression equation
¿ head cost=6555.56−(234.57∗Batches)
R2=0.8313( High)
Adjusted R2=0.8102( High)
Let the significance level = 5%
The value for slope coefficient (batches) comes out to be 0.00 which is lower than the level of
significance. Hence, it can be said that slope is significant. Also, the conclusion can be drawn
based on the ANOVA table that significance F is also lower than level of significance and thus,
the regression model is good fit (Hillier, 2016).
Regression model (Overhead cost and batches, machine hours)
11
⊘ This is a preview!⊘
Do you want full access?
Subscribe today to unlock all pages.

Trusted by 1+ million students worldwide
1 out of 17