Investment Analysis and Decision Making in the Petroleum Industry
VerifiedAdded on 2020/06/04
|14
|3447
|37
Report
AI Summary
This report provides an investment analysis of the petroleum industry, focusing on Tullow Oil Plc and Exxon Mobil. It begins with an executive summary and literature review, highlighting the industry's importance and economic contributions. The research methodologies section examines variables like equity ratios, balance sheets, horizontal and vertical analyses, and cash flow statements to assess financial performance. The report analyzes financial ratios and investment decisions, offering insights into the companies' capital structures, investment strategies, and market positions. The analysis includes financial data from 2014 to 2017, comparing key metrics to evaluate financial health and make informed recommendations. The conclusion summarizes the findings and overall investment landscape within the petroleum industry.
INVESTMENT ANALYSIS AND
DECISION MAKING IN THE
PETROLEUM INDUSTRY
DECISION MAKING IN THE
PETROLEUM INDUSTRY
Paraphrase This Document
Need a fresh take? Get an instant paraphrase of this document with our AI Paraphraser
Table of Contents
EXECUTIVE SUMMARY.............................................................................................................1
LITERATURE REVIEW................................................................................................................1
RESEARCH METHODOLOGIES.................................................................................................2
2.1Variables and their measurement...........................................................................................2
2.1.1 Measure of these variable...................................................................................................2
RATIO.............................................................................................................................................6
Financial ratios of those two companies.....................................................................................6
RECOMMENDATION...................................................................................................................7
Interpretation of Tullow Oil Plc..................................................................................................7
Interpretation of Exxon Mobil....................................................................................................8
CONCLUSION................................................................................................................................9
REFERENCES..............................................................................................................................10

⊘ This is a preview!⊘
Do you want full access?
Subscribe today to unlock all pages.
Trusted by 1+ million students worldwide
EXECUTIVE SUMMARY
Investment analysis and decision making in the petroleum industry defined in this report.
Evaluation of market and capital structure is analysed between same segment organisations.
United Kingdom is manufacturing only 1.1 percent international oil supply in the world. This
sector has highly profitability in nature and it is a key economic contributor in UK as well as in
any country.
Paraphrase This Document
Need a fresh take? Get an instant paraphrase of this document with our AI Paraphraser
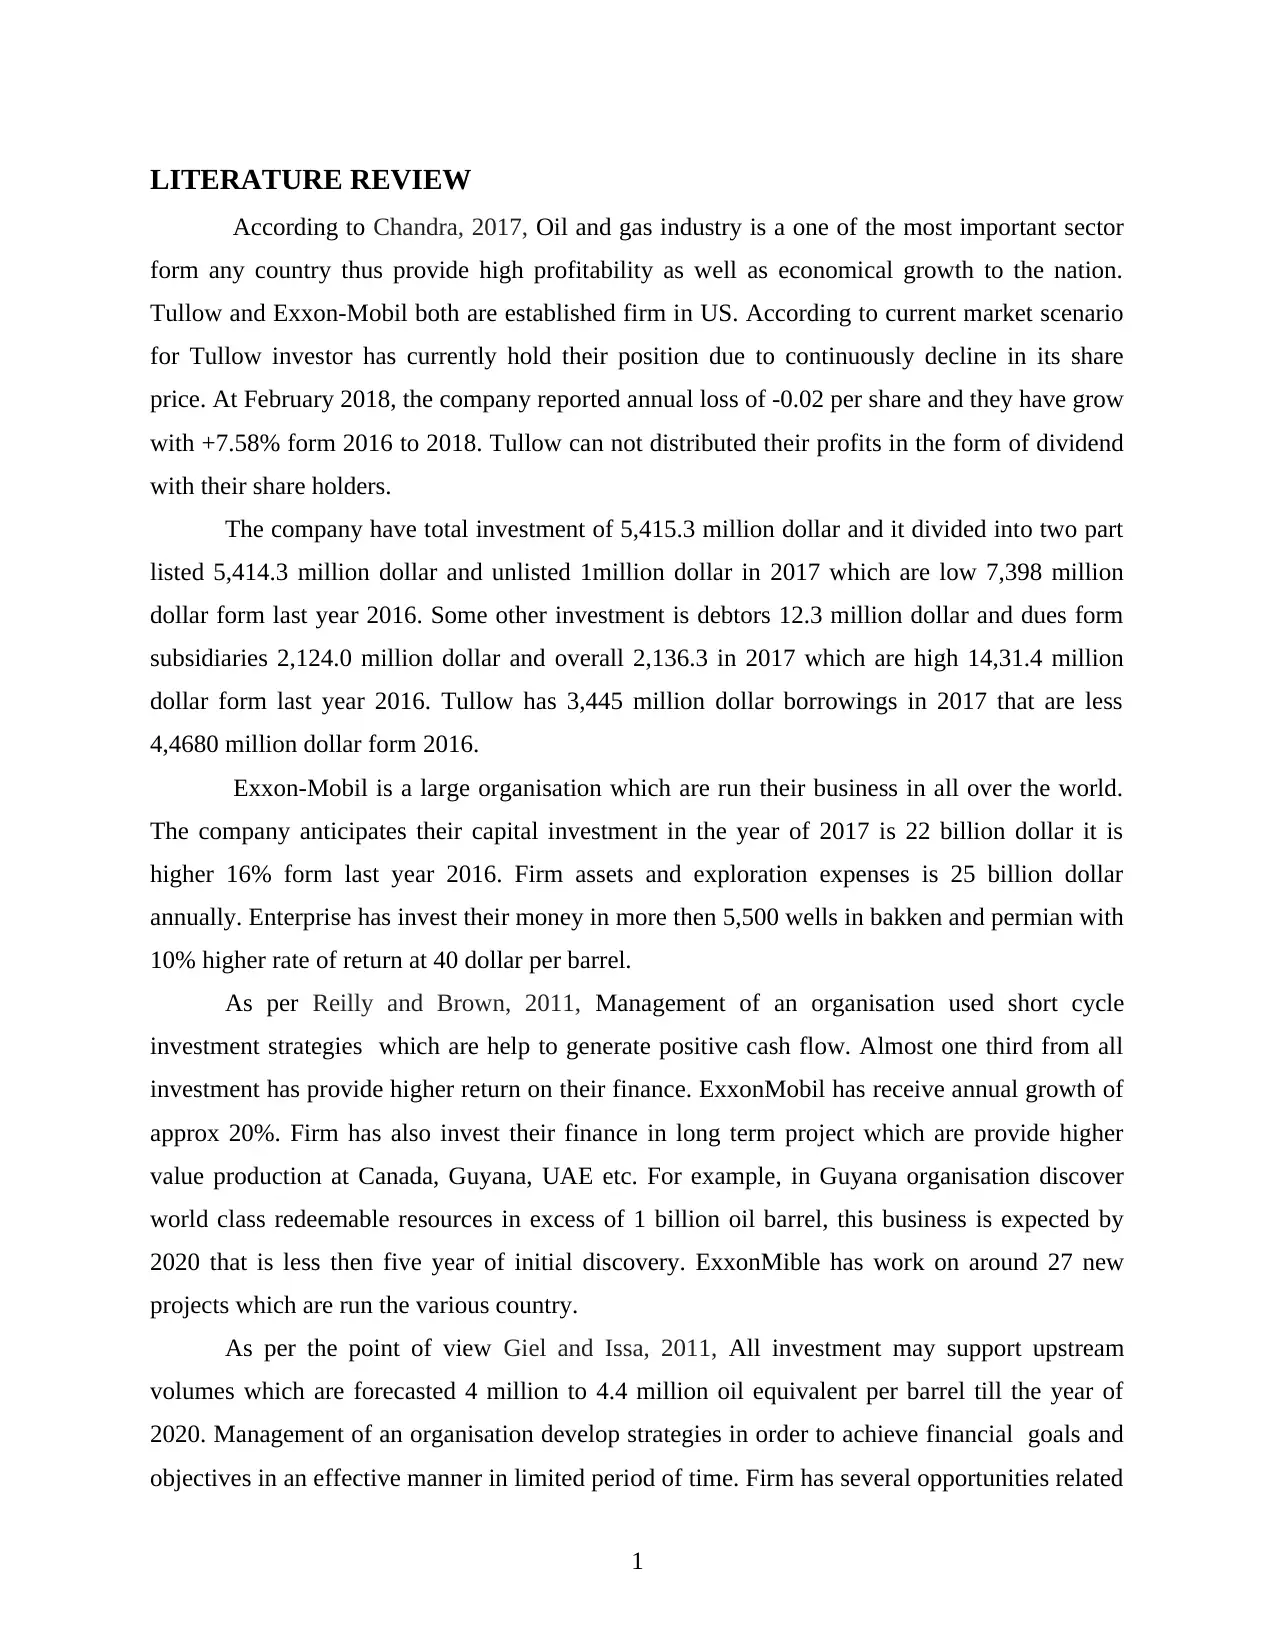
LITERATURE REVIEW
According to Chandra, 2017, Oil and gas industry is a one of the most important sector
form any country thus provide high profitability as well as economical growth to the nation.
Tullow and Exxon-Mobil both are established firm in US. According to current market scenario
for Tullow investor has currently hold their position due to continuously decline in its share
price. At February 2018, the company reported annual loss of -0.02 per share and they have grow
with +7.58% form 2016 to 2018. Tullow can not distributed their profits in the form of dividend
with their share holders.
The company have total investment of 5,415.3 million dollar and it divided into two part
listed 5,414.3 million dollar and unlisted 1million dollar in 2017 which are low 7,398 million
dollar form last year 2016. Some other investment is debtors 12.3 million dollar and dues form
subsidiaries 2,124.0 million dollar and overall 2,136.3 in 2017 which are high 14,31.4 million
dollar form last year 2016. Tullow has 3,445 million dollar borrowings in 2017 that are less
4,4680 million dollar form 2016.
Exxon-Mobil is a large organisation which are run their business in all over the world.
The company anticipates their capital investment in the year of 2017 is 22 billion dollar it is
higher 16% form last year 2016. Firm assets and exploration expenses is 25 billion dollar
annually. Enterprise has invest their money in more then 5,500 wells in bakken and permian with
10% higher rate of return at 40 dollar per barrel.
As per Reilly and Brown, 2011, Management of an organisation used short cycle
investment strategies which are help to generate positive cash flow. Almost one third from all
investment has provide higher return on their finance. ExxonMobil has receive annual growth of
approx 20%. Firm has also invest their finance in long term project which are provide higher
value production at Canada, Guyana, UAE etc. For example, in Guyana organisation discover
world class redeemable resources in excess of 1 billion oil barrel, this business is expected by
2020 that is less then five year of initial discovery. ExxonMible has work on around 27 new
projects which are run the various country.
As per the point of view Giel and Issa, 2011, All investment may support upstream
volumes which are forecasted 4 million to 4.4 million oil equivalent per barrel till the year of
2020. Management of an organisation develop strategies in order to achieve financial goals and
objectives in an effective manner in limited period of time. Firm has several opportunities related
1
to investment at market place and administration develop plan to analysis growth possibility in
same kind of industries in order to gain higher profitability as well as market share. Thus
provide positive impact on organisation performance and employees productivity in long period
of time. ExxonMobil share holder may start frustrated due to slow growth of the company as
compare to others at market place. Current capital market environment is a bullish in nature so
that share holder sell their share at high price at call option and purchase form low prices at put
option.
This sector help to increase employment opportunities for 302,000 person employed in
the year of 2016. On an average UK people consume 1,000 barrel oil on daily basis form 2004
to 2016. In this period consumption of oil has not fluctuated so much in 2004 intake is 1766
barrel and in 2016 is a 1597 barrel. Form 2016 consumption of lipid is contentiously reduce till
2014 and then increase. Through oil, UK has gain around £73 billion profits by global trade.
Tullow as well as Exxon-Mobil both are run their business in oil and gas industries. Exxon-
Mobil is a seventh largest traded firm by their market capitalisation and they has ninth rank in
global level.
2
⊘ This is a preview!⊘
Do you want full access?
Subscribe today to unlock all pages.
Trusted by 1+ million students worldwide
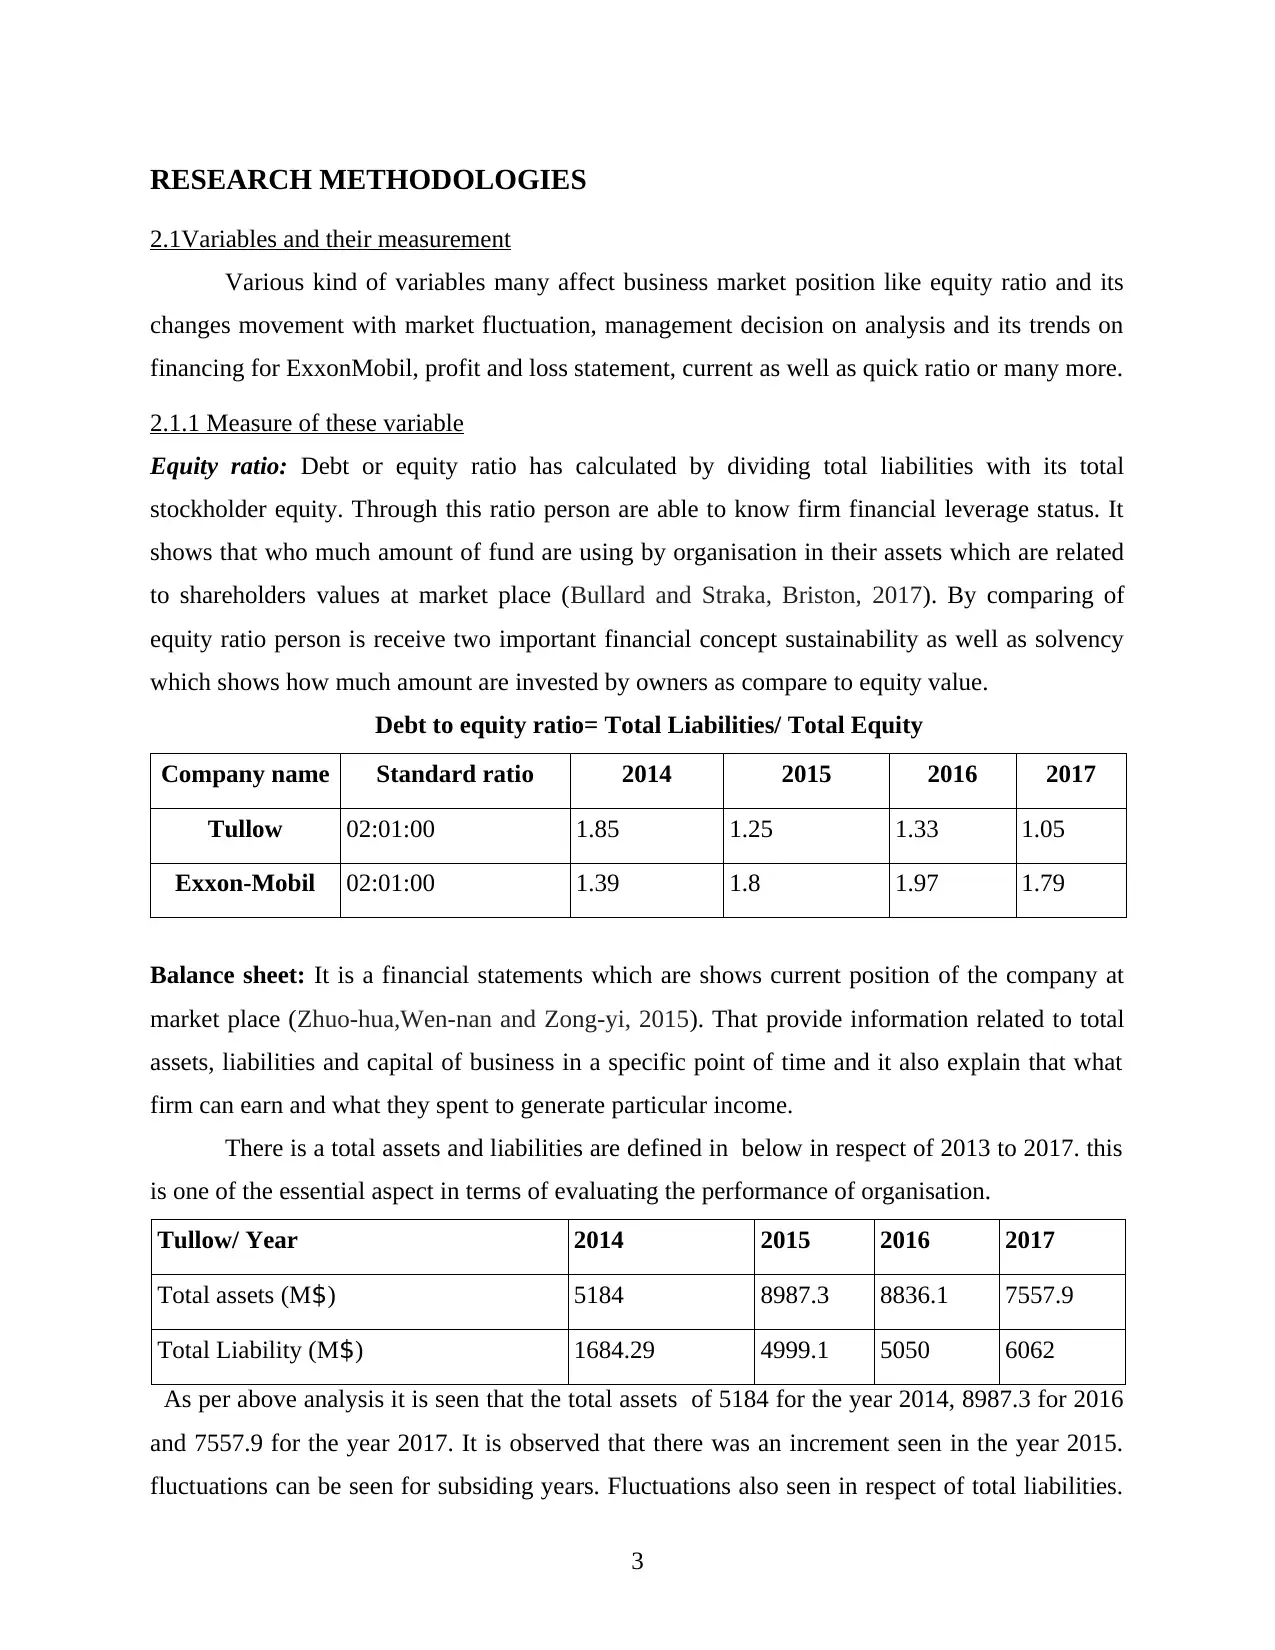
RESEARCH METHODOLOGIES
2.1Variables and their measurement
Various kind of variables many affect business market position like equity ratio and its
changes movement with market fluctuation, management decision on analysis and its trends on
financing for ExxonMobil, profit and loss statement, current as well as quick ratio or many more.
2.1.1 Measure of these variable
Equity ratio: Debt or equity ratio has calculated by dividing total liabilities with its total
stockholder equity. Through this ratio person are able to know firm financial leverage status. It
shows that who much amount of fund are using by organisation in their assets which are related
to shareholders values at market place (Bullard and Straka, Briston, 2017). By comparing of
equity ratio person is receive two important financial concept sustainability as well as solvency
which shows how much amount are invested by owners as compare to equity value.
Debt to equity ratio= Total Liabilities/ Total Equity
Company name Standard ratio 2014 2015 2016 2017
Tullow 02:01:00 1.85 1.25 1.33 1.05
Exxon-Mobil 02:01:00 1.39 1.8 1.97 1.79
Balance sheet: It is a financial statements which are shows current position of the company at
market place (Zhuo-hua,Wen-nan and Zong-yi, 2015). That provide information related to total
assets, liabilities and capital of business in a specific point of time and it also explain that what
firm can earn and what they spent to generate particular income.
There is a total assets and liabilities are defined in below in respect of 2013 to 2017. this
is one of the essential aspect in terms of evaluating the performance of organisation.
Tullow/ Year 2014 2015 2016 2017
Total assets (M$) 5184 8987.3 8836.1 7557.9
Total Liability (M$) 1684.29 4999.1 5050 6062
As per above analysis it is seen that the total assets of 5184 for the year 2014, 8987.3 for 2016
and 7557.9 for the year 2017. It is observed that there was an increment seen in the year 2015.
fluctuations can be seen for subsiding years. Fluctuations also seen in respect of total liabilities.
3
Paraphrase This Document
Need a fresh take? Get an instant paraphrase of this document with our AI Paraphraser
It is seen that the total liabilities for the year 2014, 4999.1 for the year 2015, 5050 for the year
2016 and 6062 for the year. It is seen that there is huge difference was seen in respect of
liabilities. Total liabilities get decreased by 4378 in 2014. this is one of the essential aspect in
terms of increment aspect in liabilities.
ExxonMobil/ Year 2014 2015 2016 2017
Total assets (M$) 349493 336758 330314 348691
Total Liability (M$) 168429 159948 156484 154191
There is an analysis also done, which indicates towards following information such as
168429 for the year 2014, 159948 for the year 2015, 156484 for the year ended 2016 and 154191
for 2017. there is no any big difference between total liabilities.
Horizontal analysis
There is a table presented above, which defined the total assets and the total liabilities
from 2014 to 2017. as per analysis of total assets it is seen that the value total assets were
recorded as 346808 for the year 2013, 349493 for the year 2014, 336758 for the year 2015,
330314 for the year 2016 and 3478691 for the year 2017. it is seen that the organisation's total
assets did not fluctuate for with in last five years.
Vertical analysis
There is an analysis also done, which indicates towards following information such as
168429 for the year 2014, 159948 for the year 2015, 156484 for the year ended 2016 and 154191
for 2017. there is no any big difference between total liabilities.
Cash flow statement
It is a statements if cash inflow and outflow for the company. Thus shows change in
financial accounting as well as income which affect cash as well as cash equivalents (Bierman
and Smidt, 2012). Thus are explain what amount of fund are used by which department like
operations, research and development, investment activities and many more.
Tullow/ year 2014 2015 2016 2017
Cash use in operation 1482 1351 513 1223
Cash use in financial activities 808 746 399 -928
4
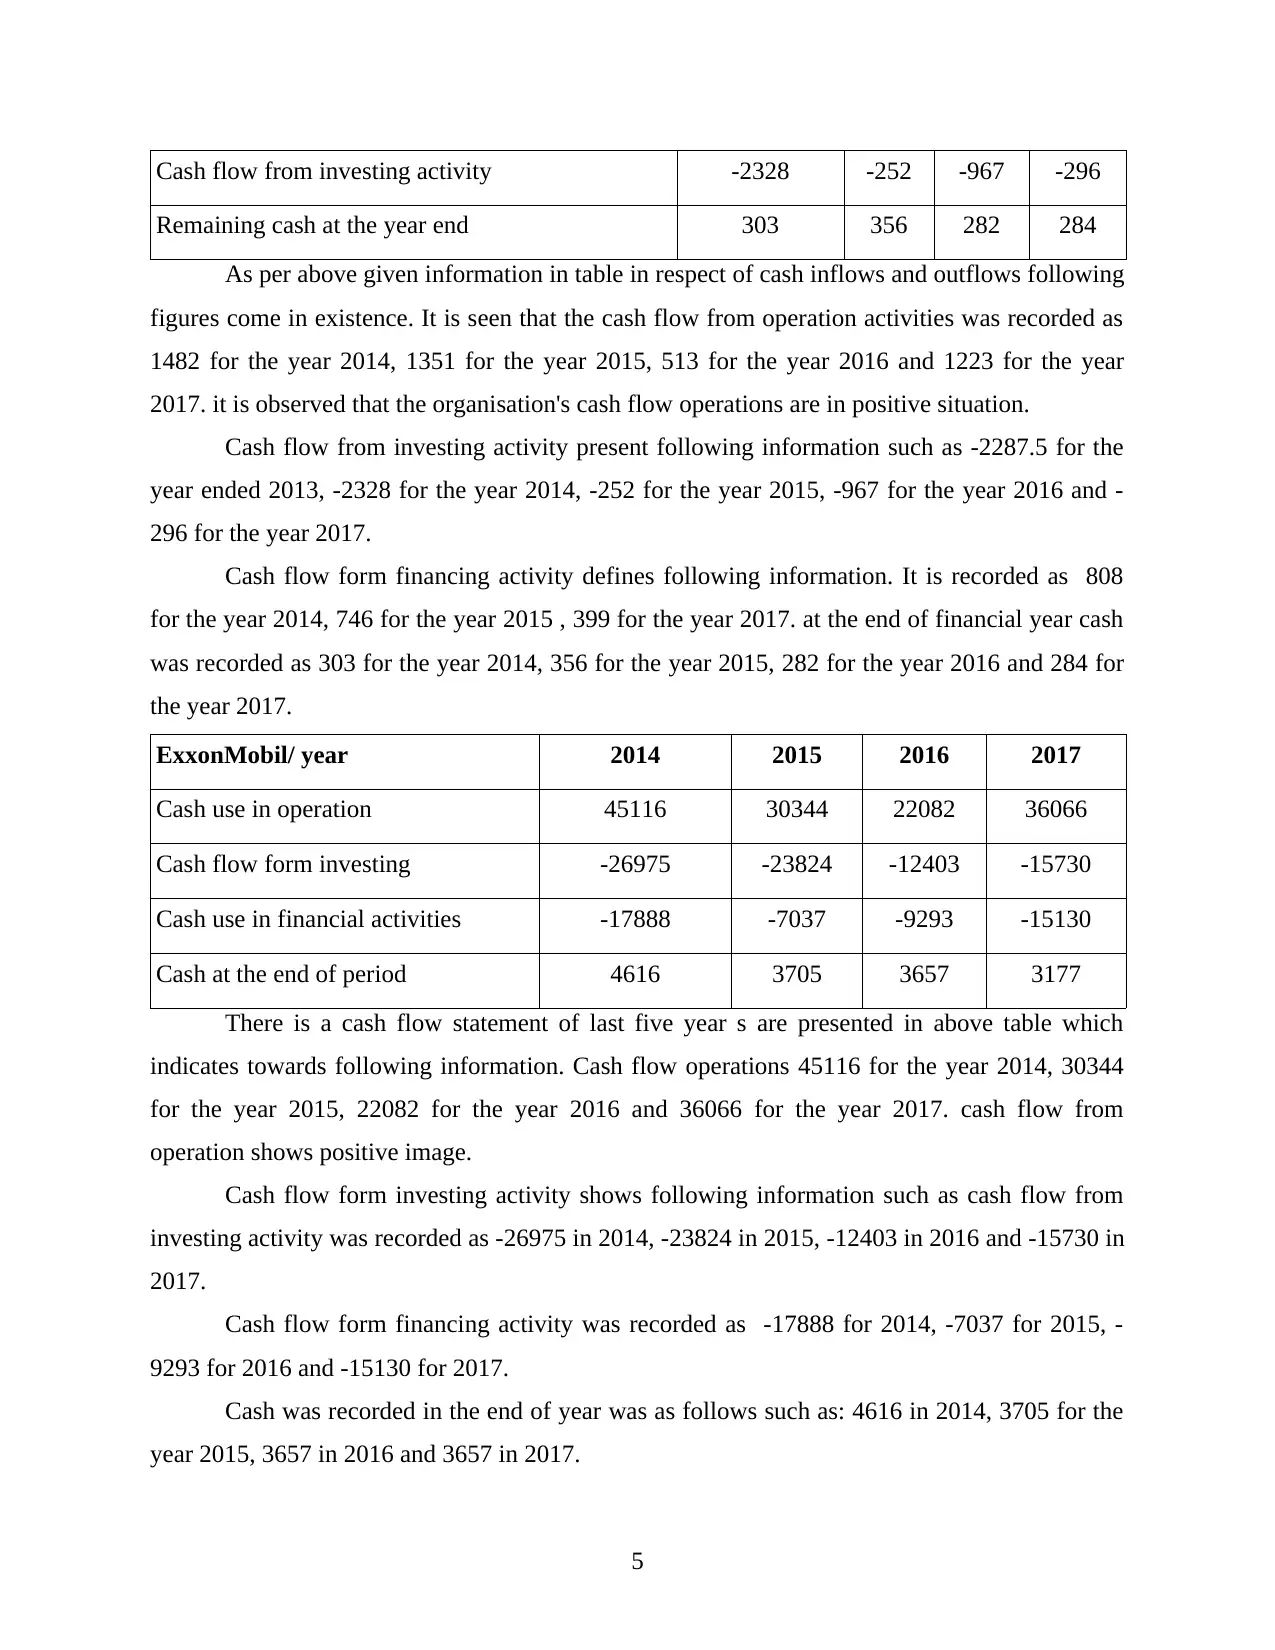
Cash flow from investing activity -2328 -252 -967 -296
Remaining cash at the year end 303 356 282 284
As per above given information in table in respect of cash inflows and outflows following
figures come in existence. It is seen that the cash flow from operation activities was recorded as
1482 for the year 2014, 1351 for the year 2015, 513 for the year 2016 and 1223 for the year
2017. it is observed that the organisation's cash flow operations are in positive situation.
Cash flow from investing activity present following information such as -2287.5 for the
year ended 2013, -2328 for the year 2014, -252 for the year 2015, -967 for the year 2016 and -
296 for the year 2017.
Cash flow form financing activity defines following information. It is recorded as 808
for the year 2014, 746 for the year 2015 , 399 for the year 2017. at the end of financial year cash
was recorded as 303 for the year 2014, 356 for the year 2015, 282 for the year 2016 and 284 for
the year 2017.
ExxonMobil/ year 2014 2015 2016 2017
Cash use in operation 45116 30344 22082 36066
Cash flow form investing -26975 -23824 -12403 -15730
Cash use in financial activities -17888 -7037 -9293 -15130
Cash at the end of period 4616 3705 3657 3177
There is a cash flow statement of last five year s are presented in above table which
indicates towards following information. Cash flow operations 45116 for the year 2014, 30344
for the year 2015, 22082 for the year 2016 and 36066 for the year 2017. cash flow from
operation shows positive image.
Cash flow form investing activity shows following information such as cash flow from
investing activity was recorded as -26975 in 2014, -23824 in 2015, -12403 in 2016 and -15730 in
2017.
Cash flow form financing activity was recorded as -17888 for 2014, -7037 for 2015, -
9293 for 2016 and -15130 for 2017.
Cash was recorded in the end of year was as follows such as: 4616 in 2014, 3705 for the
year 2015, 3657 in 2016 and 3657 in 2017.
5
⊘ This is a preview!⊘
Do you want full access?
Subscribe today to unlock all pages.
Trusted by 1+ million students worldwide
Equity change movement
Change in equity of Tullow Oil PLC TLW
Stockholders' Equity 2014 2015 2016 2017
Common Stock 147000 147200 147500 208200
Retained Earnings 2305800 1336400 778000 607500
Treasury Stock 936800 1061500 685300 563500
Capital Surplus 606400 609800 619300 1326800
Other Stockholder Equity 936800 1061500 685300 563500
Total Stockholder Equity 3996000 3154900 2230100 2706000
As per analysis of change in equity of Tullow oil Plc there are following results come
across such as total stockholder's equity was recorded as 3996000 for the year 2014, 3154900 for
the year 2015, 2230100 for the year 2016 and 2706000 for the year 2017.
Change in equity of Exxon Mobil Corp
Stockholders' Equity 2014 2015 2016 2017
Common Stock 147000 147200 147500 208200
Retained Earnings 2305800 1336400 778000 607500
Treasury Stock 936800 1061500 685300 563500
Capital Surplus 606400 609800 619300 1326800
Other Stockholder Equity 936800 1061500 685300 563500
Total Stockholder Equity 3996000 3154900 2230100 2706000
Management decision on analysis:
In case of both the company's financial position, it has been analyse that Exxon mobil is
more comfortable position as compare to Tullow Oil plc. The overall results are more favourable
or better in terms of liquidity, profitability and efficiency ratio. The investors need to make
investments in Exxon Mobil to get more valuable amount of return in coming time.
Trend analysis on corporate & financing for Exxon,
6
Paraphrase This Document
Need a fresh take? Get an instant paraphrase of this document with our AI Paraphraser
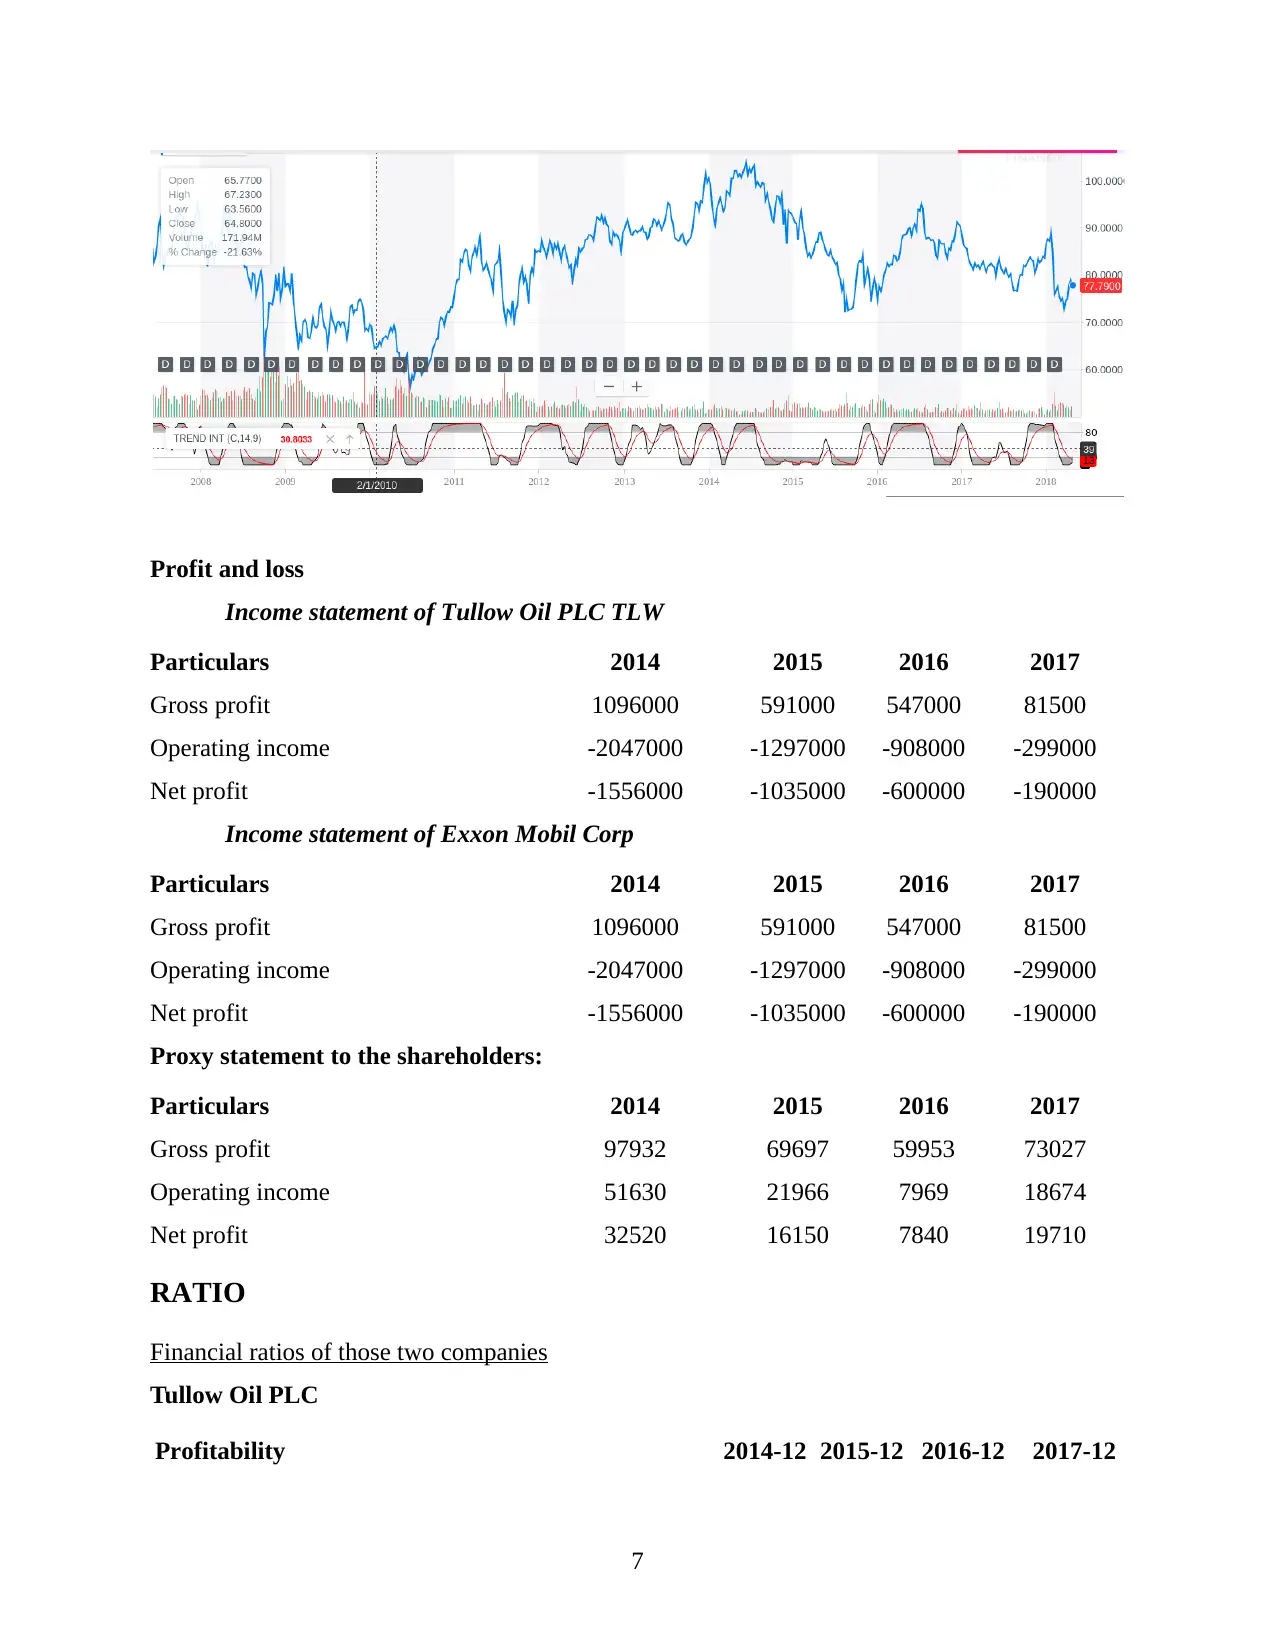
Profit and loss
Income statement of Tullow Oil PLC TLW
Particulars 2014 2015 2016 2017
Gross profit 1096000 591000 547000 81500
Operating income -2047000 -1297000 -908000 -299000
Net profit -1556000 -1035000 -600000 -190000
Income statement of Exxon Mobil Corp
Particulars 2014 2015 2016 2017
Gross profit 1096000 591000 547000 81500
Operating income -2047000 -1297000 -908000 -299000
Net profit -1556000 -1035000 -600000 -190000
Proxy statement to the shareholders:
Particulars 2014 2015 2016 2017
Gross profit 97932 69697 59953 73027
Operating income 51630 21966 7969 18674
Net profit 32520 16150 7840 19710
RATIO
Financial ratios of those two companies
Tullow Oil PLC
Profitability 2014-12 2015-12 2016-12 2017-12
7
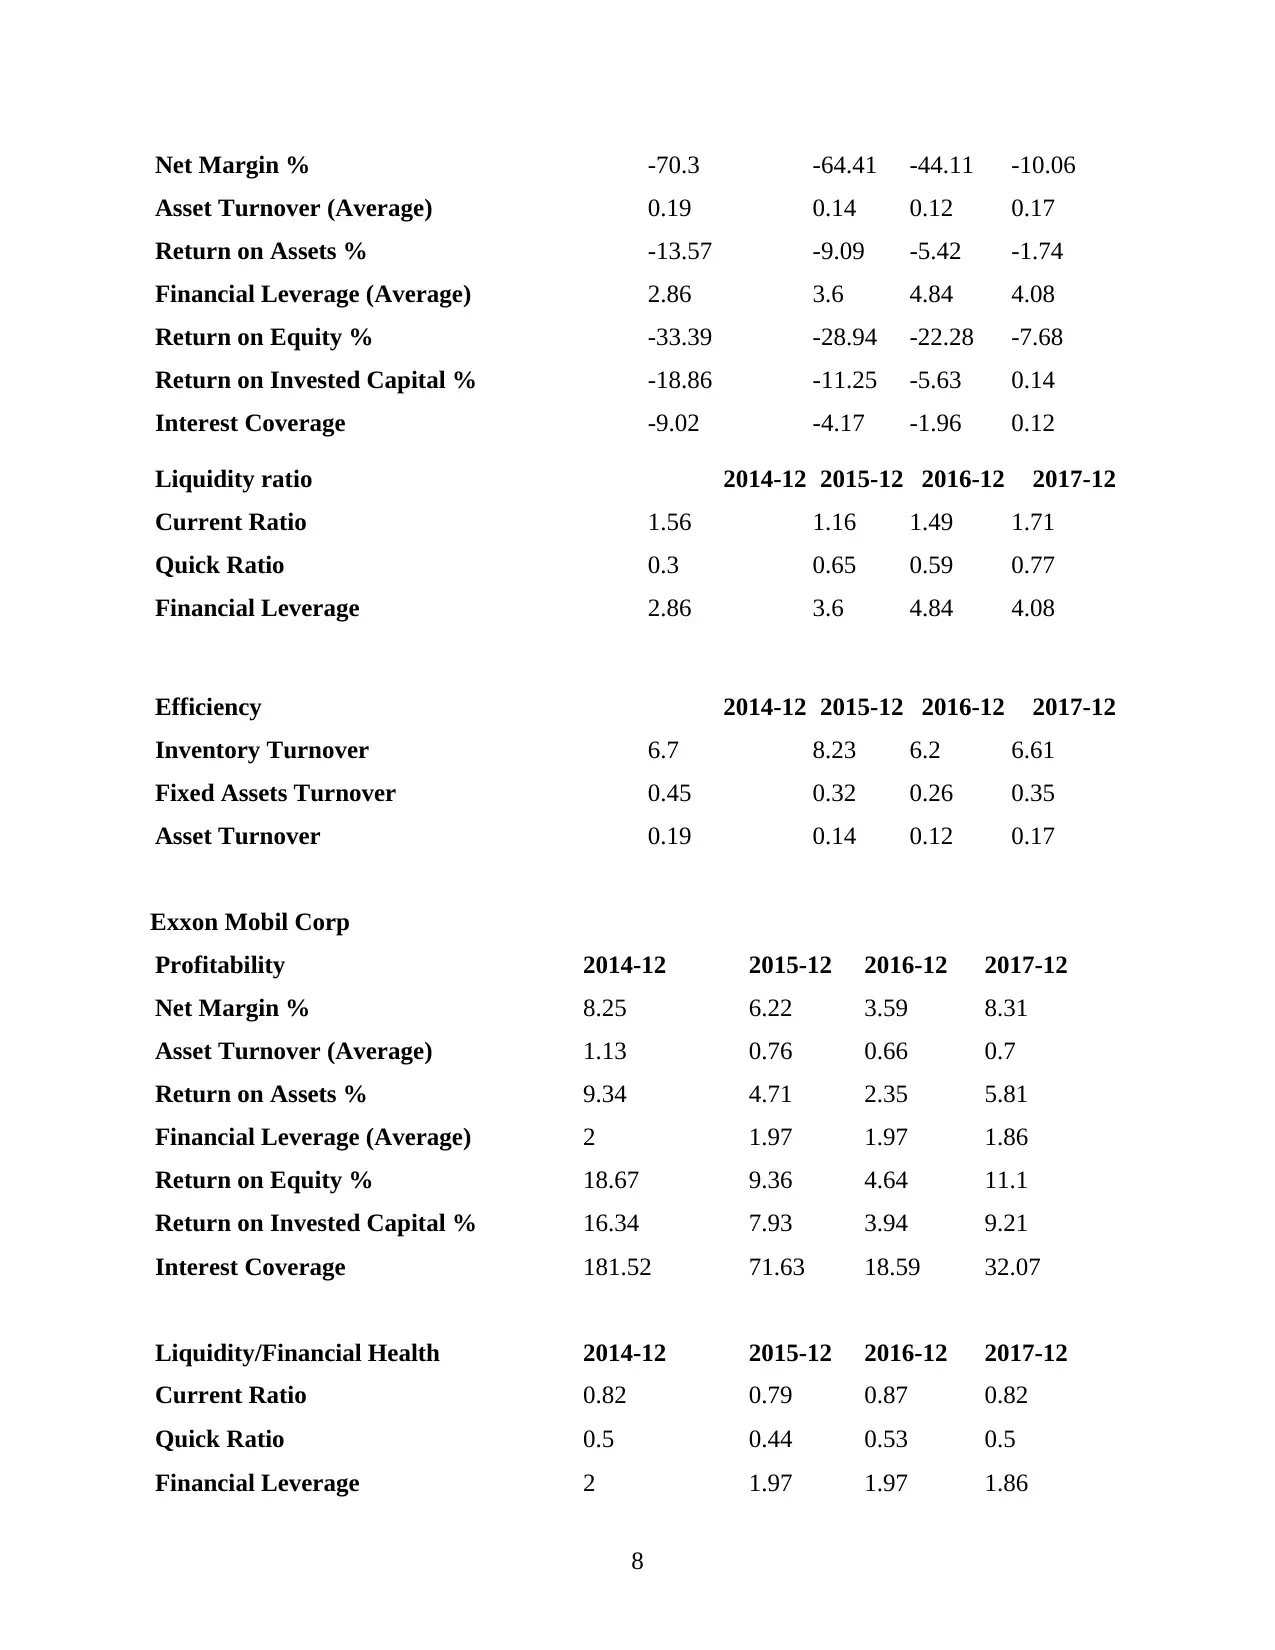
Net Margin % -70.3 -64.41 -44.11 -10.06
Asset Turnover (Average) 0.19 0.14 0.12 0.17
Return on Assets % -13.57 -9.09 -5.42 -1.74
Financial Leverage (Average) 2.86 3.6 4.84 4.08
Return on Equity % -33.39 -28.94 -22.28 -7.68
Return on Invested Capital % -18.86 -11.25 -5.63 0.14
Interest Coverage -9.02 -4.17 -1.96 0.12
Liquidity ratio 2014-12 2015-12 2016-12 2017-12
Current Ratio 1.56 1.16 1.49 1.71
Quick Ratio 0.3 0.65 0.59 0.77
Financial Leverage 2.86 3.6 4.84 4.08
Efficiency 2014-12 2015-12 2016-12 2017-12
Inventory Turnover 6.7 8.23 6.2 6.61
Fixed Assets Turnover 0.45 0.32 0.26 0.35
Asset Turnover 0.19 0.14 0.12 0.17
Exxon Mobil Corp
Profitability 2014-12 2015-12 2016-12 2017-12
Net Margin % 8.25 6.22 3.59 8.31
Asset Turnover (Average) 1.13 0.76 0.66 0.7
Return on Assets % 9.34 4.71 2.35 5.81
Financial Leverage (Average) 2 1.97 1.97 1.86
Return on Equity % 18.67 9.36 4.64 11.1
Return on Invested Capital % 16.34 7.93 3.94 9.21
Interest Coverage 181.52 71.63 18.59 32.07
Liquidity/Financial Health 2014-12 2015-12 2016-12 2017-12
Current Ratio 0.82 0.79 0.87 0.82
Quick Ratio 0.5 0.44 0.53 0.5
Financial Leverage 2 1.97 1.97 1.86
8
⊘ This is a preview!⊘
Do you want full access?
Subscribe today to unlock all pages.
Trusted by 1+ million students worldwide
1 out of 14
Related Documents


Your All-in-One AI-Powered Toolkit for Academic Success.
+13062052269
info@desklib.com
Available 24*7 on WhatsApp / Email
![[object Object]](/_next/static/media/star-bottom.7253800d.svg)
Unlock your academic potential
Copyright © 2020–2026 A2Z Services. All Rights Reserved. Developed and managed by ZUCOL.