Investment Analysis and Portfolio Management Report, Oct 2017
VerifiedAdded on 2019/10/31
|12
|2446
|126
Report
AI Summary
This report provides a comprehensive analysis of an investment portfolio, examining its performance within the global economic and industry environment. It presents the portfolio's outcome as of October 6th, 2017, including the value of various assets such as equity shares, LICs, and ETPs, alongside short selling positions. The report conducts a qualitative and quantitative analysis of the portfolio, calculating key metrics like return, standard deviation, Sharpe ratio, Treynor ratio, and Jensen ratio to assess its performance. Findings reveal a positive return of 0.17% over the specified period. The analysis highlights the impact of short selling on the portfolio's value and suggests portfolio modification recommendations, such as avoiding short selling in equity and index valuations and potentially including short selling in the index to diversify. The report concludes with a detailed reference list and appendices containing the portfolio's composition and performance data.
Running head: INVESTMENT ANALYSIS AND PORTFOLIO MANAGEMENT
Investment Analysis and Portfolio Management
Name of the Student:
Name of the University:
Authors Note:
Investment Analysis and Portfolio Management
Name of the Student:
Name of the University:
Authors Note:
Paraphrase This Document
Need a fresh take? Get an instant paraphrase of this document with our AI Paraphraser

1
INVESTMENT ANALYSIS AND PORTFOLIO MANAGEMENT
Table of Contents
1. Discussion of the global, economic and industry environment relating to the portfolio:......2
2. Presentation of the investment portfolio outcome as at October 6th 2017:...........................2
3. Qualitative and quantitative analysis of the investment portfolio and its performance:........4
4. Portfolio modification recommendations:..............................................................................5
Reference and Bibliography:......................................................................................................6
Appendices:................................................................................................................................7
2
INVESTMENT ANALYSIS AND PORTFOLIO MANAGEMENT
1. Discussion of the global, economic and industry environment relating to the portfolio:
The overall financial market, global economic industry is mainly progressing in
nature. In addition, from 2007 to 2017 the overall financial market and global industry
economy has relatively increased over time, which directly increase value of shares. The
financial market performance all around the world has gradually increased over time, which
in turn could generate higher revenue from investment. The overall shares that are used for
investments mainly help in generating higher revenue from investment. Maximum of the
portfolio value is mainly invested in shares of Australia, where maximum of the investments
are conducted on both shares and instruments. The relevant improvement in return from
Australian market is being witnessed, where index value is relatively increasing. Moreover,
the international market such as S&P 500 has relatively growing and touching higher highs.
The portfolio contains diverse portfolio value, where it could use short selling measures to
hedge the overall market (Akimova et al. 2015).
The portfolio holds mainly diverse companies stock, where it ranges from steel,
biotechnology, real estate and oil industry. The portfolio directly holds all the relevant stocks,
investment companies and ETFs. The relevant increment in value of stock is relative
increasing due to the positive move in the market. The portfolio directs accommodates that a
short selling measure, which is reducing the overall value of the portfolio.
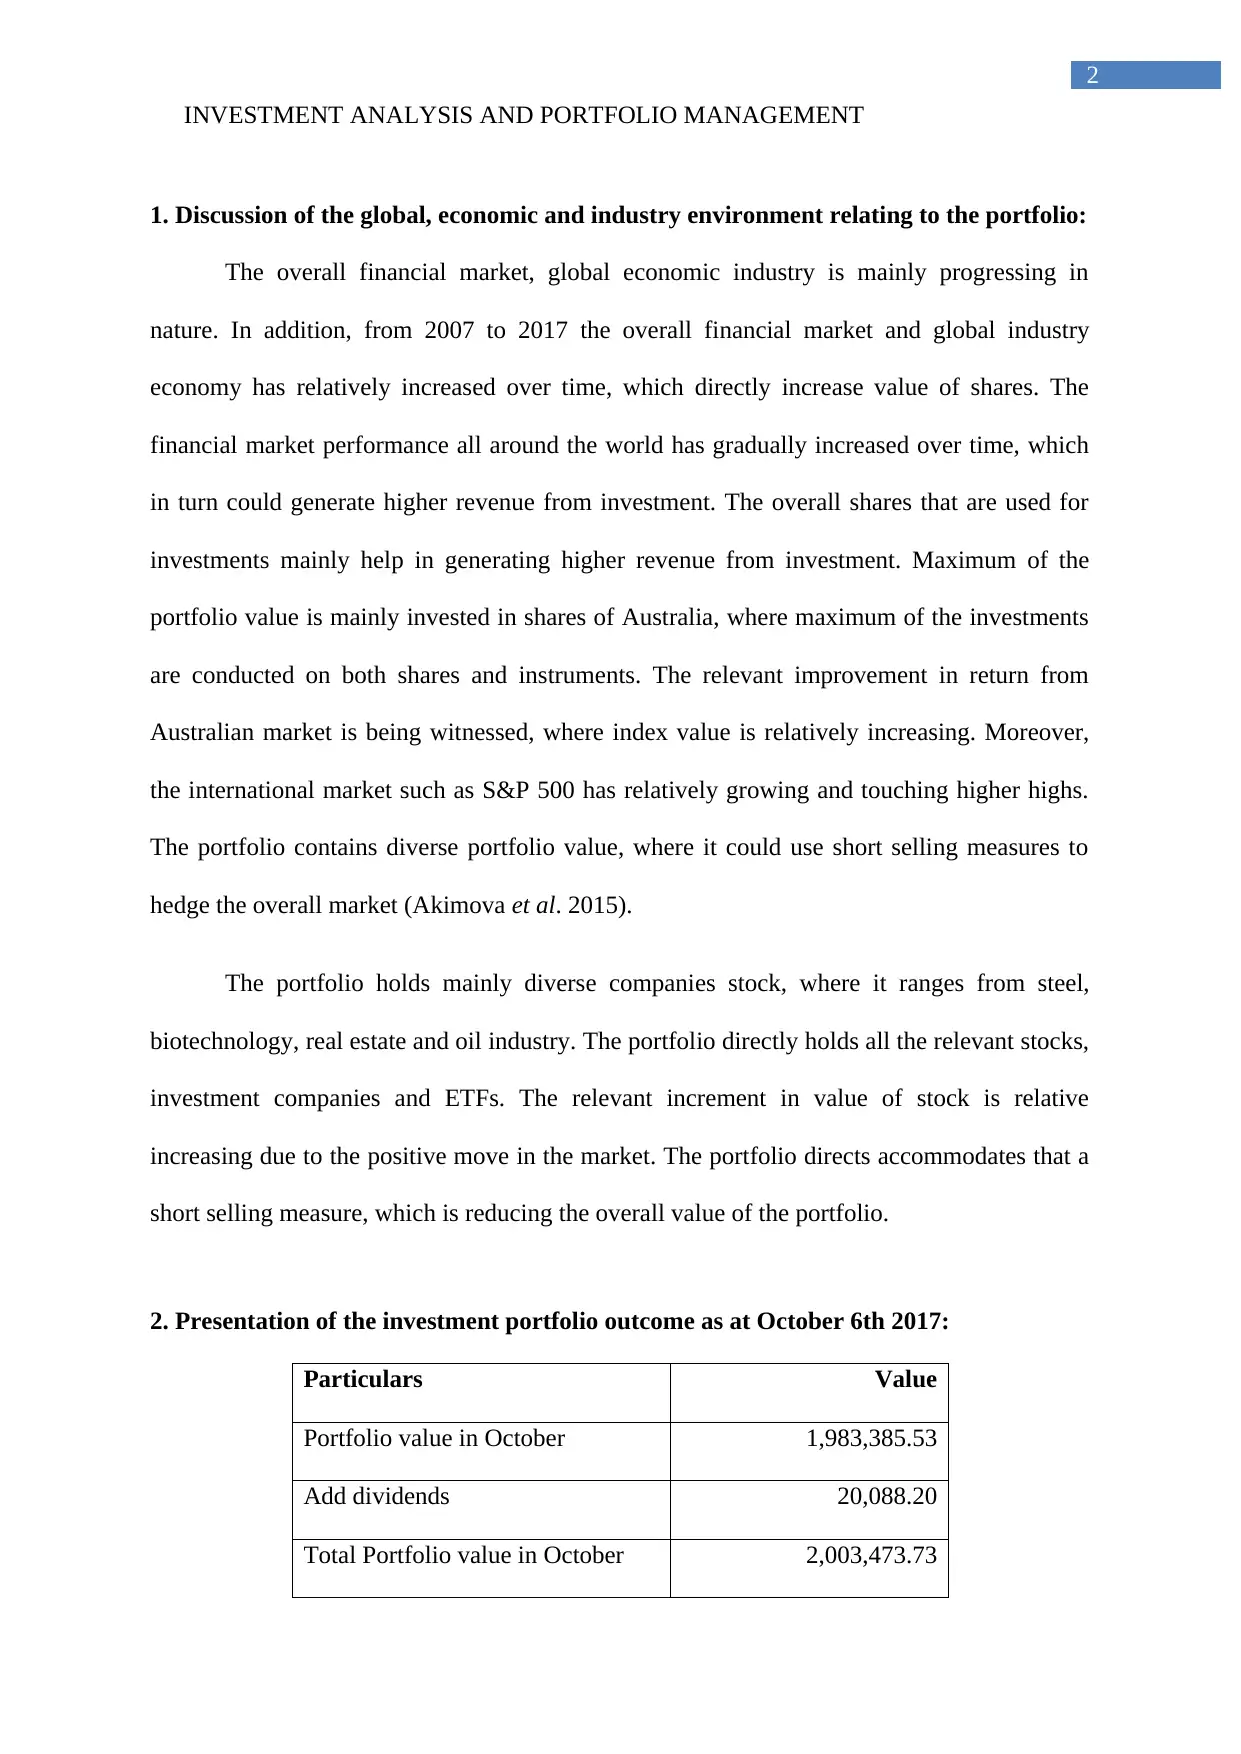
2. Presentation of the investment portfolio outcome as at October 6th 2017:
Particulars Value
Portfolio value in October 1,983,385.53
Add dividends 20,088.20
Total Portfolio value in October 2,003,473.73
INVESTMENT ANALYSIS AND PORTFOLIO MANAGEMENT
1. Discussion of the global, economic and industry environment relating to the portfolio:
The overall financial market, global economic industry is mainly progressing in
nature. In addition, from 2007 to 2017 the overall financial market and global industry
economy has relatively increased over time, which directly increase value of shares. The
financial market performance all around the world has gradually increased over time, which
in turn could generate higher revenue from investment. The overall shares that are used for
investments mainly help in generating higher revenue from investment. Maximum of the
portfolio value is mainly invested in shares of Australia, where maximum of the investments
are conducted on both shares and instruments. The relevant improvement in return from
Australian market is being witnessed, where index value is relatively increasing. Moreover,
the international market such as S&P 500 has relatively growing and touching higher highs.
The portfolio contains diverse portfolio value, where it could use short selling measures to
hedge the overall market (Akimova et al. 2015).
The portfolio holds mainly diverse companies stock, where it ranges from steel,
biotechnology, real estate and oil industry. The portfolio directly holds all the relevant stocks,
investment companies and ETFs. The relevant increment in value of stock is relative
increasing due to the positive move in the market. The portfolio directs accommodates that a
short selling measure, which is reducing the overall value of the portfolio.
2. Presentation of the investment portfolio outcome as at October 6th 2017:
Particulars Value
Portfolio value in October 1,983,385.53
Add dividends 20,088.20
Total Portfolio value in October 2,003,473.73
⊘ This is a preview!⊘
Do you want full access?
Subscribe today to unlock all pages.
Trusted by 1+ million students worldwide
3
INVESTMENT ANALYSIS AND PORTFOLIO MANAGEMENT
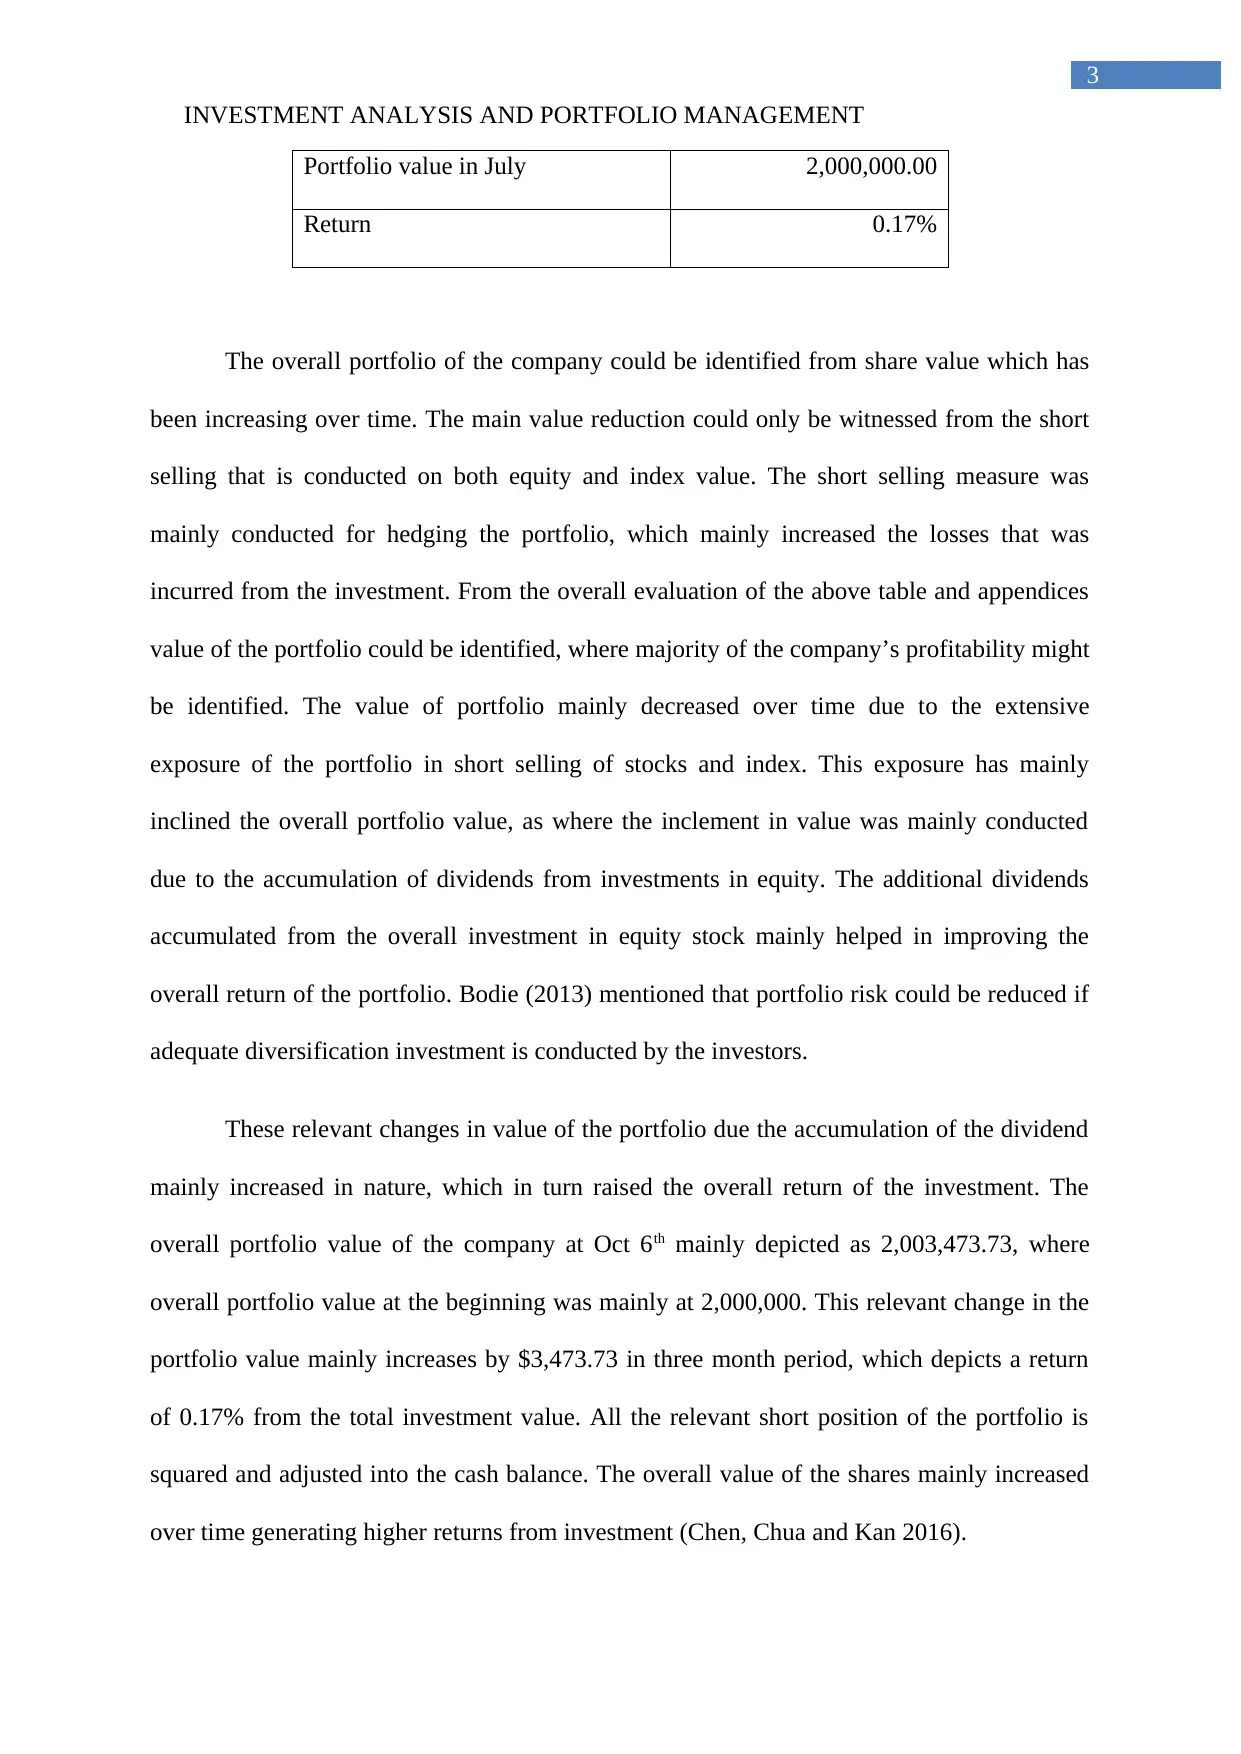
Portfolio value in July 2,000,000.00
Return 0.17%
The overall portfolio of the company could be identified from share value which has
been increasing over time. The main value reduction could only be witnessed from the short
selling that is conducted on both equity and index value. The short selling measure was
mainly conducted for hedging the portfolio, which mainly increased the losses that was
incurred from the investment. From the overall evaluation of the above table and appendices
value of the portfolio could be identified, where majority of the company’s profitability might
be identified. The value of portfolio mainly decreased over time due to the extensive
exposure of the portfolio in short selling of stocks and index. This exposure has mainly
inclined the overall portfolio value, as where the inclement in value was mainly conducted
due to the accumulation of dividends from investments in equity. The additional dividends
accumulated from the overall investment in equity stock mainly helped in improving the
overall return of the portfolio. Bodie (2013) mentioned that portfolio risk could be reduced if
adequate diversification investment is conducted by the investors.
These relevant changes in value of the portfolio due the accumulation of the dividend
mainly increased in nature, which in turn raised the overall return of the investment. The
overall portfolio value of the company at Oct 6th mainly depicted as 2,003,473.73, where
overall portfolio value at the beginning was mainly at 2,000,000. This relevant change in the
portfolio value mainly increases by $3,473.73 in three month period, which depicts a return
of 0.17% from the total investment value. All the relevant short position of the portfolio is
squared and adjusted into the cash balance. The overall value of the shares mainly increased
over time generating higher returns from investment (Chen, Chua and Kan 2016).
INVESTMENT ANALYSIS AND PORTFOLIO MANAGEMENT
Portfolio value in July 2,000,000.00
Return 0.17%
The overall portfolio of the company could be identified from share value which has
been increasing over time. The main value reduction could only be witnessed from the short
selling that is conducted on both equity and index value. The short selling measure was
mainly conducted for hedging the portfolio, which mainly increased the losses that was
incurred from the investment. From the overall evaluation of the above table and appendices
value of the portfolio could be identified, where majority of the company’s profitability might
be identified. The value of portfolio mainly decreased over time due to the extensive
exposure of the portfolio in short selling of stocks and index. This exposure has mainly
inclined the overall portfolio value, as where the inclement in value was mainly conducted
due to the accumulation of dividends from investments in equity. The additional dividends
accumulated from the overall investment in equity stock mainly helped in improving the
overall return of the portfolio. Bodie (2013) mentioned that portfolio risk could be reduced if
adequate diversification investment is conducted by the investors.
These relevant changes in value of the portfolio due the accumulation of the dividend
mainly increased in nature, which in turn raised the overall return of the investment. The
overall portfolio value of the company at Oct 6th mainly depicted as 2,003,473.73, where
overall portfolio value at the beginning was mainly at 2,000,000. This relevant change in the
portfolio value mainly increases by $3,473.73 in three month period, which depicts a return
of 0.17% from the total investment value. All the relevant short position of the portfolio is
squared and adjusted into the cash balance. The overall value of the shares mainly increased
over time generating higher returns from investment (Chen, Chua and Kan 2016).
Paraphrase This Document
Need a fresh take? Get an instant paraphrase of this document with our AI Paraphraser
4
INVESTMENT ANALYSIS AND PORTFOLIO MANAGEMENT
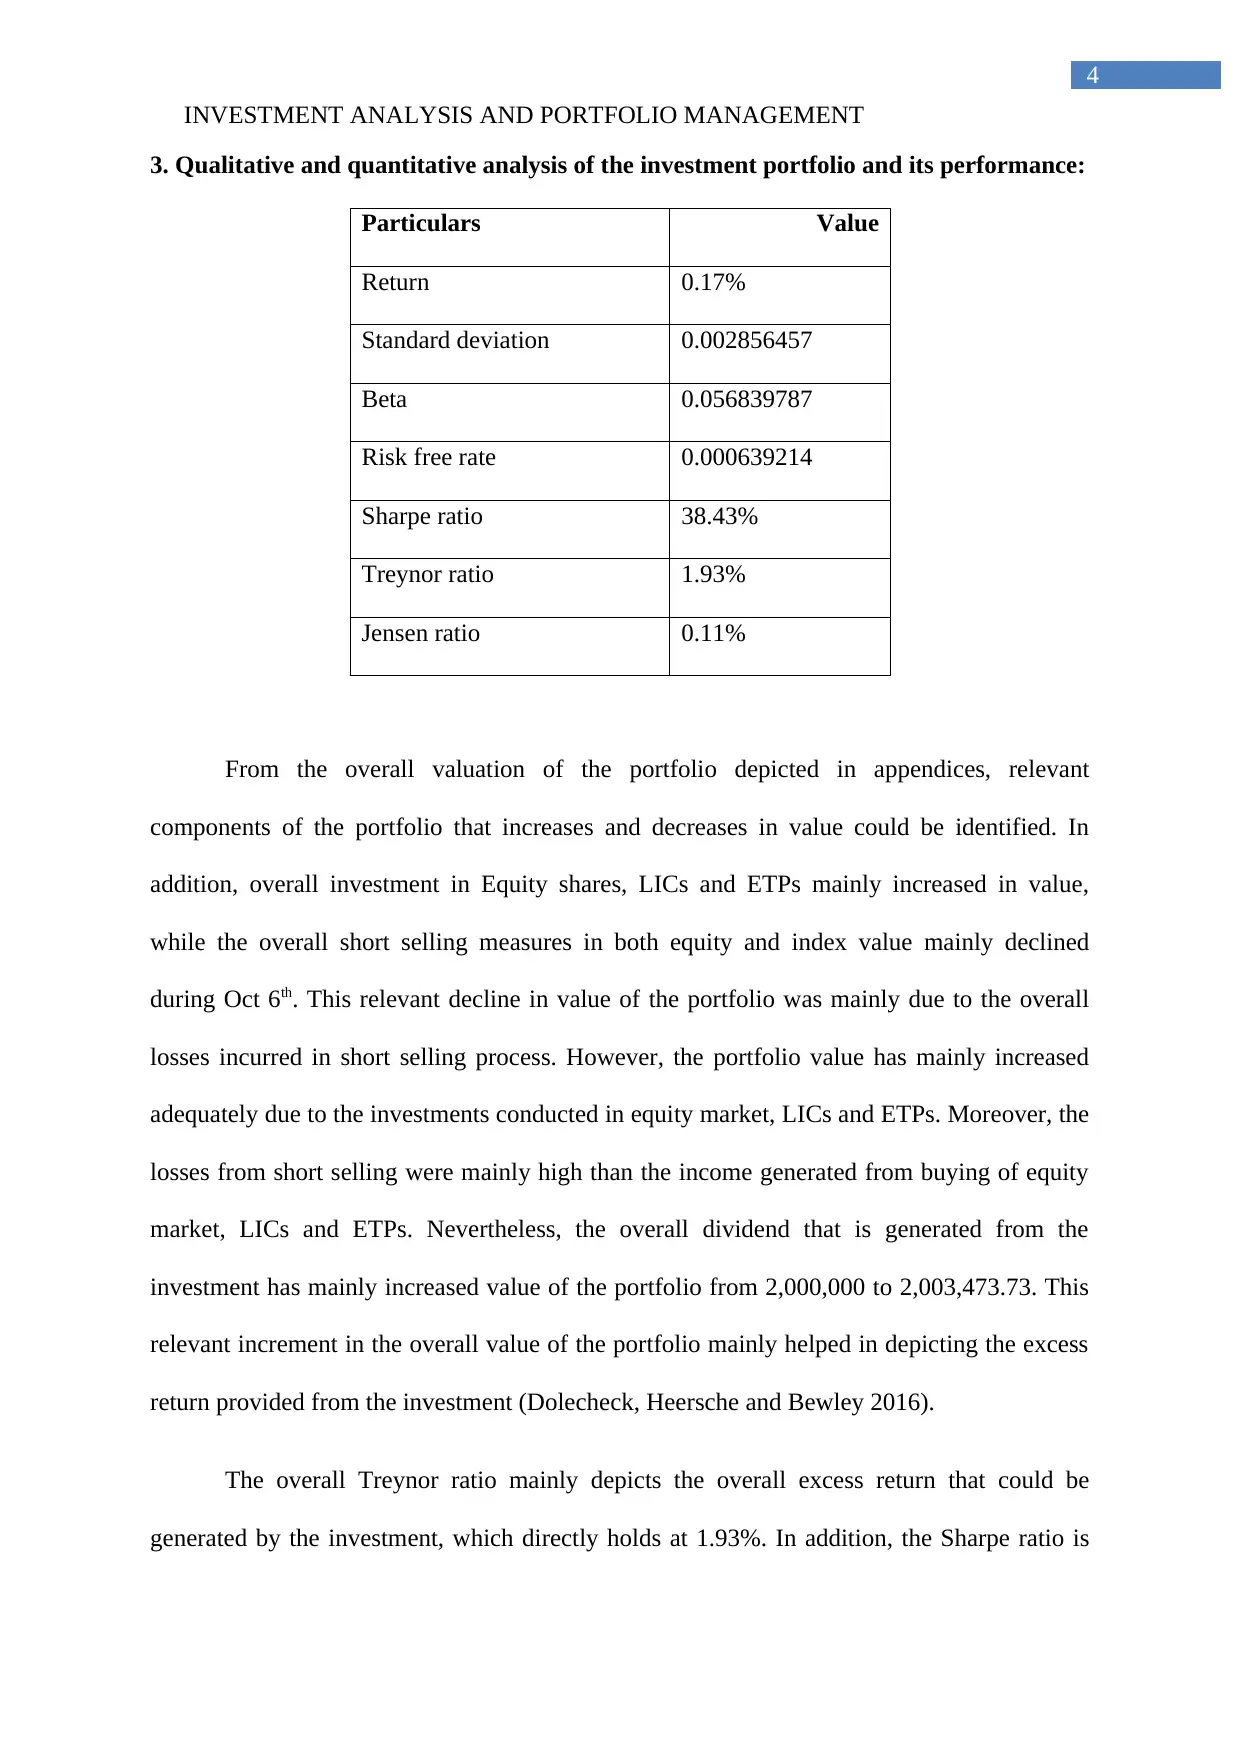
3. Qualitative and quantitative analysis of the investment portfolio and its performance:
Particulars Value
Return 0.17%
Standard deviation 0.002856457
Beta 0.056839787
Risk free rate 0.000639214
Sharpe ratio 38.43%
Treynor ratio 1.93%
Jensen ratio 0.11%
From the overall valuation of the portfolio depicted in appendices, relevant
components of the portfolio that increases and decreases in value could be identified. In
addition, overall investment in Equity shares, LICs and ETPs mainly increased in value,
while the overall short selling measures in both equity and index value mainly declined
during Oct 6th. This relevant decline in value of the portfolio was mainly due to the overall
losses incurred in short selling process. However, the portfolio value has mainly increased
adequately due to the investments conducted in equity market, LICs and ETPs. Moreover, the
losses from short selling were mainly high than the income generated from buying of equity
market, LICs and ETPs. Nevertheless, the overall dividend that is generated from the
investment has mainly increased value of the portfolio from 2,000,000 to 2,003,473.73. This
relevant increment in the overall value of the portfolio mainly helped in depicting the excess
return provided from the investment (Dolecheck, Heersche and Bewley 2016).
The overall Treynor ratio mainly depicts the overall excess return that could be
generated by the investment, which directly holds at 1.93%. In addition, the Sharpe ratio is
INVESTMENT ANALYSIS AND PORTFOLIO MANAGEMENT
3. Qualitative and quantitative analysis of the investment portfolio and its performance:
Particulars Value
Return 0.17%
Standard deviation 0.002856457
Beta 0.056839787
Risk free rate 0.000639214
Sharpe ratio 38.43%
Treynor ratio 1.93%
Jensen ratio 0.11%
From the overall valuation of the portfolio depicted in appendices, relevant
components of the portfolio that increases and decreases in value could be identified. In
addition, overall investment in Equity shares, LICs and ETPs mainly increased in value,
while the overall short selling measures in both equity and index value mainly declined
during Oct 6th. This relevant decline in value of the portfolio was mainly due to the overall
losses incurred in short selling process. However, the portfolio value has mainly increased
adequately due to the investments conducted in equity market, LICs and ETPs. Moreover, the
losses from short selling were mainly high than the income generated from buying of equity
market, LICs and ETPs. Nevertheless, the overall dividend that is generated from the
investment has mainly increased value of the portfolio from 2,000,000 to 2,003,473.73. This
relevant increment in the overall value of the portfolio mainly helped in depicting the excess
return provided from the investment (Dolecheck, Heersche and Bewley 2016).
The overall Treynor ratio mainly depicts the overall excess return that could be
generated by the investment, which directly holds at 1.93%. In addition, the Sharpe ratio is
5
INVESTMENT ANALYSIS AND PORTFOLIO MANAGEMENT
mainly calculated at 38.43%, which depicts the excess returns that are conducted by the
portfolio in comparison with the market. Lastly, the Jenson ratio is identified to be at 0.11%,
which depicts the relevant outperformance conducted by the portfolio in compatriots to the
market expectations. Hence, maximum of the overall return is evaluated in different ratios
indicates a higher return that is provided by the portfolio within 3 months time. Landau et al.
(2015) mentioned that overall valuation of ratio mainly allows the investor to detect viability
of the portfolio and its ability to beat the market, while providing higher returns.
4. Portfolio modification recommendations:
From the overall evaluation of the portfolio and the return generation capacity of
different investment components relevant changes could be conducted. These changes could
mainly help in improving the overall profitability condition and reduce any kind of losses,
which is depicted from operations. Therefore, the investment in short selling could be
avoided on both equity and index valuation. However, the long position in index value could
also be avoided. This will mainly leave cash, equity market, LICs and ETPs for investment,
where the overall investment in short selling of index could be conducted to included
diversification to the portfolio. Hence, the coverall recommendation to the portfolio could
mainly help in improving portfolio return and reduce risk from investment.
⊘ This is a preview!⊘
Do you want full access?
Subscribe today to unlock all pages.
Trusted by 1+ million students worldwide
6
INVESTMENT ANALYSIS AND PORTFOLIO MANAGEMENT
Reference and Bibliography:
Akimova, E.M., Stein, E.M. and Prokhorova, Y.S., 2015. System Analysis in the Investment
Processes Management and Theoretical Principles of the Investments Assessment. Journal of
Advanced Research in Law and Economics, 6(3 (13)), p.472.
Bodie, Z., 2013. Investments. McGraw-Hill.
Chen, K.Y., Chua, H. and Kan, C.W., 2016. Public Environmental Investment Analysis of
Japan. World Academy of Science, Engineering and Technology, International Journal of
Civil and Environmental Engineering, 3(12).
Chisholm, D., Sweeny, K., Sheehan, P., Rasmussen, B., Smit, F., Cuijpers, P. and Saxena, S.,
2016. Scaling-up treatment of depression and anxiety: a global return on investment
analysis. The Lancet Psychiatry, 3(5), pp.415-424.
DeFusco, R.A., McLeavey, D.W., Anson, M.J., Pinto, J.E. and Runkle, D.E.,
2015. Quantitative investment analysis. John Wiley & Sons.
Dolecheck, K.A., Heersche, G. and Bewley, J.M., 2016. Retention payoff–based cost per day
open regression equations: Application in a user-friendly decision support tool for investment
analysis of automated estrus detection technologies. Journal of dairy science, 99(12),
pp.10182-10193.
Landau, S., Weisbrod, G., Gosling, G., Williges, C., Pumphrey, M. and Fowler, M.,
2015. Passenger Value of Time, Benefit-Cost Analysis, and Airport Capital Investment
Decisions. Volume 1: Guidebook for Valuing User Time Savings in Airport Capital
Investment Decision Analysis (No. ACRP 03-19).
Paraphrase This Document
Need a fresh take? Get an instant paraphrase of this document with our AI Paraphraser
7
INVESTMENT ANALYSIS AND PORTFOLIO MANAGEMENT
Runkle, D.E., DeFusco, R.A., Anson, M.J., Pinto, J.E. and McLeavey, D.W.,
2013. Quantitative Investment Analysis. Wiley.
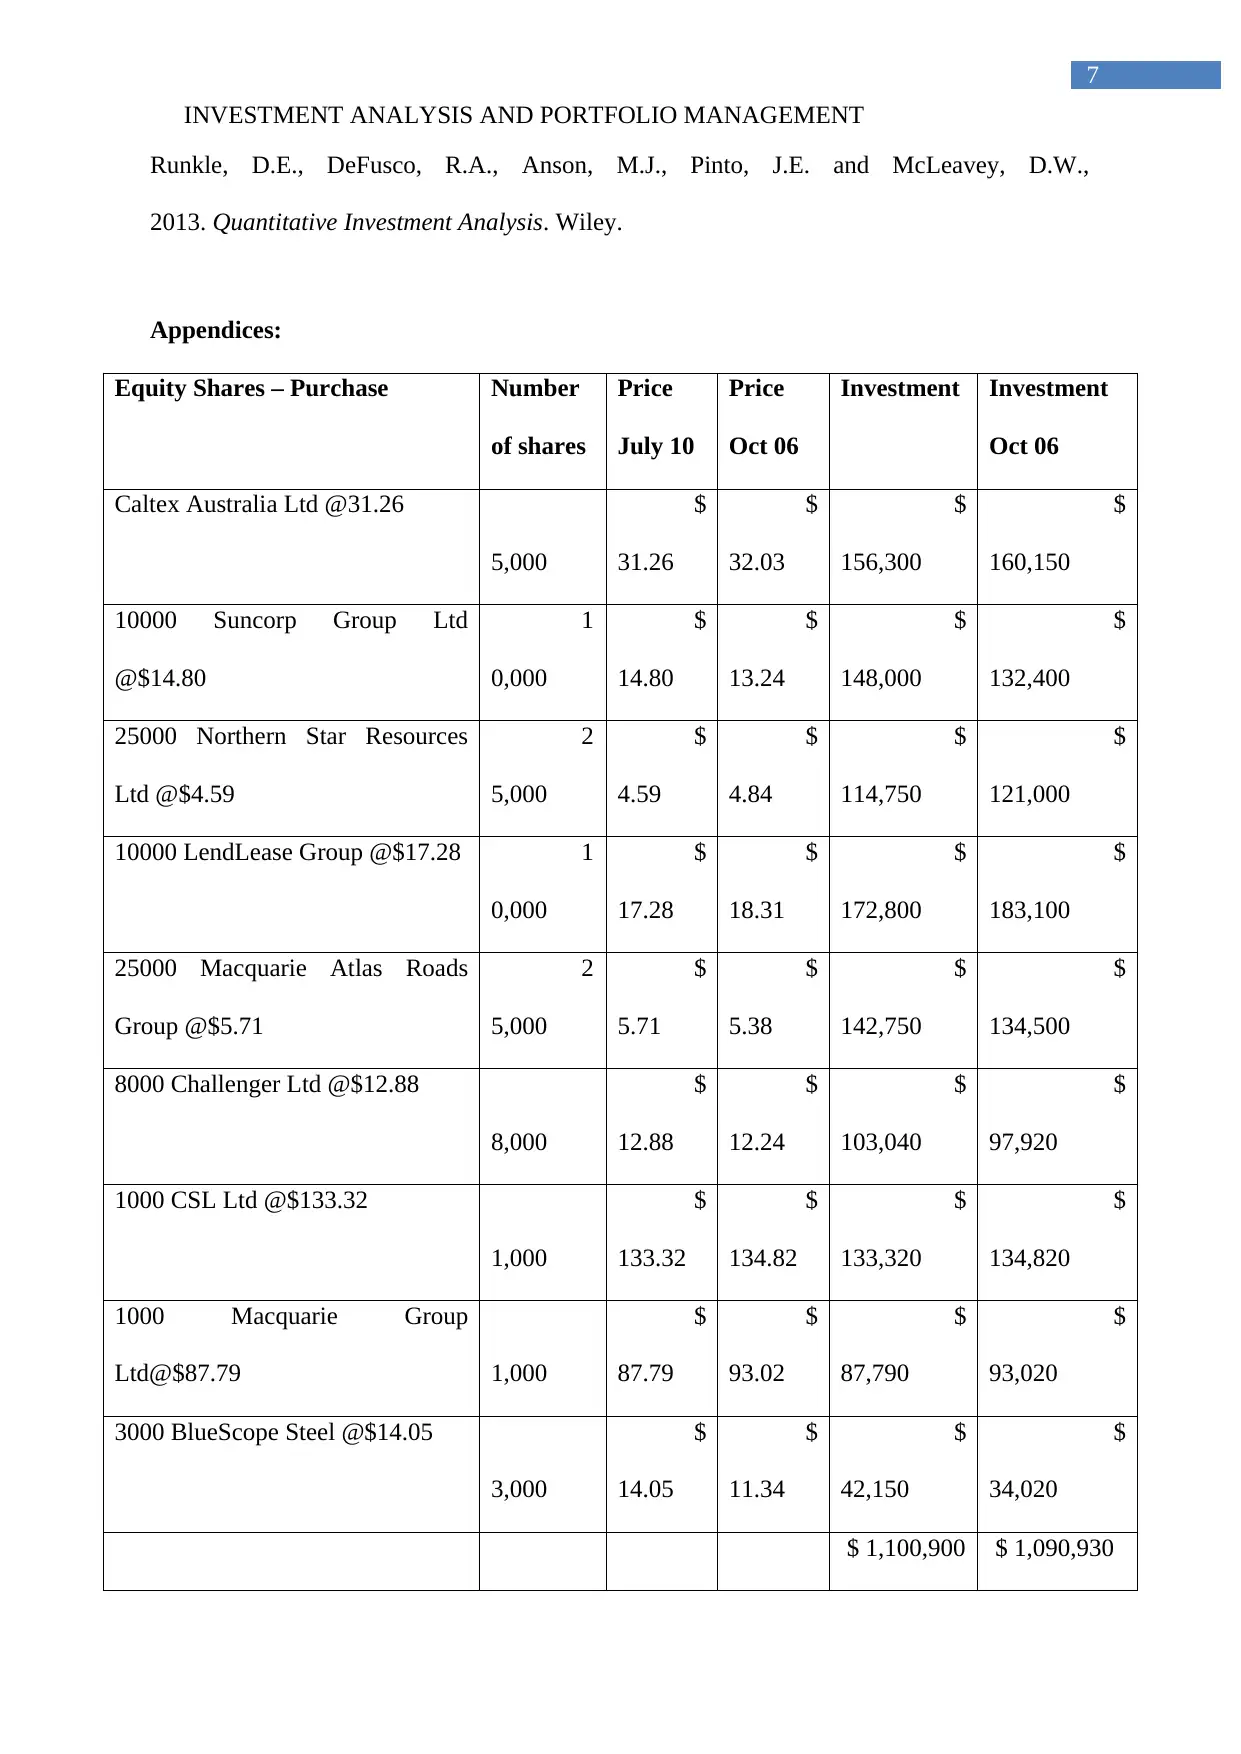
Appendices:
Equity Shares – Purchase Number
of shares
Price
July 10
Price
Oct 06
Investment Investment
Oct 06
Caltex Australia Ltd @31.26
5,000
$
31.26
$
32.03
$
156,300
$
160,150
10000 Suncorp Group Ltd
@$14.80
1
0,000
$
14.80
$
13.24
$
148,000
$
132,400
25000 Northern Star Resources
Ltd @$4.59
2
5,000
$
4.59
$
4.84
$
114,750
$
121,000
10000 LendLease Group @$17.28 1
0,000
$
17.28
$
18.31
$
172,800
$
183,100
25000 Macquarie Atlas Roads
Group @$5.71
2
5,000
$
5.71
$
5.38
$
142,750
$
134,500
8000 Challenger Ltd @$12.88
8,000
$
12.88
$
12.24
$
103,040
$
97,920
1000 CSL Ltd @$133.32
1,000
$
133.32
$
134.82
$
133,320
$
134,820
1000 Macquarie Group
Ltd@$87.79 1,000
$
87.79
$
93.02
$
87,790
$
93,020
3000 BlueScope Steel @$14.05
3,000
$
14.05
$
11.34
$
42,150
$
34,020
$ 1,100,900 $ 1,090,930
INVESTMENT ANALYSIS AND PORTFOLIO MANAGEMENT
Runkle, D.E., DeFusco, R.A., Anson, M.J., Pinto, J.E. and McLeavey, D.W.,
2013. Quantitative Investment Analysis. Wiley.
Appendices:
Equity Shares – Purchase Number
of shares
Price
July 10
Price
Oct 06
Investment Investment
Oct 06
Caltex Australia Ltd @31.26
5,000
$
31.26
$
32.03
$
156,300
$
160,150
10000 Suncorp Group Ltd
@$14.80
1
0,000
$
14.80
$
13.24
$
148,000
$
132,400
25000 Northern Star Resources
Ltd @$4.59
2
5,000
$
4.59
$
4.84
$
114,750
$
121,000
10000 LendLease Group @$17.28 1
0,000
$
17.28
$
18.31
$
172,800
$
183,100
25000 Macquarie Atlas Roads
Group @$5.71
2
5,000
$
5.71
$
5.38
$
142,750
$
134,500
8000 Challenger Ltd @$12.88
8,000
$
12.88
$
12.24
$
103,040
$
97,920
1000 CSL Ltd @$133.32
1,000
$
133.32
$
134.82
$
133,320
$
134,820
1000 Macquarie Group
Ltd@$87.79 1,000
$
87.79
$
93.02
$
87,790
$
93,020
3000 BlueScope Steel @$14.05
3,000
$
14.05
$
11.34
$
42,150
$
34,020
$ 1,100,900 $ 1,090,930
8
INVESTMENT ANALYSIS AND PORTFOLIO MANAGEMENT
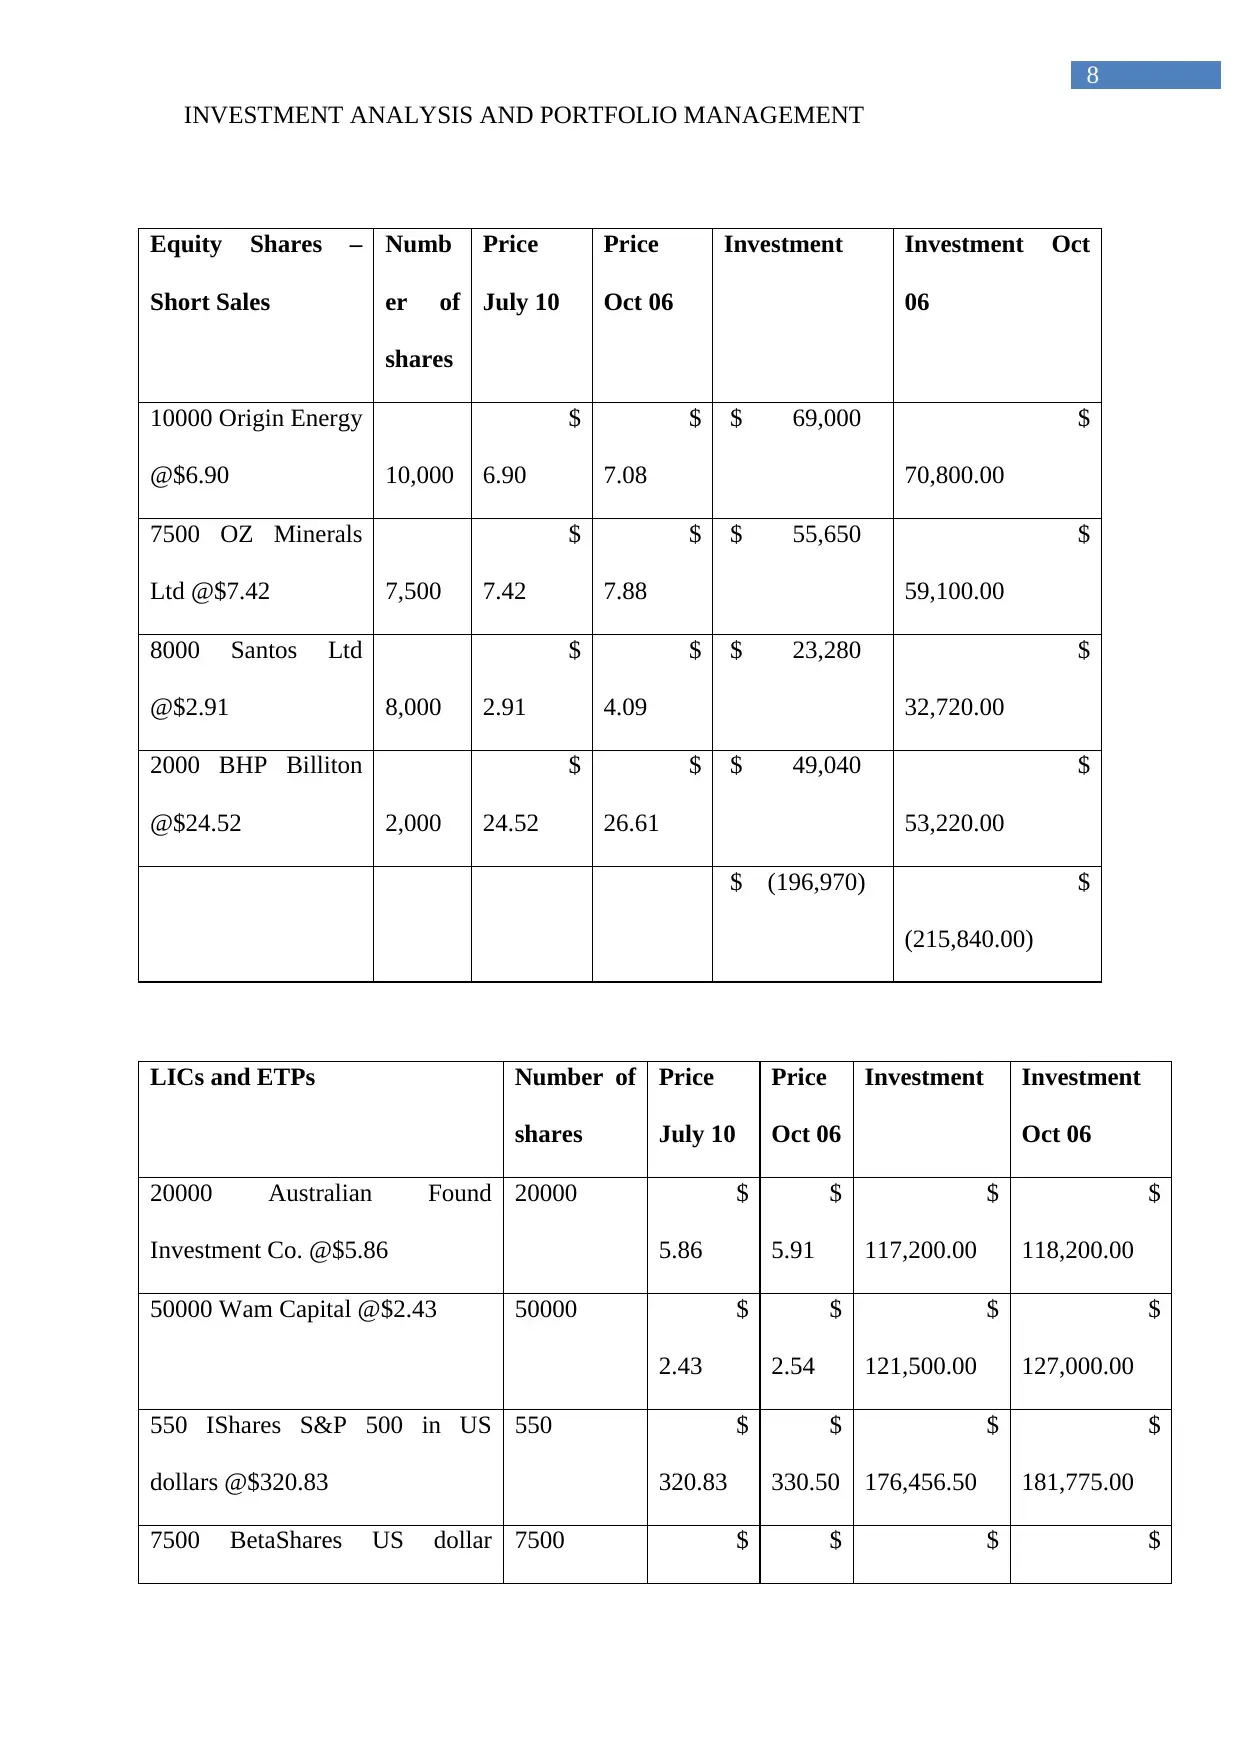
Equity Shares –
Short Sales
Numb
er of
shares
Price
July 10
Price
Oct 06
Investment Investment Oct
06
10000 Origin Energy
@$6.90 10,000
$
6.90
$
7.08
$ 69,000 $
70,800.00
7500 OZ Minerals
Ltd @$7.42 7,500
$
7.42
$
7.88
$ 55,650 $
59,100.00
8000 Santos Ltd
@$2.91 8,000
$
2.91
$
4.09
$ 23,280 $
32,720.00
2000 BHP Billiton
@$24.52 2,000
$
24.52
$
26.61
$ 49,040 $
53,220.00
$ (196,970) $
(215,840.00)
LICs and ETPs Number of
shares
Price
July 10
Price
Oct 06
Investment Investment
Oct 06
20000 Australian Found
Investment Co. @$5.86
20000 $
5.86
$
5.91
$
117,200.00
$
118,200.00
50000 Wam Capital @$2.43 50000 $
2.43
$
2.54
$
121,500.00
$
127,000.00
550 IShares S&P 500 in US
dollars @$320.83
550 $
320.83
$
330.50
$
176,456.50
$
181,775.00
7500 BetaShares US dollar 7500 $ $ $ $
INVESTMENT ANALYSIS AND PORTFOLIO MANAGEMENT
Equity Shares –
Short Sales
Numb
er of
shares
Price
July 10
Price
Oct 06
Investment Investment Oct
06
10000 Origin Energy
@$6.90 10,000
$
6.90
$
7.08
$ 69,000 $
70,800.00
7500 OZ Minerals
Ltd @$7.42 7,500
$
7.42
$
7.88
$ 55,650 $
59,100.00
8000 Santos Ltd
@$2.91 8,000
$
2.91
$
4.09
$ 23,280 $
32,720.00
2000 BHP Billiton
@$24.52 2,000
$
24.52
$
26.61
$ 49,040 $
53,220.00
$ (196,970) $
(215,840.00)
LICs and ETPs Number of
shares
Price
July 10
Price
Oct 06
Investment Investment
Oct 06
20000 Australian Found
Investment Co. @$5.86
20000 $
5.86
$
5.91
$
117,200.00
$
118,200.00
50000 Wam Capital @$2.43 50000 $
2.43
$
2.54
$
121,500.00
$
127,000.00
550 IShares S&P 500 in US
dollars @$320.83
550 $
320.83
$
330.50
$
176,456.50
$
181,775.00
7500 BetaShares US dollar 7500 $ $ $ $
⊘ This is a preview!⊘
Do you want full access?
Subscribe today to unlock all pages.
Trusted by 1+ million students worldwide
9
INVESTMENT ANALYSIS AND PORTFOLIO MANAGEMENT
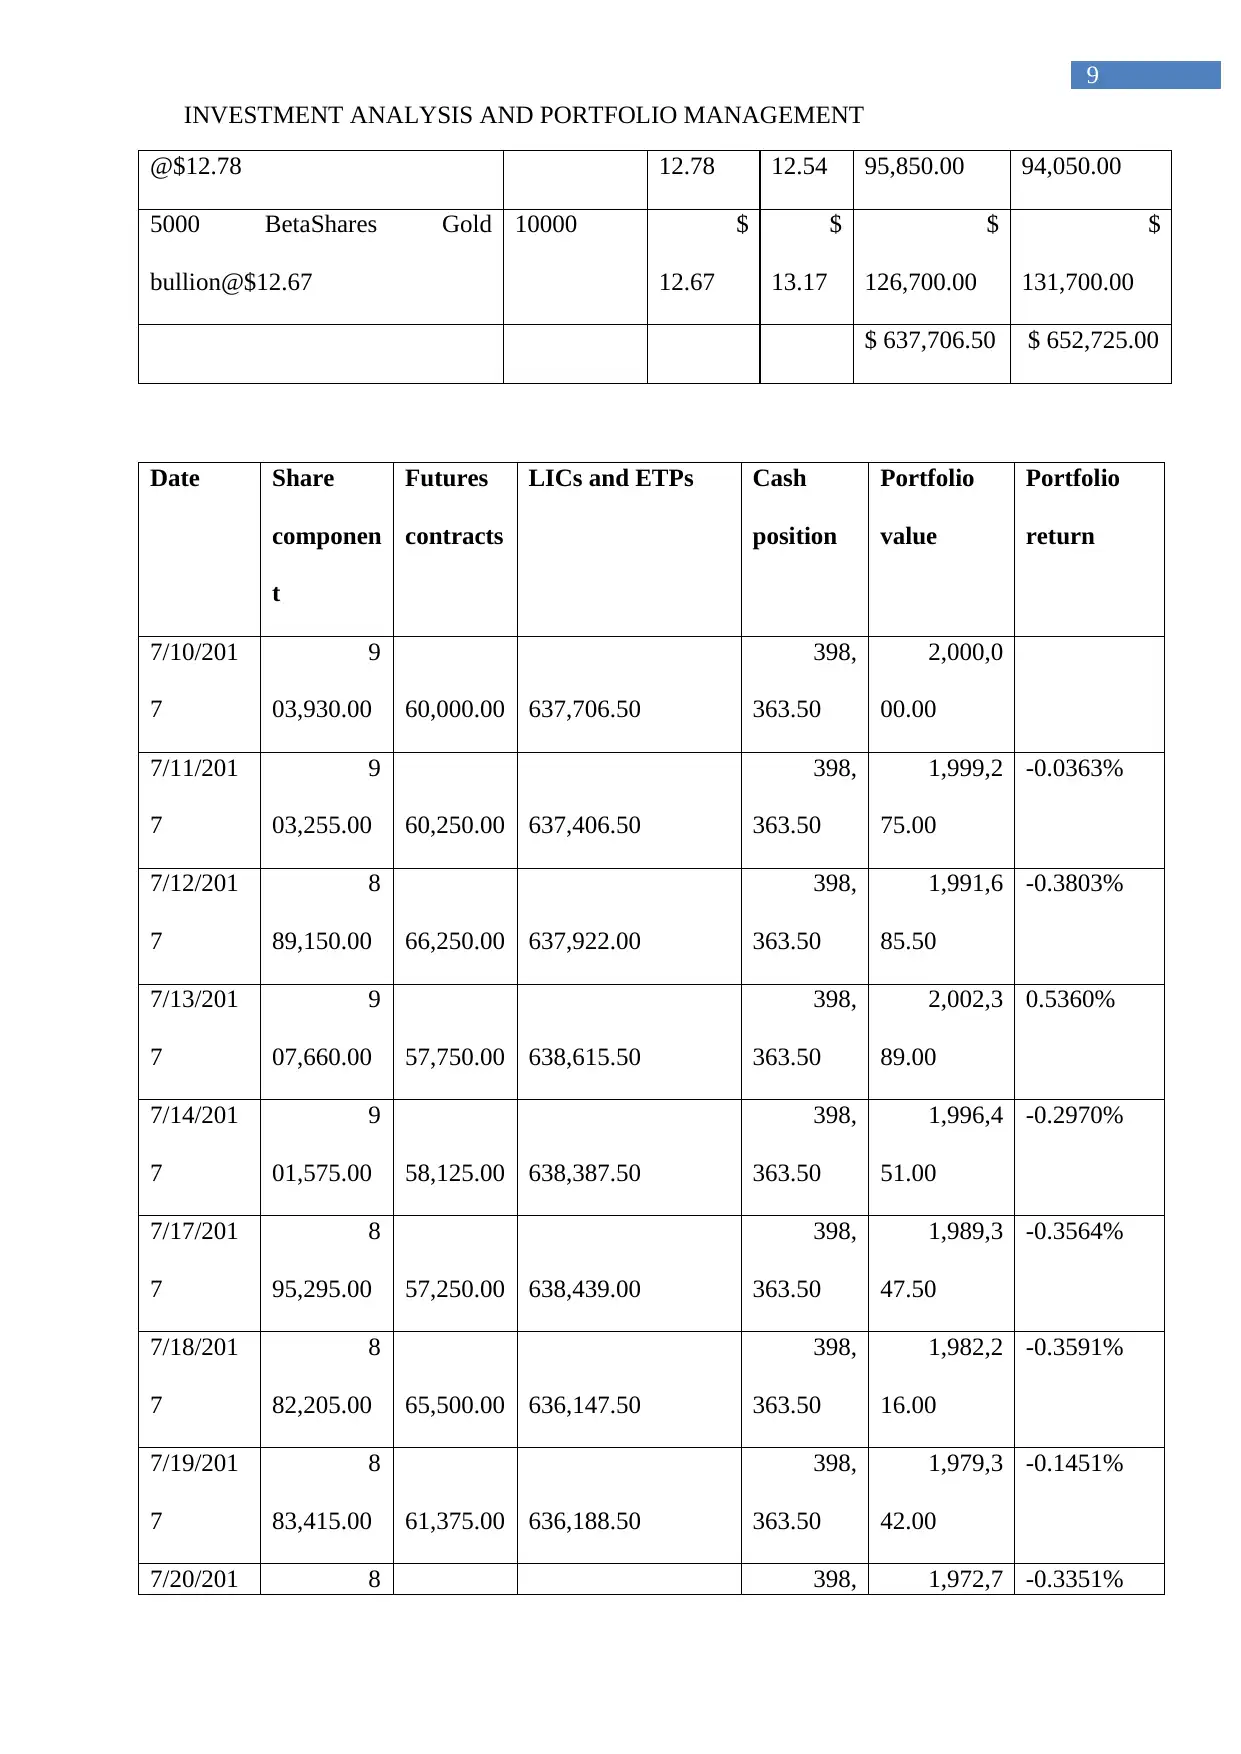
@$12.78 12.78 12.54 95,850.00 94,050.00
5000 BetaShares Gold
bullion@$12.67
10000 $
12.67
$
13.17
$
126,700.00
$
131,700.00
$ 637,706.50 $ 652,725.00
Date Share
componen
t
Futures
contracts
LICs and ETPs Cash
position
Portfolio
value
Portfolio
return
7/10/201
7
9
03,930.00 60,000.00 637,706.50
398,
363.50
2,000,0
00.00
7/11/201
7
9
03,255.00 60,250.00 637,406.50
398,
363.50
1,999,2
75.00
-0.0363%
7/12/201
7
8
89,150.00 66,250.00 637,922.00
398,
363.50
1,991,6
85.50
-0.3803%
7/13/201
7
9
07,660.00 57,750.00 638,615.50
398,
363.50
2,002,3
89.00
0.5360%
7/14/201
7
9
01,575.00 58,125.00 638,387.50
398,
363.50
1,996,4
51.00
-0.2970%
7/17/201
7
8
95,295.00 57,250.00 638,439.00
398,
363.50
1,989,3
47.50
-0.3564%
7/18/201
7
8
82,205.00 65,500.00 636,147.50
398,
363.50
1,982,2
16.00
-0.3591%
7/19/201
7
8
83,415.00 61,375.00 636,188.50
398,
363.50
1,979,3
42.00
-0.1451%
7/20/201 8 398, 1,972,7 -0.3351%
INVESTMENT ANALYSIS AND PORTFOLIO MANAGEMENT
@$12.78 12.78 12.54 95,850.00 94,050.00
5000 BetaShares Gold
bullion@$12.67
10000 $
12.67
$
13.17
$
126,700.00
$
131,700.00
$ 637,706.50 $ 652,725.00
Date Share
componen
t
Futures
contracts
LICs and ETPs Cash
position
Portfolio
value
Portfolio
return
7/10/201
7
9
03,930.00 60,000.00 637,706.50
398,
363.50
2,000,0
00.00
7/11/201
7
9
03,255.00 60,250.00 637,406.50
398,
363.50
1,999,2
75.00
-0.0363%
7/12/201
7
8
89,150.00 66,250.00 637,922.00
398,
363.50
1,991,6
85.50
-0.3803%
7/13/201
7
9
07,660.00 57,750.00 638,615.50
398,
363.50
2,002,3
89.00
0.5360%
7/14/201
7
9
01,575.00 58,125.00 638,387.50
398,
363.50
1,996,4
51.00
-0.2970%
7/17/201
7
8
95,295.00 57,250.00 638,439.00
398,
363.50
1,989,3
47.50
-0.3564%
7/18/201
7
8
82,205.00 65,500.00 636,147.50
398,
363.50
1,982,2
16.00
-0.3591%
7/19/201
7
8
83,415.00 61,375.00 636,188.50
398,
363.50
1,979,3
42.00
-0.1451%
7/20/201 8 398, 1,972,7 -0.3351%
Paraphrase This Document
Need a fresh take? Get an instant paraphrase of this document with our AI Paraphraser

10
INVESTMENT ANALYSIS AND PORTFOLIO MANAGEMENT
7 81,070.00 57,125.00 636,161.00 363.50 19.50
7/21/201
7
8
78,735.00 61,500.00 638,937.00
398,
363.50
1,977,5
35.50
0.2438%
7/24/201
7
8
72,520.00 66,375.00 638,768.50
398,
363.50
1,976,0
27.00
-0.0763%
7/25/201
7
8
82,965.00 61,625.00 638,420.50
398,
363.50
1,981,3
74.00
0.2702%
7/26/201
7
8
78,100.00 55,000.00 641,332.00
398,
363.50
1,972,7
95.50
-0.4339%
7/27/201
7
8
79,760.00 54,625.00 638,311.00
398,
363.50
1,971,0
59.50
-0.0880%
7/28/201
7
8
61,105.00 65,375.00 638,879.00
398,
363.50
1,963,7
22.50
-0.3729%
7/31/201
7
8
59,700.00 62,000.00 640,516.50
398,
363.50
1,960,5
80.00
-0.1602%
8/1/2017 8
65,635.00 55,375.00 639,975.50
398,
363.50
1,959,3
49.00
-0.0628%
8/2/2017 8
59,845.00 59,500.00 640,841.50
398,
363.50
1,958,5
50.00
-0.0408%
8/3/2017 8
55,335.00 61,375.00 641,916.00
398,
363.50
1,956,9
89.50
-0.0797%
8/4/2017 8
62,485.00 62,125.00 639,684.50
398,
363.50
1,962,6
58.00
0.2892%
8/7/2017 8
61,800.00 56,375.00 641,215.00
398,
363.50
1,957,7
53.50
-0.2502%
11
INVESTMENT ANALYSIS AND PORTFOLIO MANAGEMENT
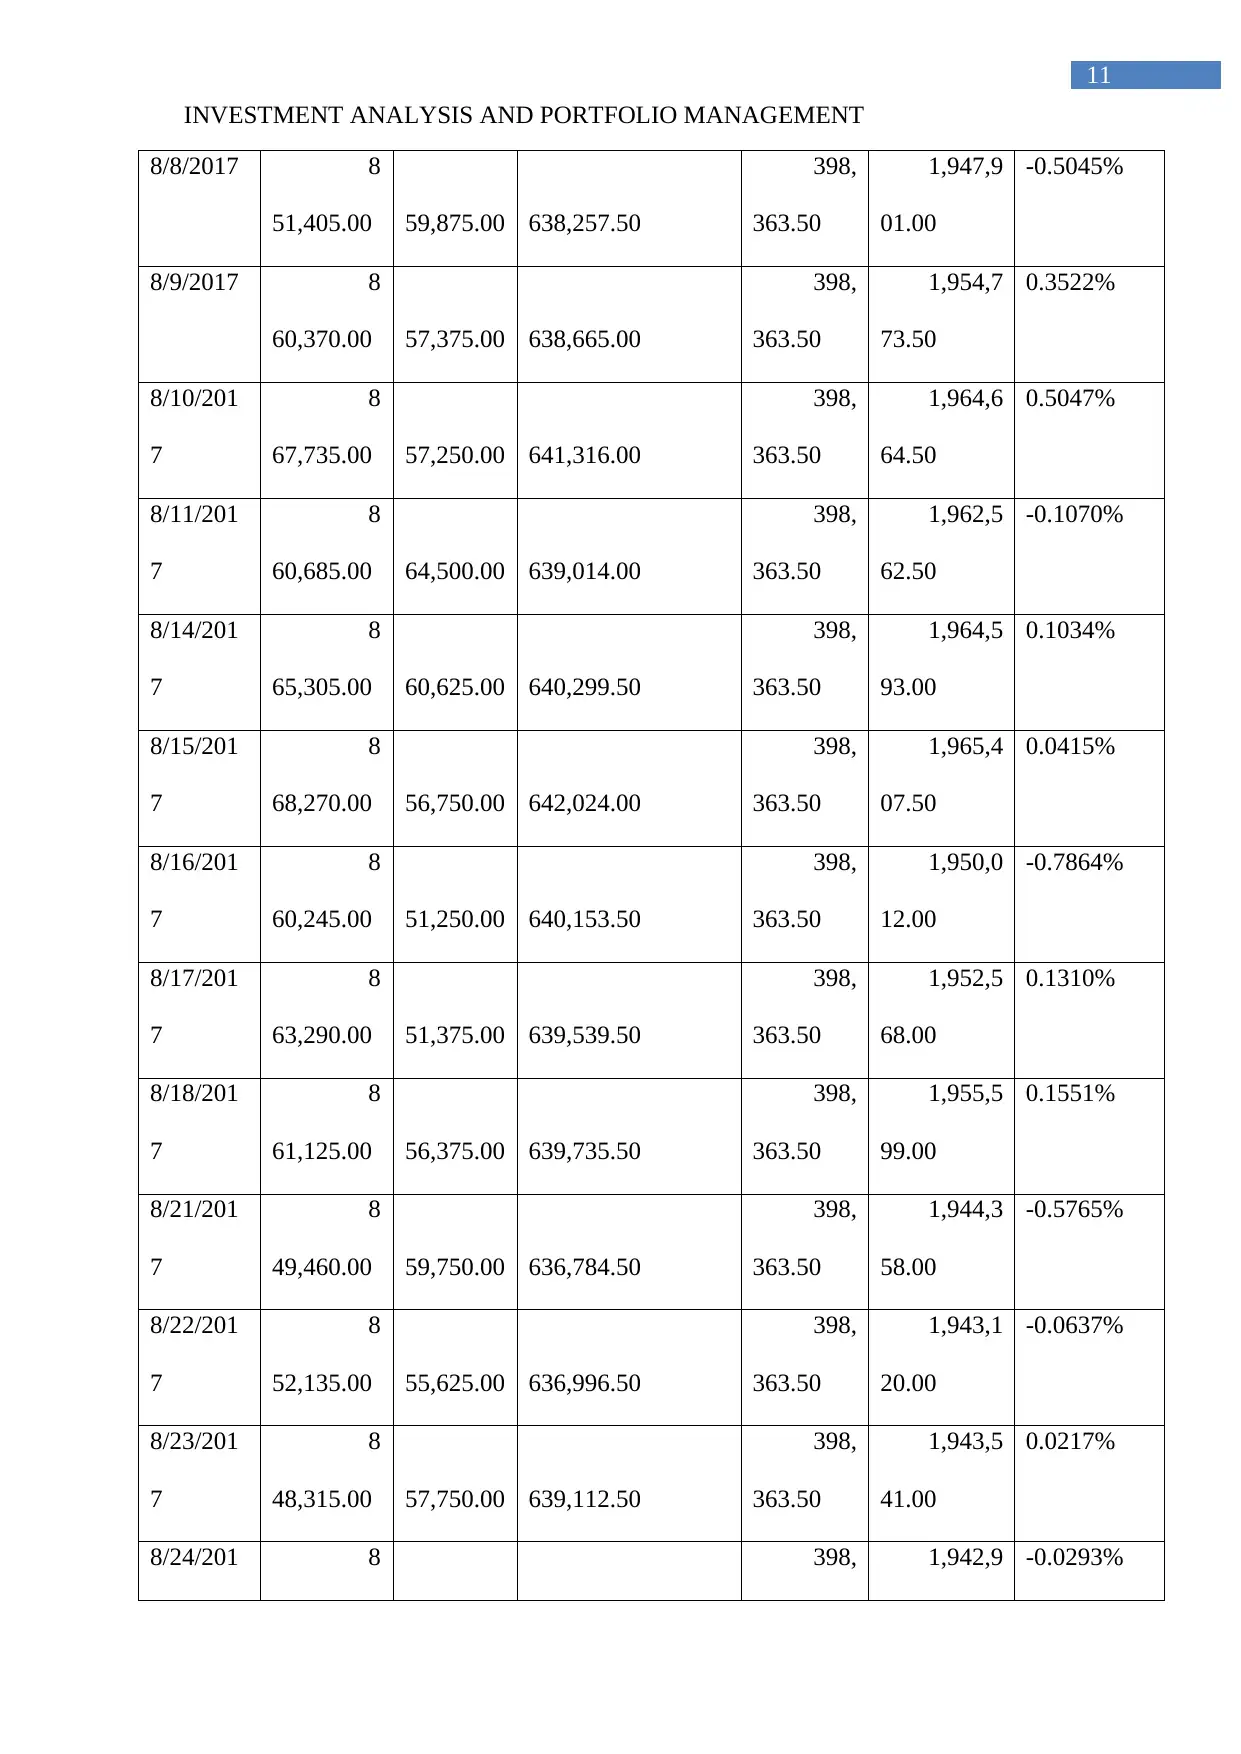
8/8/2017 8
51,405.00 59,875.00 638,257.50
398,
363.50
1,947,9
01.00
-0.5045%
8/9/2017 8
60,370.00 57,375.00 638,665.00
398,
363.50
1,954,7
73.50
0.3522%
8/10/201
7
8
67,735.00 57,250.00 641,316.00
398,
363.50
1,964,6
64.50
0.5047%
8/11/201
7
8
60,685.00 64,500.00 639,014.00
398,
363.50
1,962,5
62.50
-0.1070%
8/14/201
7
8
65,305.00 60,625.00 640,299.50
398,
363.50
1,964,5
93.00
0.1034%
8/15/201
7
8
68,270.00 56,750.00 642,024.00
398,
363.50
1,965,4
07.50
0.0415%
8/16/201
7
8
60,245.00 51,250.00 640,153.50
398,
363.50
1,950,0
12.00
-0.7864%
8/17/201
7
8
63,290.00 51,375.00 639,539.50
398,
363.50
1,952,5
68.00
0.1310%
8/18/201
7
8
61,125.00 56,375.00 639,735.50
398,
363.50
1,955,5
99.00
0.1551%
8/21/201
7
8
49,460.00 59,750.00 636,784.50
398,
363.50
1,944,3
58.00
-0.5765%
8/22/201
7
8
52,135.00 55,625.00 636,996.50
398,
363.50
1,943,1
20.00
-0.0637%
8/23/201
7
8
48,315.00 57,750.00 639,112.50
398,
363.50
1,943,5
41.00
0.0217%
8/24/201 8 398, 1,942,9 -0.0293%
INVESTMENT ANALYSIS AND PORTFOLIO MANAGEMENT
8/8/2017 8
51,405.00 59,875.00 638,257.50
398,
363.50
1,947,9
01.00
-0.5045%
8/9/2017 8
60,370.00 57,375.00 638,665.00
398,
363.50
1,954,7
73.50
0.3522%
8/10/201
7
8
67,735.00 57,250.00 641,316.00
398,
363.50
1,964,6
64.50
0.5047%
8/11/201
7
8
60,685.00 64,500.00 639,014.00
398,
363.50
1,962,5
62.50
-0.1070%
8/14/201
7
8
65,305.00 60,625.00 640,299.50
398,
363.50
1,964,5
93.00
0.1034%
8/15/201
7
8
68,270.00 56,750.00 642,024.00
398,
363.50
1,965,4
07.50
0.0415%
8/16/201
7
8
60,245.00 51,250.00 640,153.50
398,
363.50
1,950,0
12.00
-0.7864%
8/17/201
7
8
63,290.00 51,375.00 639,539.50
398,
363.50
1,952,5
68.00
0.1310%
8/18/201
7
8
61,125.00 56,375.00 639,735.50
398,
363.50
1,955,5
99.00
0.1551%
8/21/201
7
8
49,460.00 59,750.00 636,784.50
398,
363.50
1,944,3
58.00
-0.5765%
8/22/201
7
8
52,135.00 55,625.00 636,996.50
398,
363.50
1,943,1
20.00
-0.0637%
8/23/201
7
8
48,315.00 57,750.00 639,112.50
398,
363.50
1,943,5
41.00
0.0217%
8/24/201 8 398, 1,942,9 -0.0293%
⊘ This is a preview!⊘
Do you want full access?
Subscribe today to unlock all pages.
Trusted by 1+ million students worldwide
1 out of 12
Related Documents


Your All-in-One AI-Powered Toolkit for Academic Success.
+13062052269
info@desklib.com
Available 24*7 on WhatsApp / Email
![[object Object]](/_next/static/media/star-bottom.7253800d.svg)
Unlock your academic potential
Copyright © 2020–2026 A2Z Services. All Rights Reserved. Developed and managed by ZUCOL.