Investment Analysis & Portfolio Management: Five-Asset Classes
VerifiedAdded on 2023/03/31
|12
|2488
|276
Report
AI Summary
This report provides a comprehensive analysis of investment and portfolio management strategies, focusing on asset allocation, risk management, and the efficient frontier. It begins by discussing the risk and return characteristics of five asset classes using arithmetic mean, geometric mean, and standard deviation. The report then constructs an efficient portfolio, discussing the implications of the five-asset efficient frontier and the Capital Allocation Line (CAL). Finally, it provides a critical discussion of the results, explaining the appeal of the minimum variance portfolio among academics and practitioners, and highlighting the normative aspects of Modern Portfolio Theory (MPT). The analysis includes calculations of correlation and covariance matrices to optimize portfolio construction based on risk and return preferences.
Running head: INVESTMENT ANALYSIS AND PORTFOLIO MANAGEMENT
Investment Analysis and Portfolio Management
Name of the Student:
Name of the University:
Author’s Note:
Course ID:
Investment Analysis and Portfolio Management
Name of the Student:
Name of the University:
Author’s Note:
Course ID:
Paraphrase This Document
Need a fresh take? Get an instant paraphrase of this document with our AI Paraphraser
1INVESTMENT ANALYSIS AND PORTFOLIO MANAGEMENT
Table of Contents
a. Discussing about the five-asset class by using their AM, GM and standard deviation, while
providing information about the risk and return characteristics of each stock:...............................2
b. Constructing the efficient portfolio and discussing the implications of the five asset efficient
frontier and CAL:............................................................................................................................5
c. Providing an in-depth and critical discussion of the results, while indicating why minimum
variance portfolio is still liked by academics and practitioners and MPT normative:....................8
References and Bibliography:........................................................................................................10
2INVESTMENT ANALYSIS AND PORTFOLIO MANAGEMENT
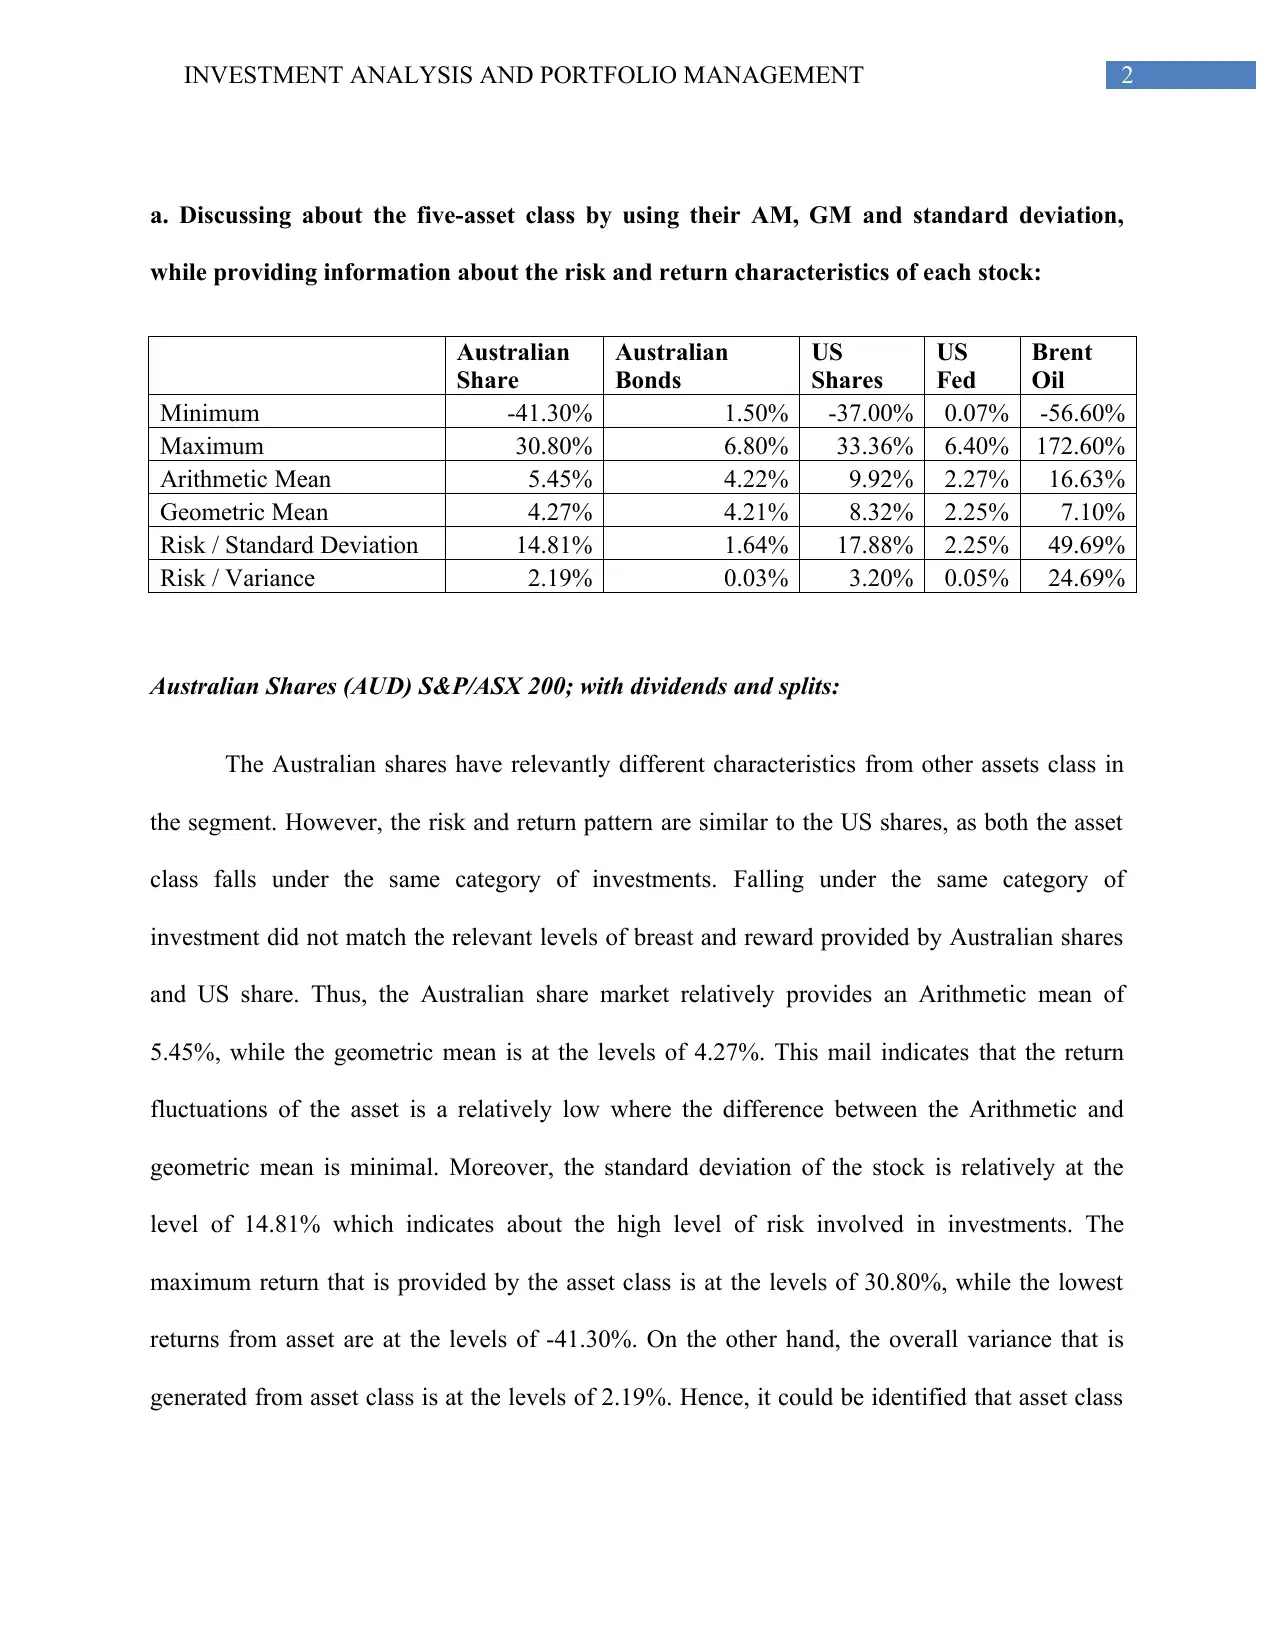
a. Discussing about the five-asset class by using their AM, GM and standard deviation,
while providing information about the risk and return characteristics of each stock:
Australian
Share
Australian
Bonds
US
Shares
US
Fed
Brent
Oil
Minimum -41.30% 1.50% -37.00% 0.07% -56.60%
Maximum 30.80% 6.80% 33.36% 6.40% 172.60%
Arithmetic Mean 5.45% 4.22% 9.92% 2.27% 16.63%
Geometric Mean 4.27% 4.21% 8.32% 2.25% 7.10%
Risk / Standard Deviation 14.81% 1.64% 17.88% 2.25% 49.69%
Risk / Variance 2.19% 0.03% 3.20% 0.05% 24.69%
Australian Shares (AUD) S&P/ASX 200; with dividends and splits:
The Australian shares have relevantly different characteristics from other assets class in
the segment. However, the risk and return pattern are similar to the US shares, as both the asset
class falls under the same category of investments. Falling under the same category of
investment did not match the relevant levels of breast and reward provided by Australian shares
and US share. Thus, the Australian share market relatively provides an Arithmetic mean of
5.45%, while the geometric mean is at the levels of 4.27%. This mail indicates that the return
fluctuations of the asset is a relatively low where the difference between the Arithmetic and
geometric mean is minimal. Moreover, the standard deviation of the stock is relatively at the
level of 14.81% which indicates about the high level of risk involved in investments. The
maximum return that is provided by the asset class is at the levels of 30.80%, while the lowest
returns from asset are at the levels of -41.30%. On the other hand, the overall variance that is
generated from asset class is at the levels of 2.19%. Hence, it could be identified that asset class
⊘ This is a preview!⊘
Do you want full access?
Subscribe today to unlock all pages.
Trusted by 1+ million students worldwide
3INVESTMENT ANALYSIS AND PORTFOLIO MANAGEMENT
falls under growth stock, where both risk and return from the investment is relevantly high
(Doeswijk, Lam & Swinkels, 2014).
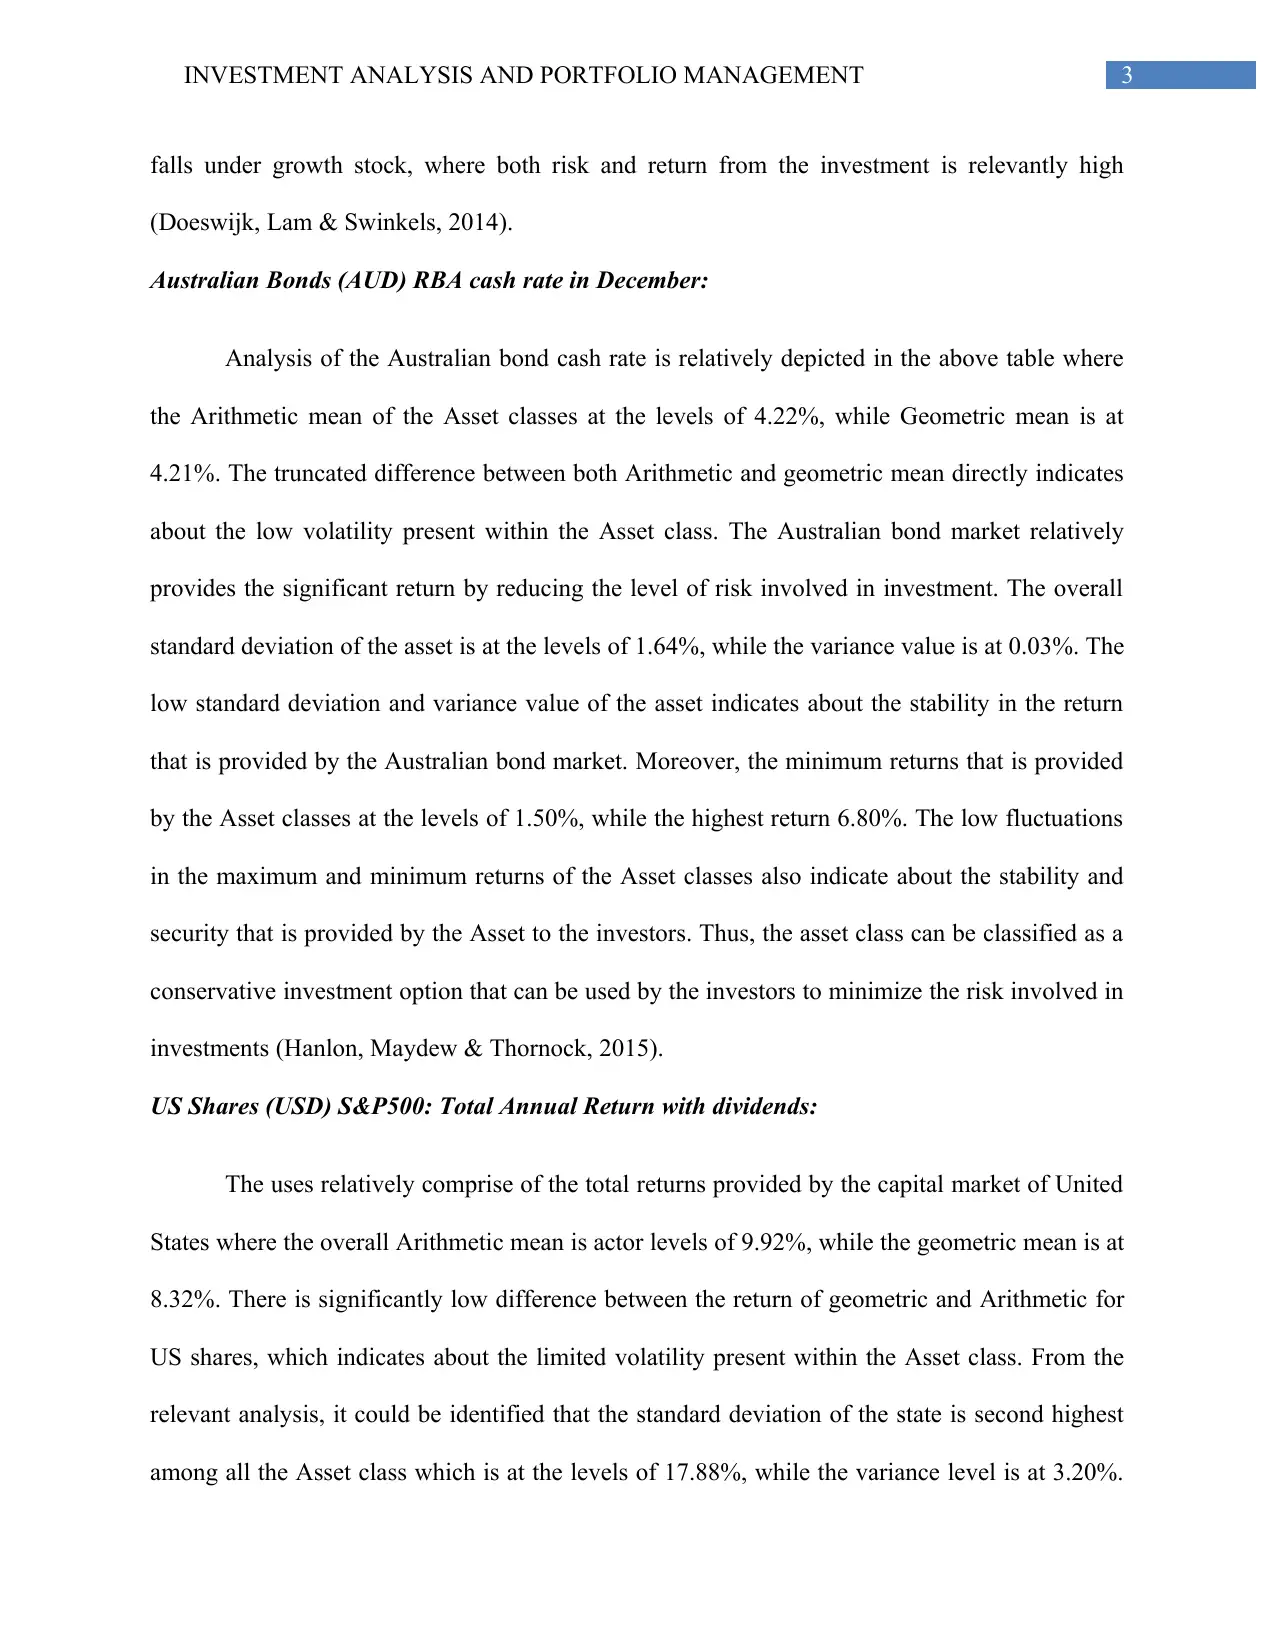
Australian Bonds (AUD) RBA cash rate in December:
Analysis of the Australian bond cash rate is relatively depicted in the above table where
the Arithmetic mean of the Asset classes at the levels of 4.22%, while Geometric mean is at
4.21%. The truncated difference between both Arithmetic and geometric mean directly indicates
about the low volatility present within the Asset class. The Australian bond market relatively
provides the significant return by reducing the level of risk involved in investment. The overall
standard deviation of the asset is at the levels of 1.64%, while the variance value is at 0.03%. The
low standard deviation and variance value of the asset indicates about the stability in the return
that is provided by the Australian bond market. Moreover, the minimum returns that is provided
by the Asset classes at the levels of 1.50%, while the highest return 6.80%. The low fluctuations
in the maximum and minimum returns of the Asset classes also indicate about the stability and
security that is provided by the Asset to the investors. Thus, the asset class can be classified as a
conservative investment option that can be used by the investors to minimize the risk involved in
investments (Hanlon, Maydew & Thornock, 2015).
US Shares (USD) S&P500: Total Annual Return with dividends:
The uses relatively comprise of the total returns provided by the capital market of United
States where the overall Arithmetic mean is actor levels of 9.92%, while the geometric mean is at
8.32%. There is significantly low difference between the return of geometric and Arithmetic for
US shares, which indicates about the limited volatility present within the Asset class. From the
relevant analysis, it could be identified that the standard deviation of the state is second highest
among all the Asset class which is at the levels of 17.88%, while the variance level is at 3.20%.
falls under growth stock, where both risk and return from the investment is relevantly high
(Doeswijk, Lam & Swinkels, 2014).
Australian Bonds (AUD) RBA cash rate in December:
Analysis of the Australian bond cash rate is relatively depicted in the above table where
the Arithmetic mean of the Asset classes at the levels of 4.22%, while Geometric mean is at
4.21%. The truncated difference between both Arithmetic and geometric mean directly indicates
about the low volatility present within the Asset class. The Australian bond market relatively
provides the significant return by reducing the level of risk involved in investment. The overall
standard deviation of the asset is at the levels of 1.64%, while the variance value is at 0.03%. The
low standard deviation and variance value of the asset indicates about the stability in the return
that is provided by the Australian bond market. Moreover, the minimum returns that is provided
by the Asset classes at the levels of 1.50%, while the highest return 6.80%. The low fluctuations
in the maximum and minimum returns of the Asset classes also indicate about the stability and
security that is provided by the Asset to the investors. Thus, the asset class can be classified as a
conservative investment option that can be used by the investors to minimize the risk involved in
investments (Hanlon, Maydew & Thornock, 2015).
US Shares (USD) S&P500: Total Annual Return with dividends:
The uses relatively comprise of the total returns provided by the capital market of United
States where the overall Arithmetic mean is actor levels of 9.92%, while the geometric mean is at
8.32%. There is significantly low difference between the return of geometric and Arithmetic for
US shares, which indicates about the limited volatility present within the Asset class. From the
relevant analysis, it could be identified that the standard deviation of the state is second highest
among all the Asset class which is at the levels of 17.88%, while the variance level is at 3.20%.
Paraphrase This Document
Need a fresh take? Get an instant paraphrase of this document with our AI Paraphraser
4INVESTMENT ANALYSIS AND PORTFOLIO MANAGEMENT
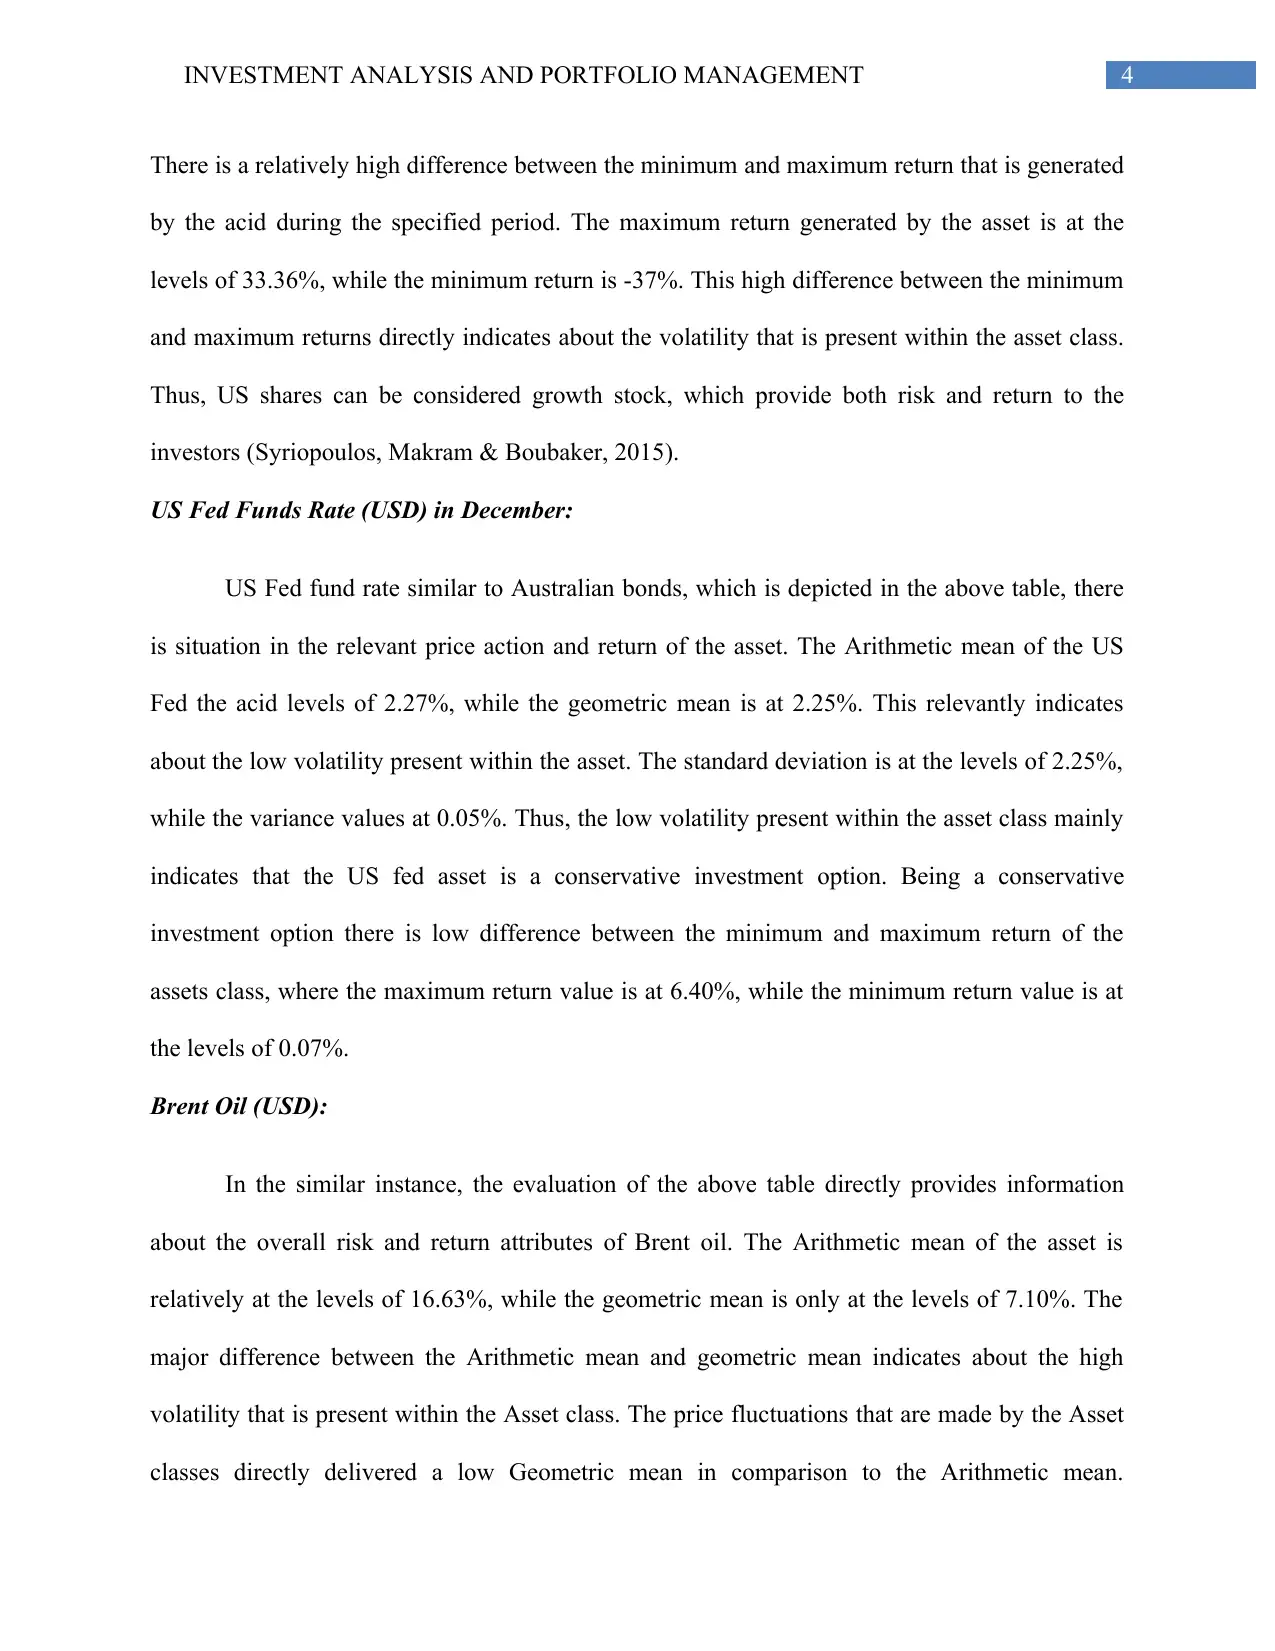
There is a relatively high difference between the minimum and maximum return that is generated
by the acid during the specified period. The maximum return generated by the asset is at the
levels of 33.36%, while the minimum return is -37%. This high difference between the minimum
and maximum returns directly indicates about the volatility that is present within the asset class.
Thus, US shares can be considered growth stock, which provide both risk and return to the
investors (Syriopoulos, Makram & Boubaker, 2015).
US Fed Funds Rate (USD) in December:
US Fed fund rate similar to Australian bonds, which is depicted in the above table, there
is situation in the relevant price action and return of the asset. The Arithmetic mean of the US
Fed the acid levels of 2.27%, while the geometric mean is at 2.25%. This relevantly indicates
about the low volatility present within the asset. The standard deviation is at the levels of 2.25%,
while the variance values at 0.05%. Thus, the low volatility present within the asset class mainly
indicates that the US fed asset is a conservative investment option. Being a conservative
investment option there is low difference between the minimum and maximum return of the
assets class, where the maximum return value is at 6.40%, while the minimum return value is at
the levels of 0.07%.
Brent Oil (USD):
In the similar instance, the evaluation of the above table directly provides information
about the overall risk and return attributes of Brent oil. The Arithmetic mean of the asset is
relatively at the levels of 16.63%, while the geometric mean is only at the levels of 7.10%. The
major difference between the Arithmetic mean and geometric mean indicates about the high
volatility that is present within the Asset class. The price fluctuations that are made by the Asset
classes directly delivered a low Geometric mean in comparison to the Arithmetic mean.
5INVESTMENT ANALYSIS AND PORTFOLIO MANAGEMENT
Moreover, the standard deviation of the asset is a relatively at the levels of 49.69%, while the
variance value is 24.69%. The high level of values in both standard deviation and variance
directly in the case about the overall risk attribute of the asset, which is high in nature. Thus, the
Asset class can be considered a high risk investment option, which comprise of high level of risk
and reward ratio. The maximum return that is provided by the acid is added levels of 172.60%,
while the minimum value of returns is -56.60%. The high difference between the maximum and
minimum value of returns provided by the Asset directly indicates about the level of alteration
that is present within the return generation capability of the Asset. The fluctuations in the returns
are relatively high where the Asset can provide high and low levels of returns to the investors
(Briere, Oosterlinck & Szafarz, 2015).
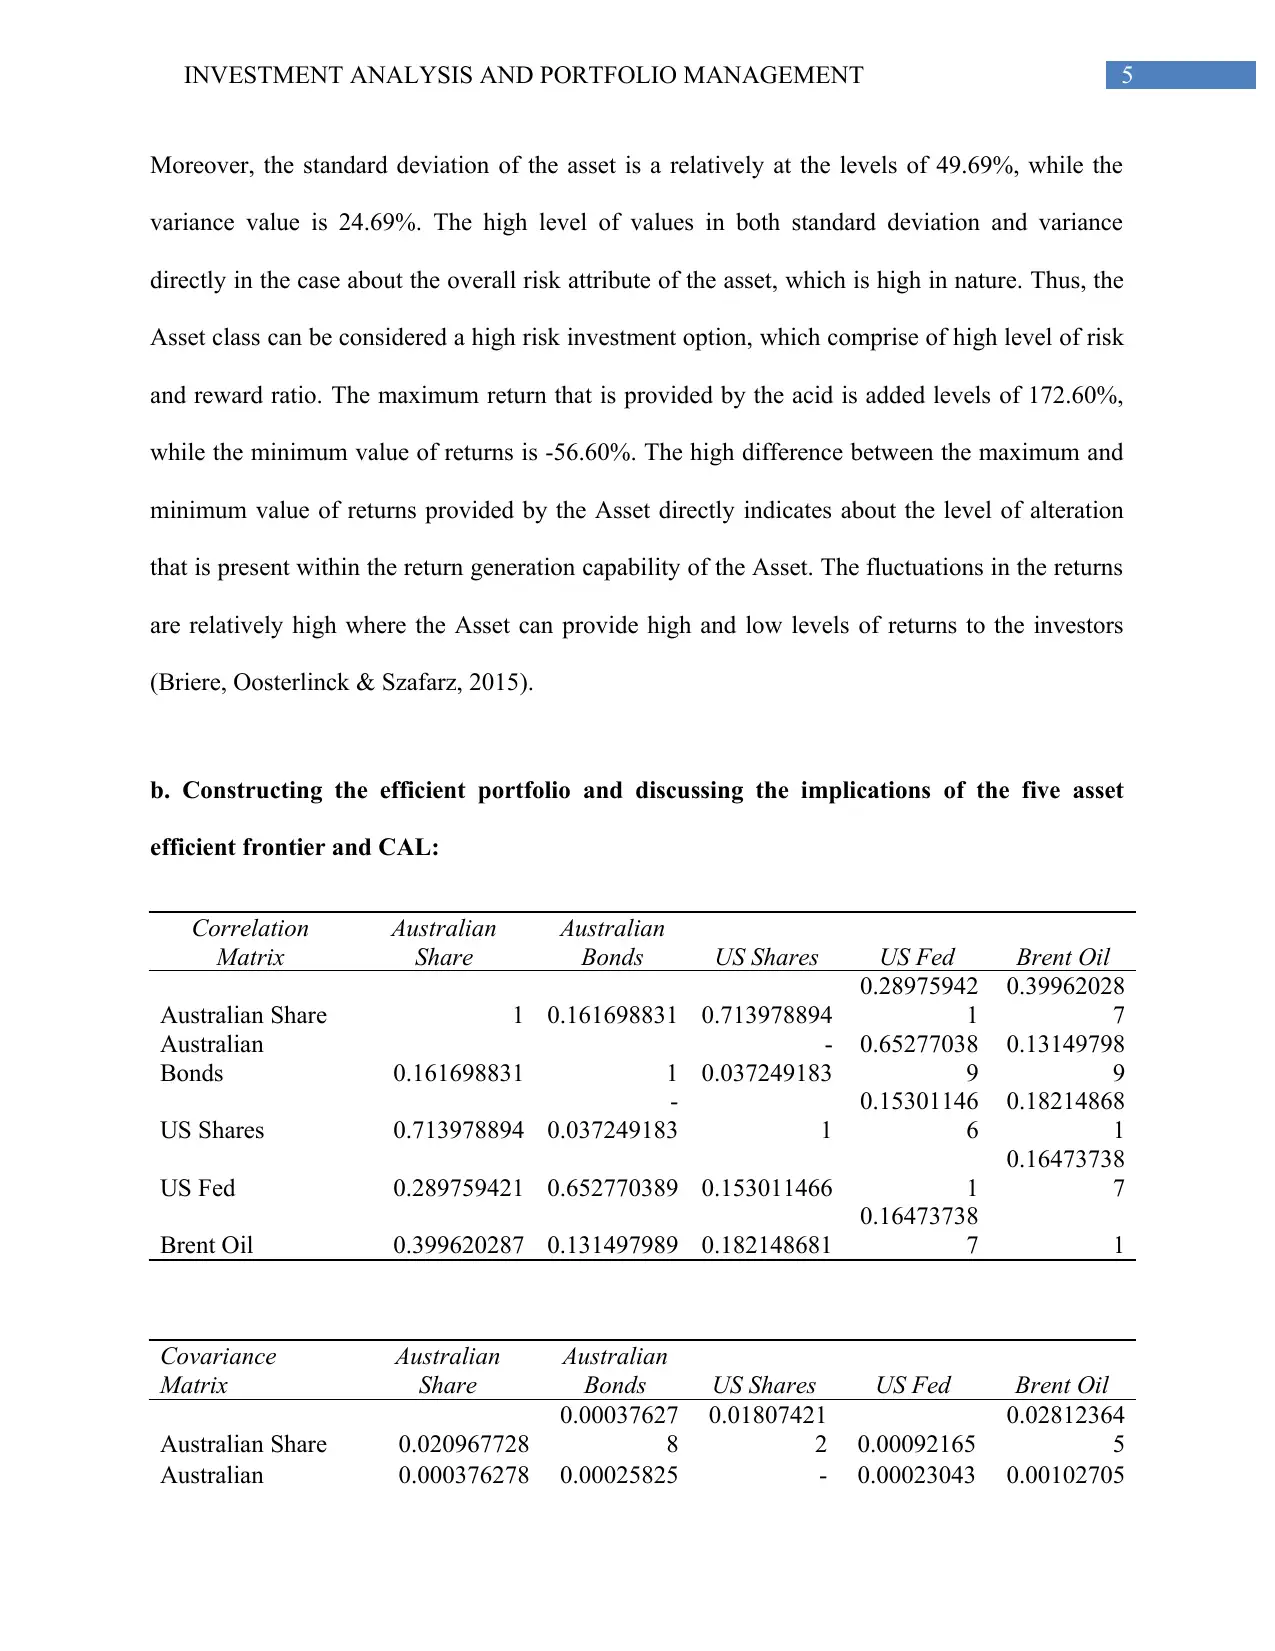
b. Constructing the efficient portfolio and discussing the implications of the five asset
efficient frontier and CAL:
Correlation
Matrix
Australian
Share
Australian
Bonds US Shares US Fed Brent Oil
Australian Share 1 0.161698831 0.713978894
0.28975942
1
0.39962028
7
Australian
Bonds 0.161698831 1
-
0.037249183
0.65277038
9
0.13149798
9
US Shares 0.713978894
-
0.037249183 1
0.15301146
6
0.18214868
1
US Fed 0.289759421 0.652770389 0.153011466 1
0.16473738
7
Brent Oil 0.399620287 0.131497989 0.182148681
0.16473738
7 1
Covariance
Matrix
Australian
Share
Australian
Bonds US Shares US Fed Brent Oil
Australian Share 0.020967728
0.00037627
8
0.01807421
2 0.00092165
0.02812364
5
Australian 0.000376278 0.00025825 - 0.00023043 0.00102705
Moreover, the standard deviation of the asset is a relatively at the levels of 49.69%, while the
variance value is 24.69%. The high level of values in both standard deviation and variance
directly in the case about the overall risk attribute of the asset, which is high in nature. Thus, the
Asset class can be considered a high risk investment option, which comprise of high level of risk
and reward ratio. The maximum return that is provided by the acid is added levels of 172.60%,
while the minimum value of returns is -56.60%. The high difference between the maximum and
minimum value of returns provided by the Asset directly indicates about the level of alteration
that is present within the return generation capability of the Asset. The fluctuations in the returns
are relatively high where the Asset can provide high and low levels of returns to the investors
(Briere, Oosterlinck & Szafarz, 2015).
b. Constructing the efficient portfolio and discussing the implications of the five asset
efficient frontier and CAL:
Correlation
Matrix
Australian
Share
Australian
Bonds US Shares US Fed Brent Oil
Australian Share 1 0.161698831 0.713978894
0.28975942
1
0.39962028
7
Australian
Bonds 0.161698831 1
-
0.037249183
0.65277038
9
0.13149798
9
US Shares 0.713978894
-
0.037249183 1
0.15301146
6
0.18214868
1
US Fed 0.289759421 0.652770389 0.153011466 1
0.16473738
7
Brent Oil 0.399620287 0.131497989 0.182148681
0.16473738
7 1
Covariance
Matrix
Australian
Share
Australian
Bonds US Shares US Fed Brent Oil
Australian Share 0.020967728
0.00037627
8
0.01807421
2 0.00092165
0.02812364
5
Australian 0.000376278 0.00025825 - 0.00023043 0.00102705
⊘ This is a preview!⊘
Do you want full access?
Subscribe today to unlock all pages.
Trusted by 1+ million students worldwide
6INVESTMENT ANALYSIS AND PORTFOLIO MANAGEMENT
Bonds 7 0.00010465 5
US Shares 0.018074212
-
0.00010465
0.03056304
5
0.00058759
1
0.01547649
9
US Fed 0.00092165 0.00023043
0.00058759
1
0.00048250
9
0.00175870
5
Brent Oil 0.028123645
0.00102705
5
0.01547649
9
0.00175870
5
0.23620918
3
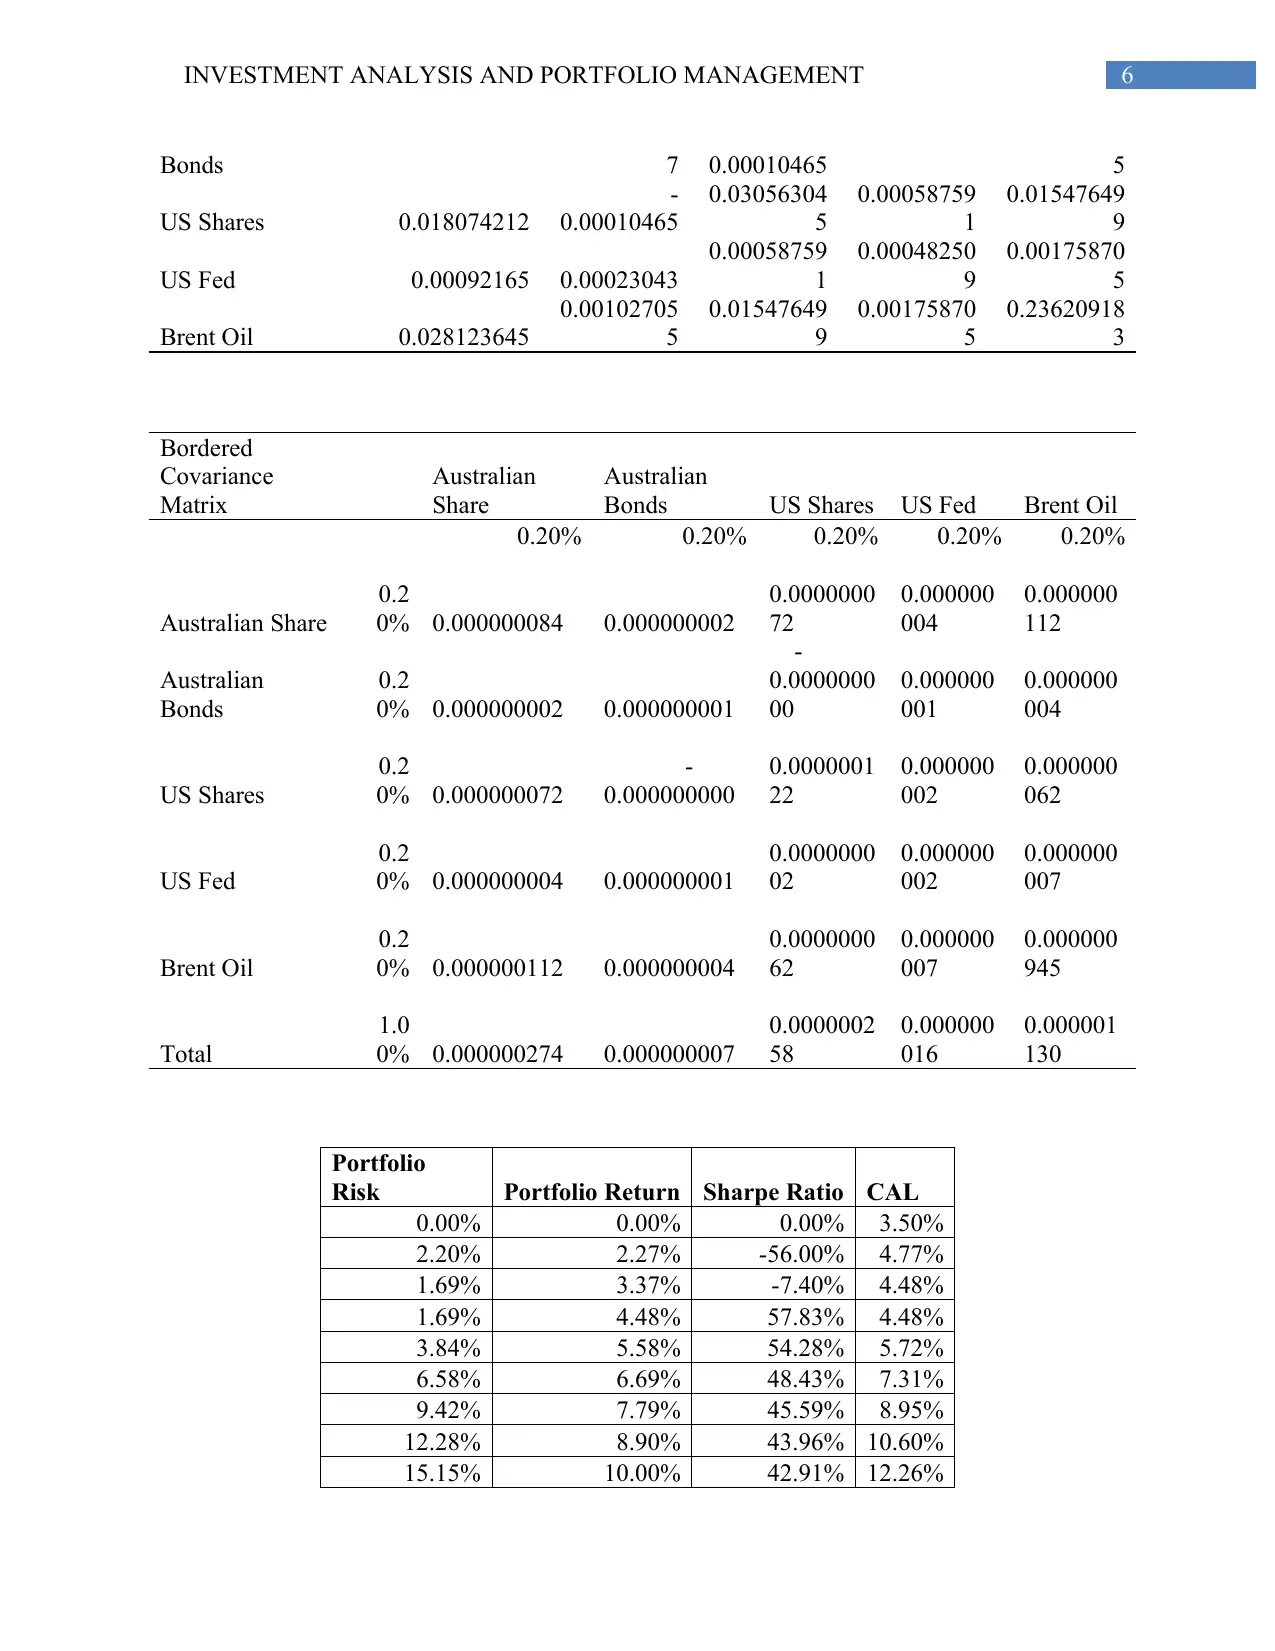
Bordered
Covariance
Matrix
Australian
Share
Australian
Bonds US Shares US Fed Brent Oil
0.20% 0.20% 0.20% 0.20% 0.20%
Australian Share
0.2
0% 0.000000084 0.000000002
0.0000000
72
0.000000
004
0.000000
112
Australian
Bonds
0.2
0% 0.000000002 0.000000001
-
0.0000000
00
0.000000
001
0.000000
004
US Shares
0.2
0% 0.000000072
-
0.000000000
0.0000001
22
0.000000
002
0.000000
062
US Fed
0.2
0% 0.000000004 0.000000001
0.0000000
02
0.000000
002
0.000000
007
Brent Oil
0.2
0% 0.000000112 0.000000004
0.0000000
62
0.000000
007
0.000000
945
Total
1.0
0% 0.000000274 0.000000007
0.0000002
58
0.000000
016
0.000001
130
Portfolio
Risk Portfolio Return Sharpe Ratio CAL
0.00% 0.00% 0.00% 3.50%
2.20% 2.27% -56.00% 4.77%
1.69% 3.37% -7.40% 4.48%
1.69% 4.48% 57.83% 4.48%
3.84% 5.58% 54.28% 5.72%
6.58% 6.69% 48.43% 7.31%
9.42% 7.79% 45.59% 8.95%
12.28% 8.90% 43.96% 10.60%
15.15% 10.00% 42.91% 12.26%
Bonds 7 0.00010465 5
US Shares 0.018074212
-
0.00010465
0.03056304
5
0.00058759
1
0.01547649
9
US Fed 0.00092165 0.00023043
0.00058759
1
0.00048250
9
0.00175870
5
Brent Oil 0.028123645
0.00102705
5
0.01547649
9
0.00175870
5
0.23620918
3
Bordered
Covariance
Matrix
Australian
Share
Australian
Bonds US Shares US Fed Brent Oil
0.20% 0.20% 0.20% 0.20% 0.20%
Australian Share
0.2
0% 0.000000084 0.000000002
0.0000000
72
0.000000
004
0.000000
112
Australian
Bonds
0.2
0% 0.000000002 0.000000001
-
0.0000000
00
0.000000
001
0.000000
004
US Shares
0.2
0% 0.000000072
-
0.000000000
0.0000001
22
0.000000
002
0.000000
062
US Fed
0.2
0% 0.000000004 0.000000001
0.0000000
02
0.000000
002
0.000000
007
Brent Oil
0.2
0% 0.000000112 0.000000004
0.0000000
62
0.000000
007
0.000000
945
Total
1.0
0% 0.000000274 0.000000007
0.0000002
58
0.000000
016
0.000001
130
Portfolio
Risk Portfolio Return Sharpe Ratio CAL
0.00% 0.00% 0.00% 3.50%
2.20% 2.27% -56.00% 4.77%
1.69% 3.37% -7.40% 4.48%
1.69% 4.48% 57.83% 4.48%
3.84% 5.58% 54.28% 5.72%
6.58% 6.69% 48.43% 7.31%
9.42% 7.79% 45.59% 8.95%
12.28% 8.90% 43.96% 10.60%
15.15% 10.00% 42.91% 12.26%
Paraphrase This Document
Need a fresh take? Get an instant paraphrase of this document with our AI Paraphraser
7INVESTMENT ANALYSIS AND PORTFOLIO MANAGEMENT
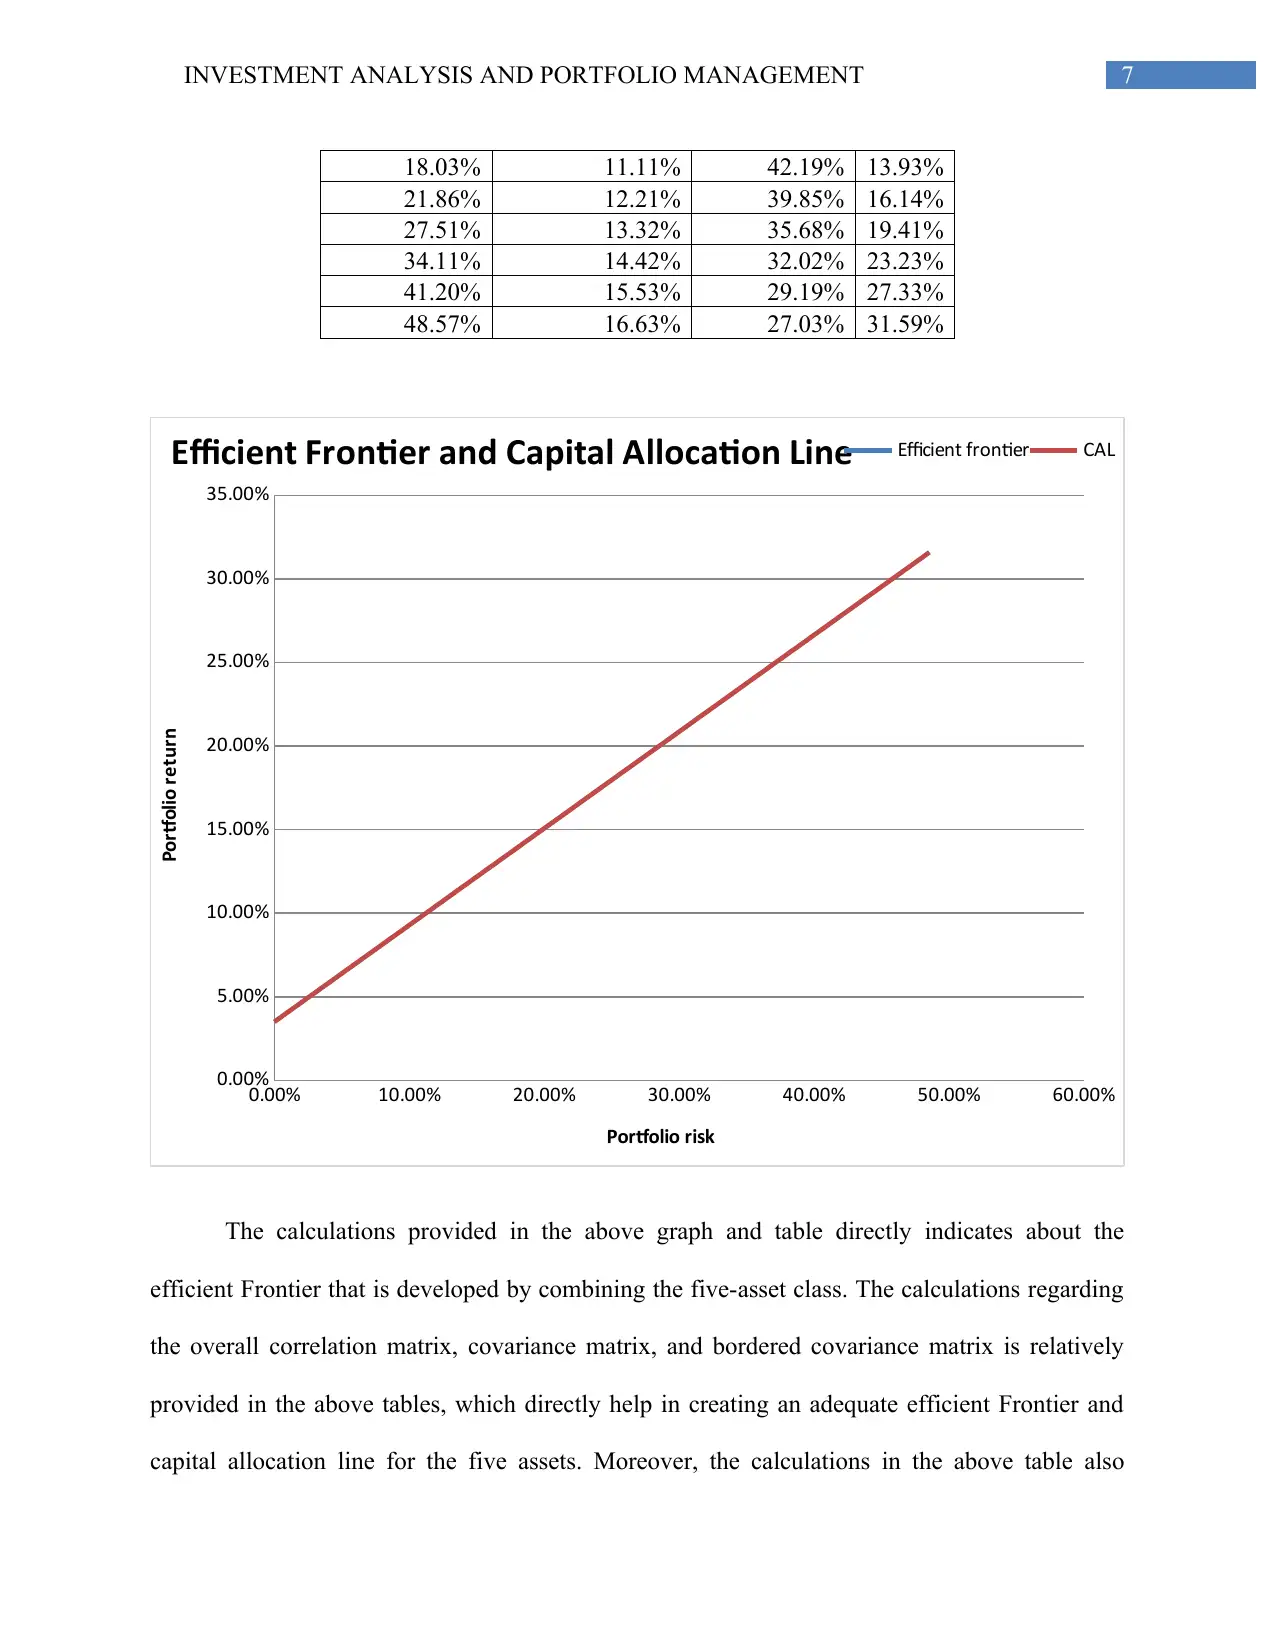
18.03% 11.11% 42.19% 13.93%
21.86% 12.21% 39.85% 16.14%
27.51% 13.32% 35.68% 19.41%
34.11% 14.42% 32.02% 23.23%
41.20% 15.53% 29.19% 27.33%
48.57% 16.63% 27.03% 31.59%
0.00% 10.00% 20.00% 30.00% 40.00% 50.00% 60.00%
0.00%
5.00%
10.00%
15.00%
20.00%
25.00%
30.00%
35.00%
Efficient Frontier and Capital Allocation Line Efficient frontier CAL
Portfolio risk
Portfolio return
The calculations provided in the above graph and table directly indicates about the
efficient Frontier that is developed by combining the five-asset class. The calculations regarding
the overall correlation matrix, covariance matrix, and bordered covariance matrix is relatively
provided in the above tables, which directly help in creating an adequate efficient Frontier and
capital allocation line for the five assets. Moreover, the calculations in the above table also
8INVESTMENT ANALYSIS AND PORTFOLIO MANAGEMENT
provide information about the portfolio risk, portfolio Returns, Sharpe ratio, and CAL, which has
been used for creating the graph of the efficient Frontier. From the relevant valuation it can be
identified that the overall efficient market hypothesis has been calculated on the basis of the
above data. Therefore, the relevant risk that is involved in investment relatively increases with
the increment in returns. Therefore, it could be understood that the investors demanding higher
returns will have to engage in high risk portfolio. Santacruz (2016) indicted that Efficient
Frontier provides information about the relevant weights and investments options that need to be
conducted by investors in certain assets to maximize the level of returns, while reducing the risk
attributes.
The above efficient Frontier directly indicates about the overall risk and return attributes
of the asset classes utilized in the investments. Therefore a minimum variance portfolio can also
be determined with the efficient Frontier where the investments will hold a total risk of 1.69%,
while the returns will be at the levels of 4.48%. Thus, the efficient frontier provides adequate
information about the overall risk and return attributes of the portfolio consisting of the 5-assets.
Hence, investments can be conducted in accordance with the risk and return attributes of the
investors.
c. Providing an in-depth and critical discussion of the results, while indicating why
minimum variance portfolio is still liked by academics and practitioners and MPT
normative:
Minimum variance
portfolio Value
Portfolio Risk 1.69%
Portfolio Return 4.48%
⊘ This is a preview!⊘
Do you want full access?
Subscribe today to unlock all pages.
Trusted by 1+ million students worldwide
9INVESTMENT ANALYSIS AND PORTFOLIO MANAGEMENT
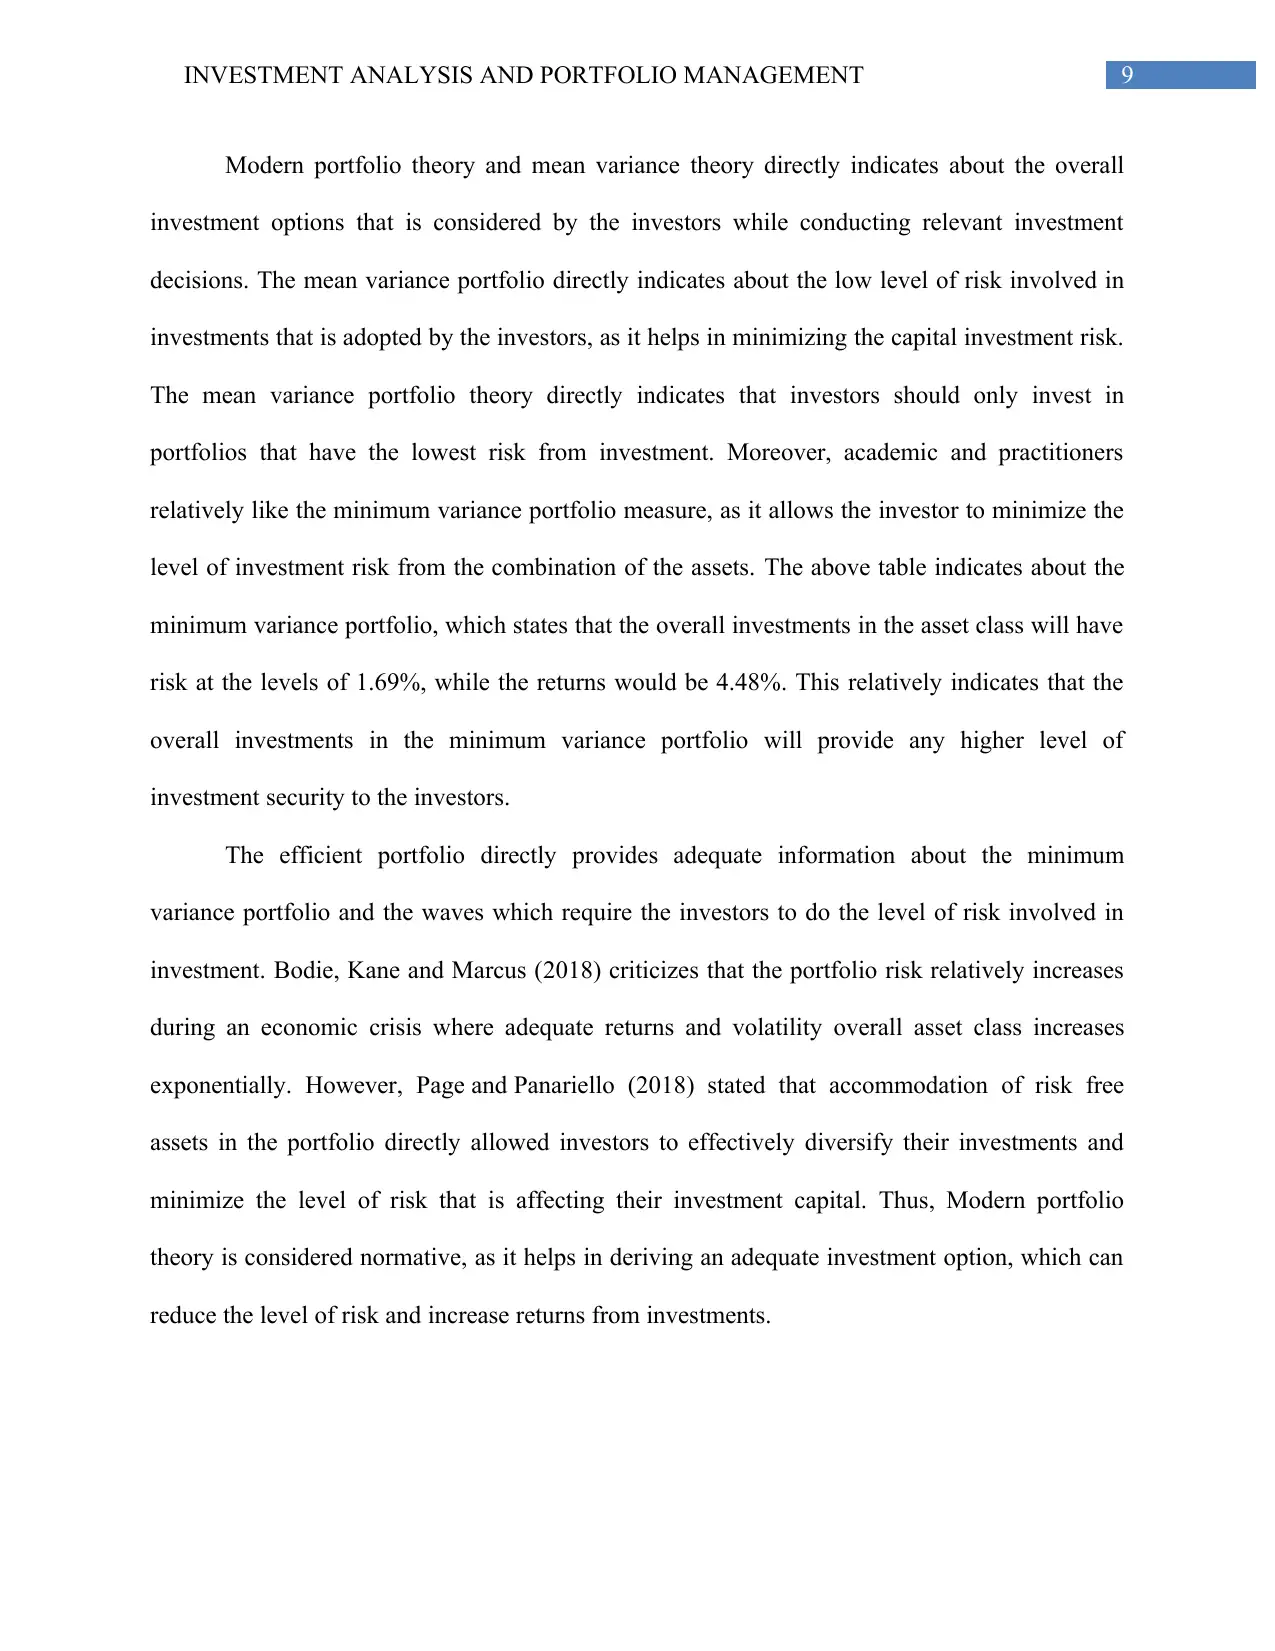
Modern portfolio theory and mean variance theory directly indicates about the overall
investment options that is considered by the investors while conducting relevant investment
decisions. The mean variance portfolio directly indicates about the low level of risk involved in
investments that is adopted by the investors, as it helps in minimizing the capital investment risk.
The mean variance portfolio theory directly indicates that investors should only invest in
portfolios that have the lowest risk from investment. Moreover, academic and practitioners
relatively like the minimum variance portfolio measure, as it allows the investor to minimize the
level of investment risk from the combination of the assets. The above table indicates about the
minimum variance portfolio, which states that the overall investments in the asset class will have
risk at the levels of 1.69%, while the returns would be 4.48%. This relatively indicates that the
overall investments in the minimum variance portfolio will provide any higher level of
investment security to the investors.
The efficient portfolio directly provides adequate information about the minimum
variance portfolio and the waves which require the investors to do the level of risk involved in
investment. Bodie, Kane and Marcus (2018) criticizes that the portfolio risk relatively increases
during an economic crisis where adequate returns and volatility overall asset class increases
exponentially. However, Page and Panariello (2018) stated that accommodation of risk free
assets in the portfolio directly allowed investors to effectively diversify their investments and
minimize the level of risk that is affecting their investment capital. Thus, Modern portfolio
theory is considered normative, as it helps in deriving an adequate investment option, which can
reduce the level of risk and increase returns from investments.
Paraphrase This Document
Need a fresh take? Get an instant paraphrase of this document with our AI Paraphraser
10INVESTMENT ANALYSIS AND PORTFOLIO MANAGEMENT
References and Bibliography:
Bodie, Z, Kane A & Marcus, AJ 2018, Investments, 11th edn, McGraw-Hill Education
Brandstetter, L., & Lehner, O. M. 2015. Opening the market for impact investments: The need
for adapted portfolio tools. Entrepreneurship Research Journal, 5(2), 87-107.
Briere, M., Oosterlinck, K., & Szafarz, A. 2015. Virtual currency, tangible return: Portfolio
diversification with bitcoin. Journal of Asset Management, 16(6), 365-373.
Chandra, P. 2017. Investment analysis and portfolio management. McGraw-Hill Education.
DeFusco, R. A., McLeavey, D. W., Pinto, J. E., Anson, M. J., & Runkle, D. E.
2015. Quantitative investment analysis. John Wiley & Sons.
Doeswijk, R., Lam, T., & Swinkels, L. 2014. The global multi-asset market portfolio, 1959–
2012. Financial Analysts Journal, 70(2), 26-41.
Guidi, F., & Ugur, M. 2014. An analysis of South-Eastern European stock markets: Evidence on
cointegration and portfolio diversification benefits. Journal of International Financial Markets,
Institutions and Money, 30, 119-136.
Hammoudeh, S., Nguyen, D. K., Reboredo, J. C., & Wen, X. 2014. Dependence of stock and
commodity futures markets in China: Implications for portfolio investment. Emerging Markets
Review, 21, 183-200.
11INVESTMENT ANALYSIS AND PORTFOLIO MANAGEMENT
Hanlon, M., Maydew, E. L., & Thornock, J. R. 2015. Taking the long way home: US tax evasion
and offshore investments in US equity and debt markets. The Journal of Finance, 70(1), 257-
287.
Hoesli, M., & MacGregor, B. D. 2014. Property investment: principles and practice of portfolio
management. Routledge.
Jordan, B. D., Miller, T. W., & Dolvin, S. D. 2015. Fundamentals of investments: valuation and
management. McGraw-Hill Education.
McKay, S, Shaoiro, R & Thomas, R. 2018, ‘What free lunch? The costs of
overdiversification’, Financial Analysts Journal, vol. 74, no. 1, pp. 44-57.
Page, S & Panariello, RA 2018, ‘When diversification fails’, Financial Analysts Journal, vol. 74,
no. 3, pp. 19-32.
Santacruz, L 2016, ‘Asset allocation theory and practice in Australian investment
management’, The Journal of Wealth Management, vol. 19, no. 2, pp. 47-67.
Syriopoulos, T., Makram, B., & Boubaker, A. 2015. Stock market volatility spillovers and
portfolio hedging: BRICS and the financial crisis. International Review of Financial
Analysis, 39, 7-18.
⊘ This is a preview!⊘
Do you want full access?
Subscribe today to unlock all pages.
Trusted by 1+ million students worldwide
1 out of 12
Related Documents


Your All-in-One AI-Powered Toolkit for Academic Success.
+13062052269
info@desklib.com
Available 24*7 on WhatsApp / Email
![[object Object]](/_next/static/media/star-bottom.7253800d.svg)
Unlock your academic potential
Copyright © 2020–2026 A2Z Services. All Rights Reserved. Developed and managed by ZUCOL.