Investment Analysis and Portfolio Management Project - Finance Course
VerifiedAdded on 2022/08/24
|12
|3034
|17
Project
AI Summary
This project analyzes investment strategies and portfolio management techniques using historical stock data. The analysis includes calculating annualized returns, standard deviations, and correlations for two selected companies over a five-year period. The project constructs an investment opportunity set and an efficient frontier to identify optimal portfolios based on risk and return. It also explores the concept of a minimum variance portfolio and the application of diversification to mitigate investment risk. The analysis involves calculating Sharpe ratios to evaluate portfolio performance and demonstrates how diversification can stabilize returns and reduce overall risk. The project highlights the importance of understanding risk-return trade-offs and the benefits of portfolio diversification in achieving long-term financial goals. The project uses investment proportions for the two stocks ranging from 0% to 100% using intervals of 5% and plots the investment opportunity set.
Running head: INVESTMENT ANALYSIS AND PORTFOLIO MANAGEMENT
Investment Analysis and Portfolio Management
Name of the Student:
Name of the University:
Author’s Note:
Investment Analysis and Portfolio Management
Name of the Student:
Name of the University:
Author’s Note:
Paraphrase This Document
Need a fresh take? Get an instant paraphrase of this document with our AI Paraphraser
1INVESTMENT MANAGEMENT AND PORTFOLIO MANAGEMENT
Table of Contents
Introduction......................................................................................................................................2
Discussion and Analysis..................................................................................................................2
Historical Data.............................................................................................................................2
Investment Opportunity Set.........................................................................................................3
Efficient Frontier.........................................................................................................................5
Minimum Variance Portfolio.......................................................................................................7
Diversification in Portfolio..........................................................................................................8
Conclusion.......................................................................................................................................9
References......................................................................................................................................11
2INVESTMENT MANAGEMENT AND PORTFOLIO MANAGEMENT
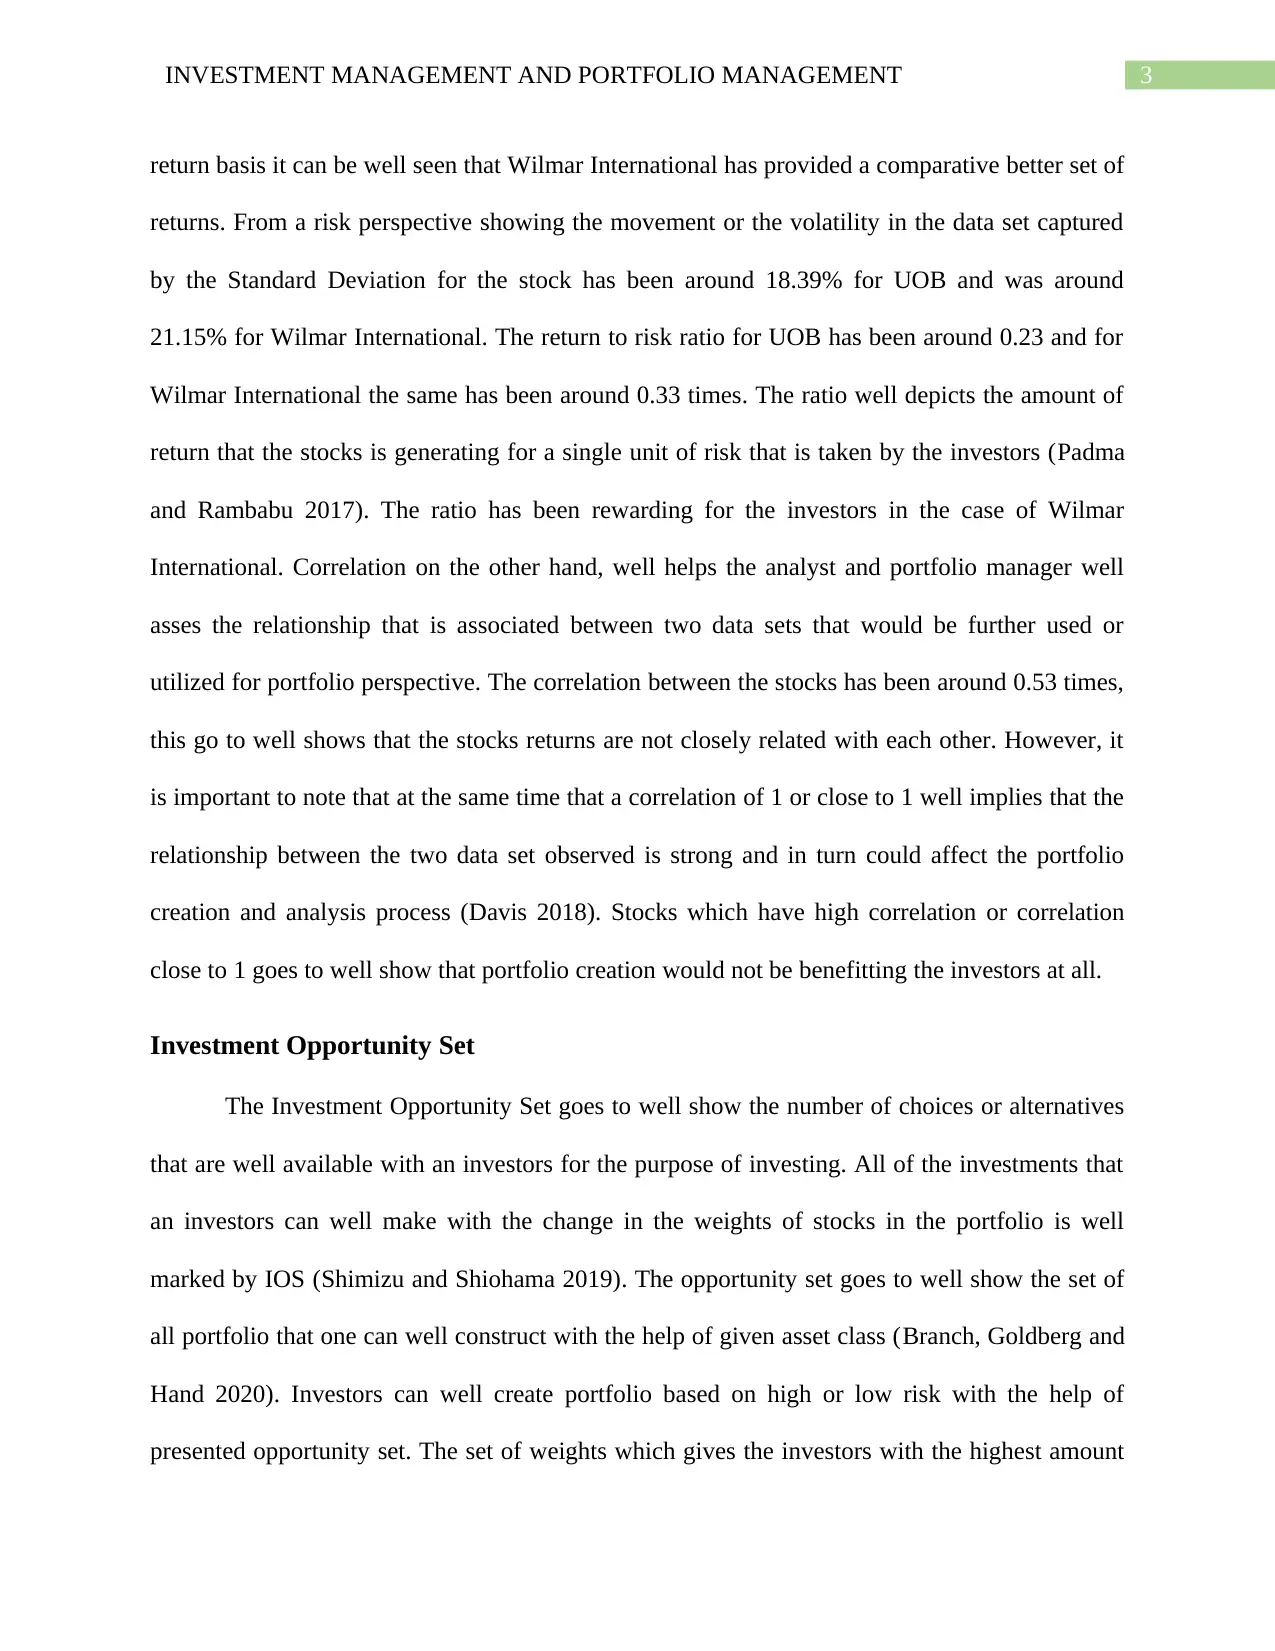
Introduction
The financial analysis of the stock prices of the company has been well done for the
purpose of well analyzing the stock returns that have been generated by the company. The
companies have been well analyzed for a sum of five years in which the changes have been well
kept into consideration with respect to the price trend observed. The analysis of the stocks has
been done from a portfolio perspective in which we have analyzed the appropriate weights that
should be ideal for the stocks for the purpose of investment. Risk and Return are the key
important characteristics of an investment and the same has been well analyzed based on the
given set of criteria for the portfolio designed. The application of diversification has been well
discussed from the application of portfolio management and how the same can well result in the
reduction of the overall risk that is associated with a portfolio (Benedetti et al., 2019).
Discussion and Analysis
Historical Data
The stock price of different companies have been well selected for a sum of five years
whereby monthly changes have been well recorded down. The monthly closing prices has been
well considered for a sum of five years in which both the company average monthly return as
well as annual return has been calculated. In order to view and analyze the risk associated with
the same the Standard deviation for both the stocks were analyzed on a monthly and annual
basis. The data for both the stock prices have been well considered from a period of January
2015 to December 2019 (Tu et al., 2019). The annualized mean return for UOB was calculated to
be around 3.58% and for Wilmar International it was calculated to be around 5.90%. From a
⊘ This is a preview!⊘
Do you want full access?
Subscribe today to unlock all pages.
Trusted by 1+ million students worldwide
3INVESTMENT MANAGEMENT AND PORTFOLIO MANAGEMENT
return basis it can be well seen that Wilmar International has provided a comparative better set of
returns. From a risk perspective showing the movement or the volatility in the data set captured
by the Standard Deviation for the stock has been around 18.39% for UOB and was around
21.15% for Wilmar International. The return to risk ratio for UOB has been around 0.23 and for
Wilmar International the same has been around 0.33 times. The ratio well depicts the amount of
return that the stocks is generating for a single unit of risk that is taken by the investors (Padma
and Rambabu 2017). The ratio has been rewarding for the investors in the case of Wilmar
International. Correlation on the other hand, well helps the analyst and portfolio manager well
asses the relationship that is associated between two data sets that would be further used or
utilized for portfolio perspective. The correlation between the stocks has been around 0.53 times,
this go to well shows that the stocks returns are not closely related with each other. However, it
is important to note that at the same time that a correlation of 1 or close to 1 well implies that the
relationship between the two data set observed is strong and in turn could affect the portfolio
creation and analysis process (Davis 2018). Stocks which have high correlation or correlation
close to 1 goes to well show that portfolio creation would not be benefitting the investors at all.
Investment Opportunity Set
The Investment Opportunity Set goes to well show the number of choices or alternatives
that are well available with an investors for the purpose of investing. All of the investments that
an investors can well make with the change in the weights of stocks in the portfolio is well
marked by IOS (Shimizu and Shiohama 2019). The opportunity set goes to well show the set of
all portfolio that one can well construct with the help of given asset class (Branch, Goldberg and
Hand 2020). Investors can well create portfolio based on high or low risk with the help of
presented opportunity set. The set of weights which gives the investors with the highest amount
Paraphrase This Document
Need a fresh take? Get an instant paraphrase of this document with our AI Paraphraser
4INVESTMENT MANAGEMENT AND PORTFOLIO MANAGEMENT
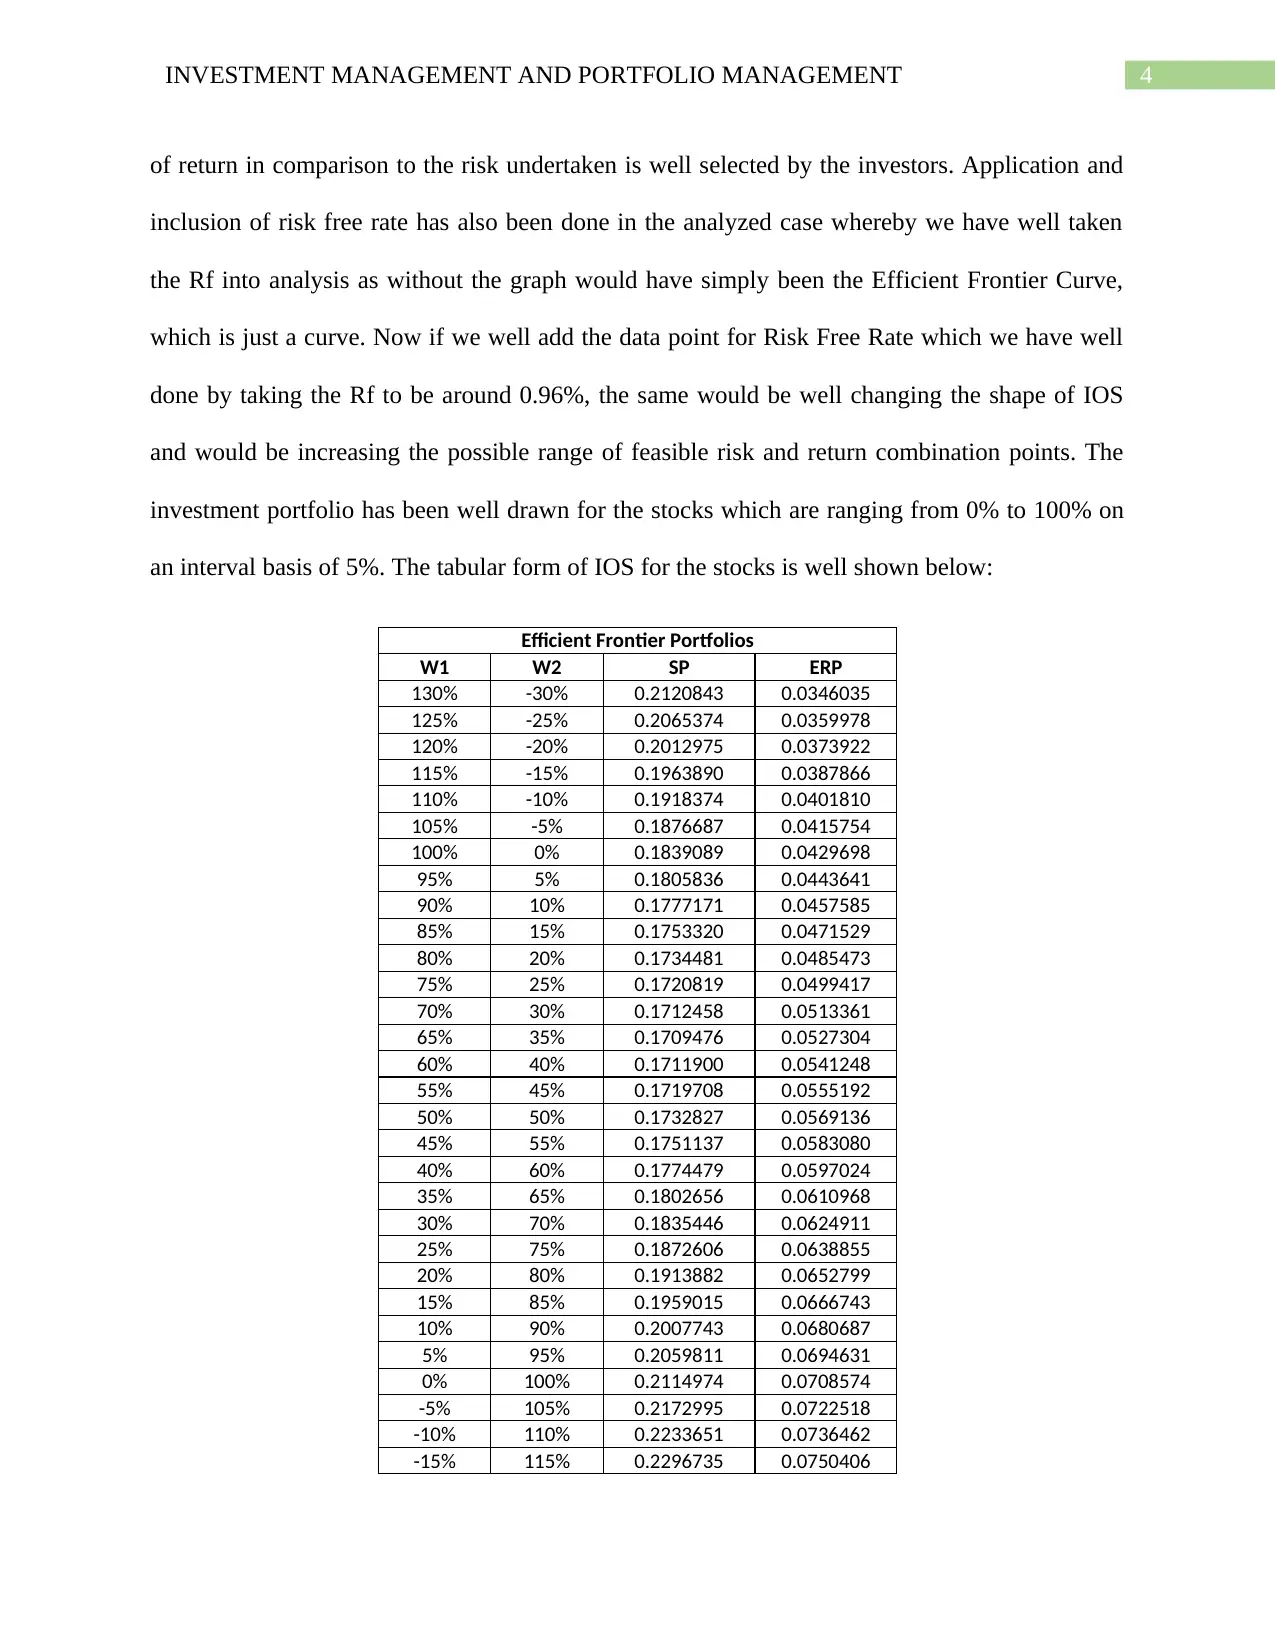
of return in comparison to the risk undertaken is well selected by the investors. Application and
inclusion of risk free rate has also been done in the analyzed case whereby we have well taken
the Rf into analysis as without the graph would have simply been the Efficient Frontier Curve,
which is just a curve. Now if we well add the data point for Risk Free Rate which we have well
done by taking the Rf to be around 0.96%, the same would be well changing the shape of IOS
and would be increasing the possible range of feasible risk and return combination points. The
investment portfolio has been well drawn for the stocks which are ranging from 0% to 100% on
an interval basis of 5%. The tabular form of IOS for the stocks is well shown below:
Efficient Frontier Portfolios
W1 W2 SP ERP
130% -30% 0.2120843 0.0346035
125% -25% 0.2065374 0.0359978
120% -20% 0.2012975 0.0373922
115% -15% 0.1963890 0.0387866
110% -10% 0.1918374 0.0401810
105% -5% 0.1876687 0.0415754
100% 0% 0.1839089 0.0429698
95% 5% 0.1805836 0.0443641
90% 10% 0.1777171 0.0457585
85% 15% 0.1753320 0.0471529
80% 20% 0.1734481 0.0485473
75% 25% 0.1720819 0.0499417
70% 30% 0.1712458 0.0513361
65% 35% 0.1709476 0.0527304
60% 40% 0.1711900 0.0541248
55% 45% 0.1719708 0.0555192
50% 50% 0.1732827 0.0569136
45% 55% 0.1751137 0.0583080
40% 60% 0.1774479 0.0597024
35% 65% 0.1802656 0.0610968
30% 70% 0.1835446 0.0624911
25% 75% 0.1872606 0.0638855
20% 80% 0.1913882 0.0652799
15% 85% 0.1959015 0.0666743
10% 90% 0.2007743 0.0680687
5% 95% 0.2059811 0.0694631
0% 100% 0.2114974 0.0708574
-5% 105% 0.2172995 0.0722518
-10% 110% 0.2233651 0.0736462
-15% 115% 0.2296735 0.0750406
5INVESTMENT MANAGEMENT AND PORTFOLIO MANAGEMENT
-20% 120% 0.2362050 0.0764350
-25% 125% 0.2429418 0.0778294
Efficient Frontier
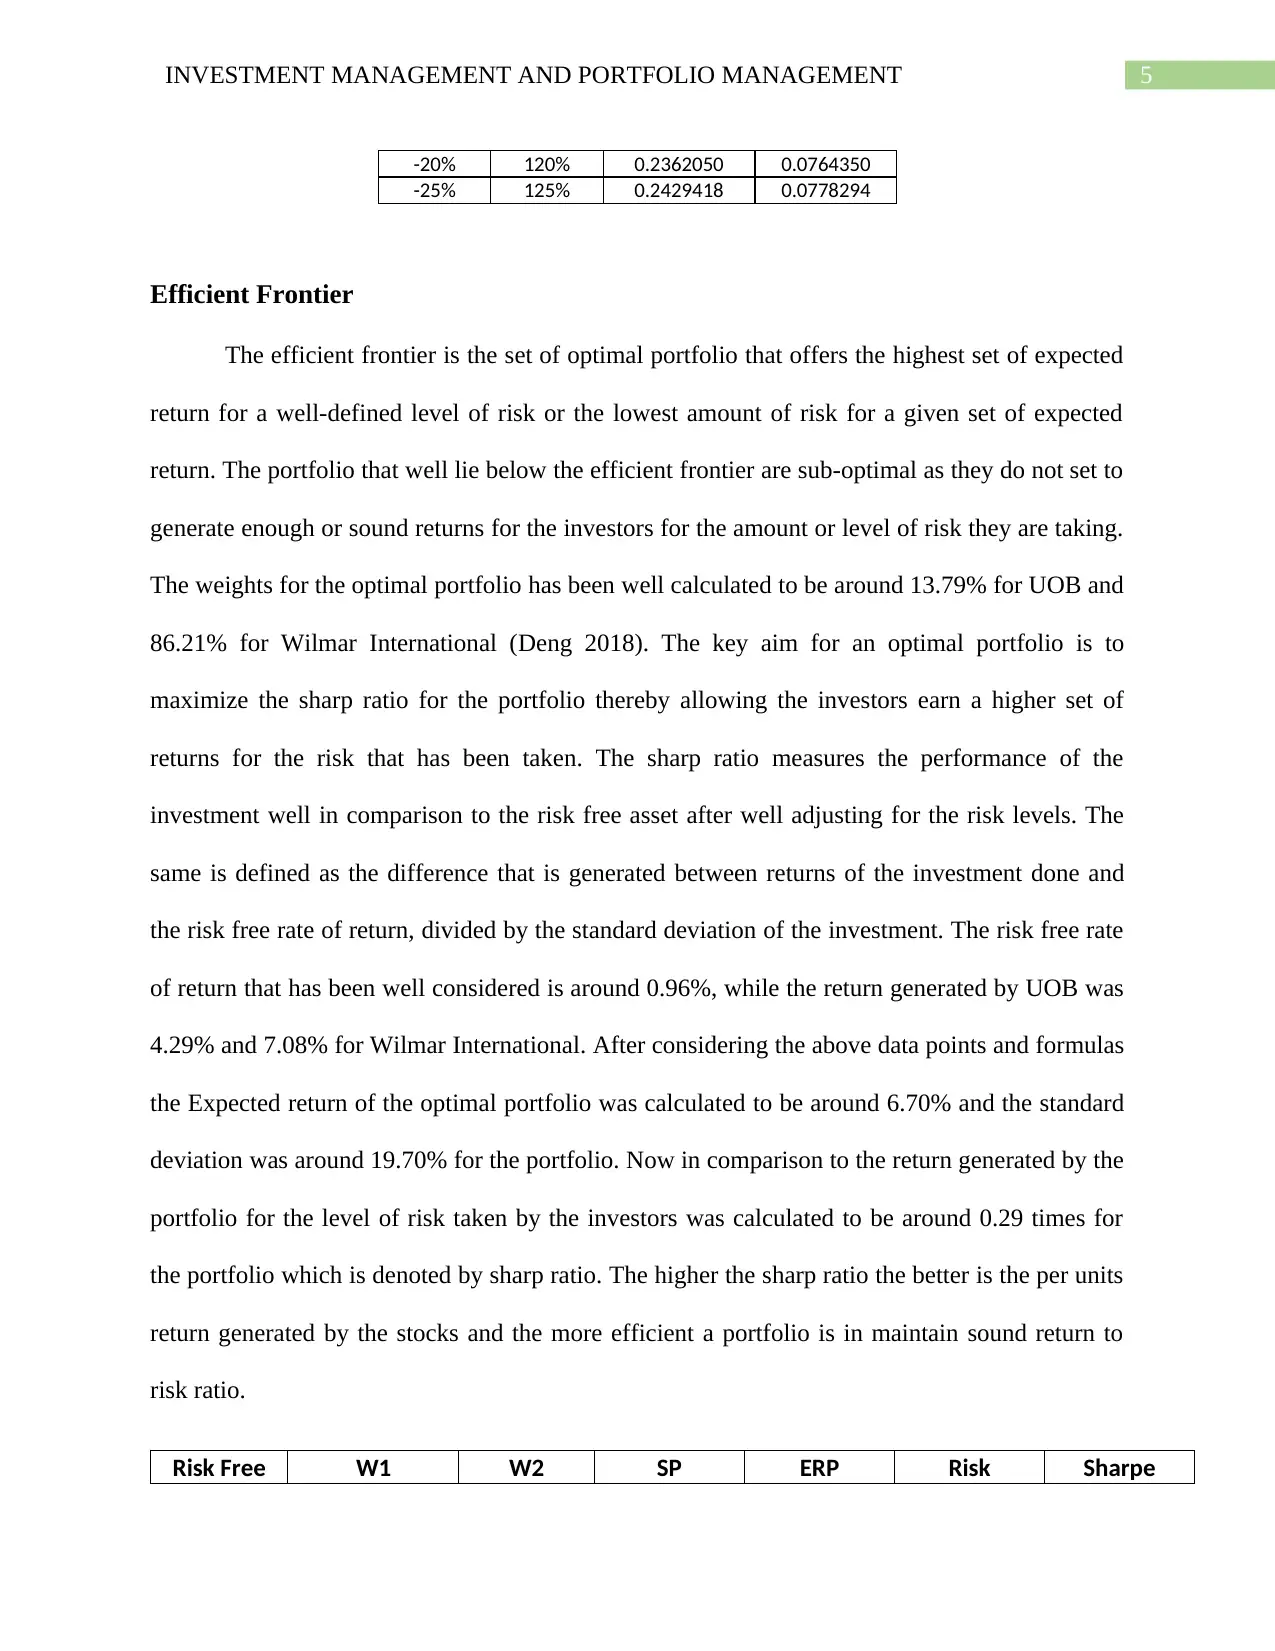
The efficient frontier is the set of optimal portfolio that offers the highest set of expected
return for a well-defined level of risk or the lowest amount of risk for a given set of expected
return. The portfolio that well lie below the efficient frontier are sub-optimal as they do not set to
generate enough or sound returns for the investors for the amount or level of risk they are taking.
The weights for the optimal portfolio has been well calculated to be around 13.79% for UOB and
86.21% for Wilmar International (Deng 2018). The key aim for an optimal portfolio is to
maximize the sharp ratio for the portfolio thereby allowing the investors earn a higher set of
returns for the risk that has been taken. The sharp ratio measures the performance of the
investment well in comparison to the risk free asset after well adjusting for the risk levels. The
same is defined as the difference that is generated between returns of the investment done and
the risk free rate of return, divided by the standard deviation of the investment. The risk free rate
of return that has been well considered is around 0.96%, while the return generated by UOB was
4.29% and 7.08% for Wilmar International. After considering the above data points and formulas
the Expected return of the optimal portfolio was calculated to be around 6.70% and the standard
deviation was around 19.70% for the portfolio. Now in comparison to the return generated by the
portfolio for the level of risk taken by the investors was calculated to be around 0.29 times for
the portfolio which is denoted by sharp ratio. The higher the sharp ratio the better is the per units
return generated by the stocks and the more efficient a portfolio is in maintain sound return to
risk ratio.
Risk Free W1 W2 SP ERP Risk Sharpe
-20% 120% 0.2362050 0.0764350
-25% 125% 0.2429418 0.0778294
Efficient Frontier
The efficient frontier is the set of optimal portfolio that offers the highest set of expected
return for a well-defined level of risk or the lowest amount of risk for a given set of expected
return. The portfolio that well lie below the efficient frontier are sub-optimal as they do not set to
generate enough or sound returns for the investors for the amount or level of risk they are taking.
The weights for the optimal portfolio has been well calculated to be around 13.79% for UOB and
86.21% for Wilmar International (Deng 2018). The key aim for an optimal portfolio is to
maximize the sharp ratio for the portfolio thereby allowing the investors earn a higher set of
returns for the risk that has been taken. The sharp ratio measures the performance of the
investment well in comparison to the risk free asset after well adjusting for the risk levels. The
same is defined as the difference that is generated between returns of the investment done and
the risk free rate of return, divided by the standard deviation of the investment. The risk free rate
of return that has been well considered is around 0.96%, while the return generated by UOB was
4.29% and 7.08% for Wilmar International. After considering the above data points and formulas
the Expected return of the optimal portfolio was calculated to be around 6.70% and the standard
deviation was around 19.70% for the portfolio. Now in comparison to the return generated by the
portfolio for the level of risk taken by the investors was calculated to be around 0.29 times for
the portfolio which is denoted by sharp ratio. The higher the sharp ratio the better is the per units
return generated by the stocks and the more efficient a portfolio is in maintain sound return to
risk ratio.
Risk Free W1 W2 SP ERP Risk Sharpe
⊘ This is a preview!⊘
Do you want full access?
Subscribe today to unlock all pages.
Trusted by 1+ million students worldwide
6INVESTMENT MANAGEMENT AND PORTFOLIO MANAGEMENT
Premium Ratio
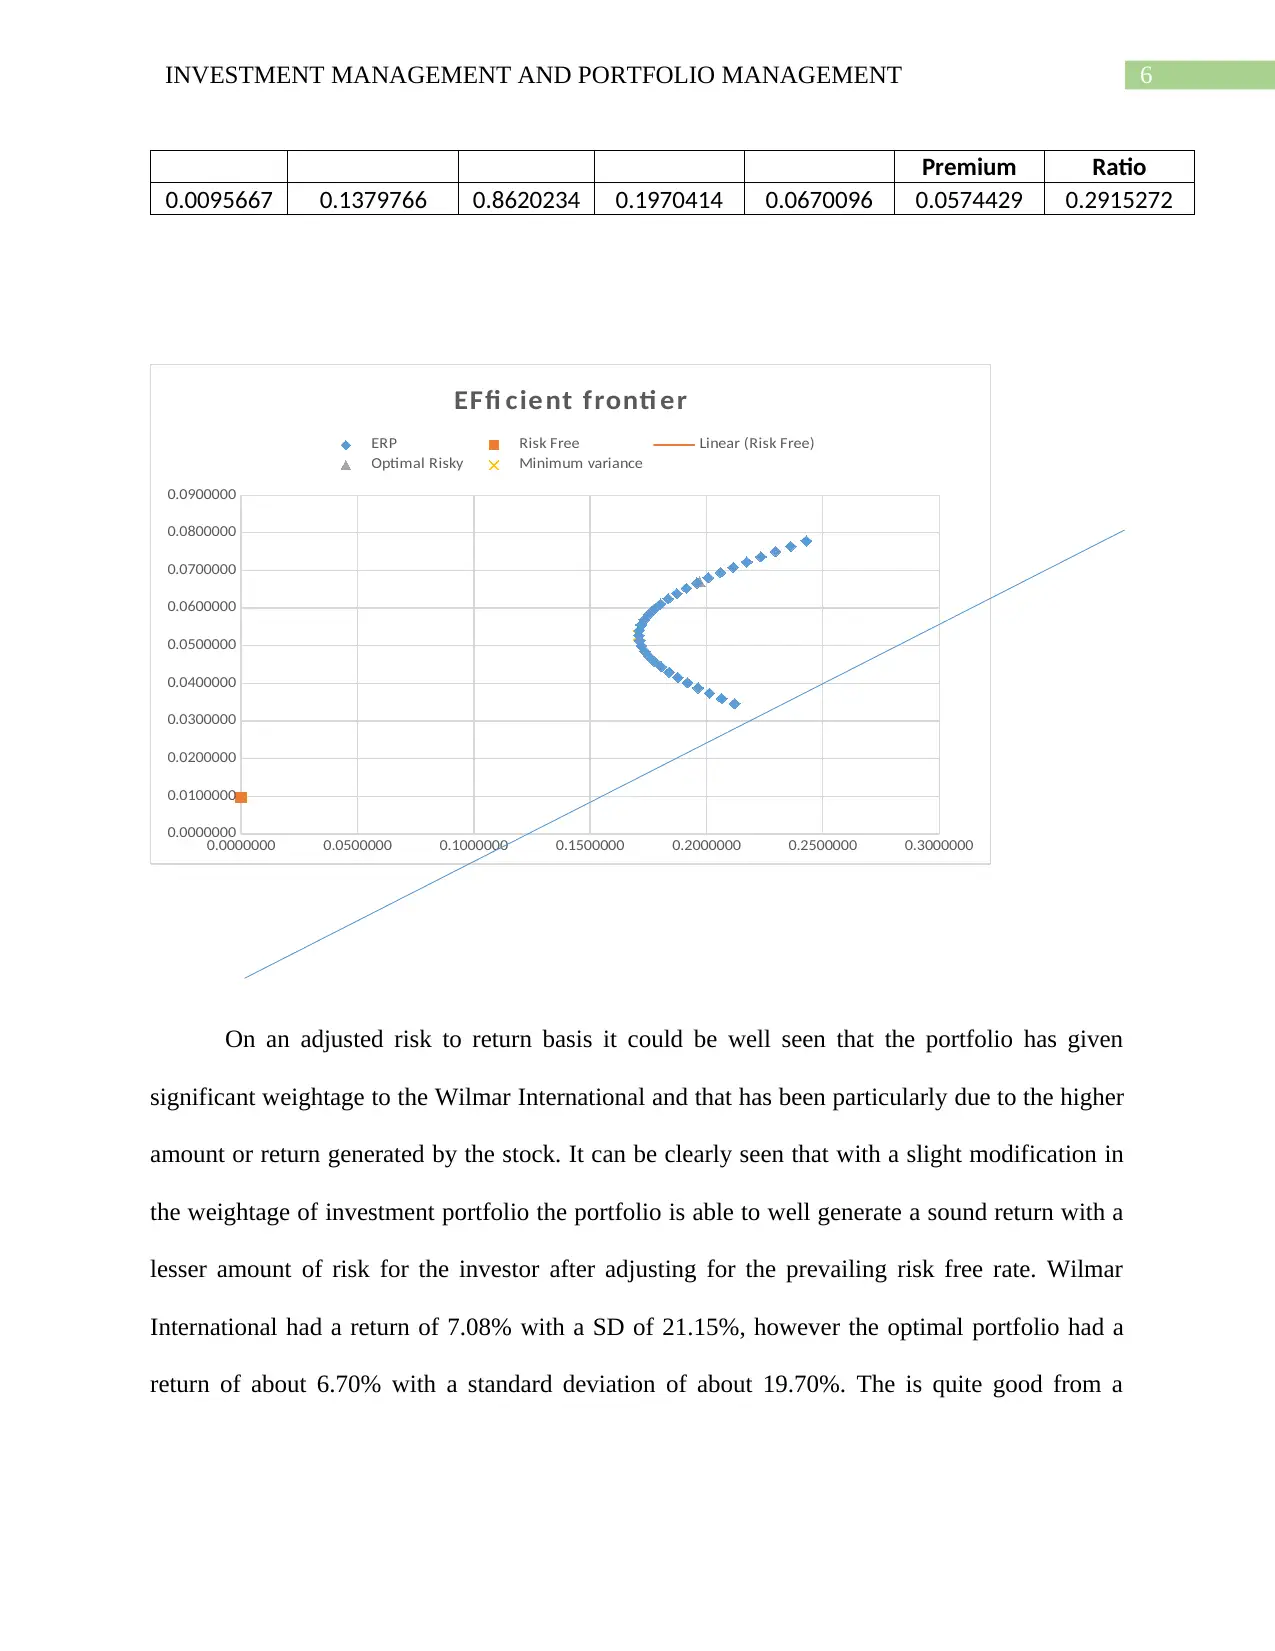
0.0095667 0.1379766 0.8620234 0.1970414 0.0670096 0.0574429 0.2915272
0.0000000 0.0500000 0.1000000 0.1500000 0.2000000 0.2500000 0.3000000
0.0000000
0.0100000
0.0200000
0.0300000
0.0400000
0.0500000
0.0600000
0.0700000
0.0800000
0.0900000
EFfi cient fronti er
ERP Risk Free Linear (Risk Free)
Optimal Risky Minimum variance
On an adjusted risk to return basis it could be well seen that the portfolio has given
significant weightage to the Wilmar International and that has been particularly due to the higher
amount or return generated by the stock. It can be clearly seen that with a slight modification in
the weightage of investment portfolio the portfolio is able to well generate a sound return with a
lesser amount of risk for the investor after adjusting for the prevailing risk free rate. Wilmar
International had a return of 7.08% with a SD of 21.15%, however the optimal portfolio had a
return of about 6.70% with a standard deviation of about 19.70%. The is quite good from a
Premium Ratio
0.0095667 0.1379766 0.8620234 0.1970414 0.0670096 0.0574429 0.2915272
0.0000000 0.0500000 0.1000000 0.1500000 0.2000000 0.2500000 0.3000000
0.0000000
0.0100000
0.0200000
0.0300000
0.0400000
0.0500000
0.0600000
0.0700000
0.0800000
0.0900000
EFfi cient fronti er
ERP Risk Free Linear (Risk Free)
Optimal Risky Minimum variance
On an adjusted risk to return basis it could be well seen that the portfolio has given
significant weightage to the Wilmar International and that has been particularly due to the higher
amount or return generated by the stock. It can be clearly seen that with a slight modification in
the weightage of investment portfolio the portfolio is able to well generate a sound return with a
lesser amount of risk for the investor after adjusting for the prevailing risk free rate. Wilmar
International had a return of 7.08% with a SD of 21.15%, however the optimal portfolio had a
return of about 6.70% with a standard deviation of about 19.70%. The is quite good from a
Paraphrase This Document
Need a fresh take? Get an instant paraphrase of this document with our AI Paraphraser
7INVESTMENT MANAGEMENT AND PORTFOLIO MANAGEMENT
portfolio perspective as the same would not only be allowing diversification benefits but would
also remove the concentration risk that is attached with a single stock investment.
Minimum Variance Portfolio
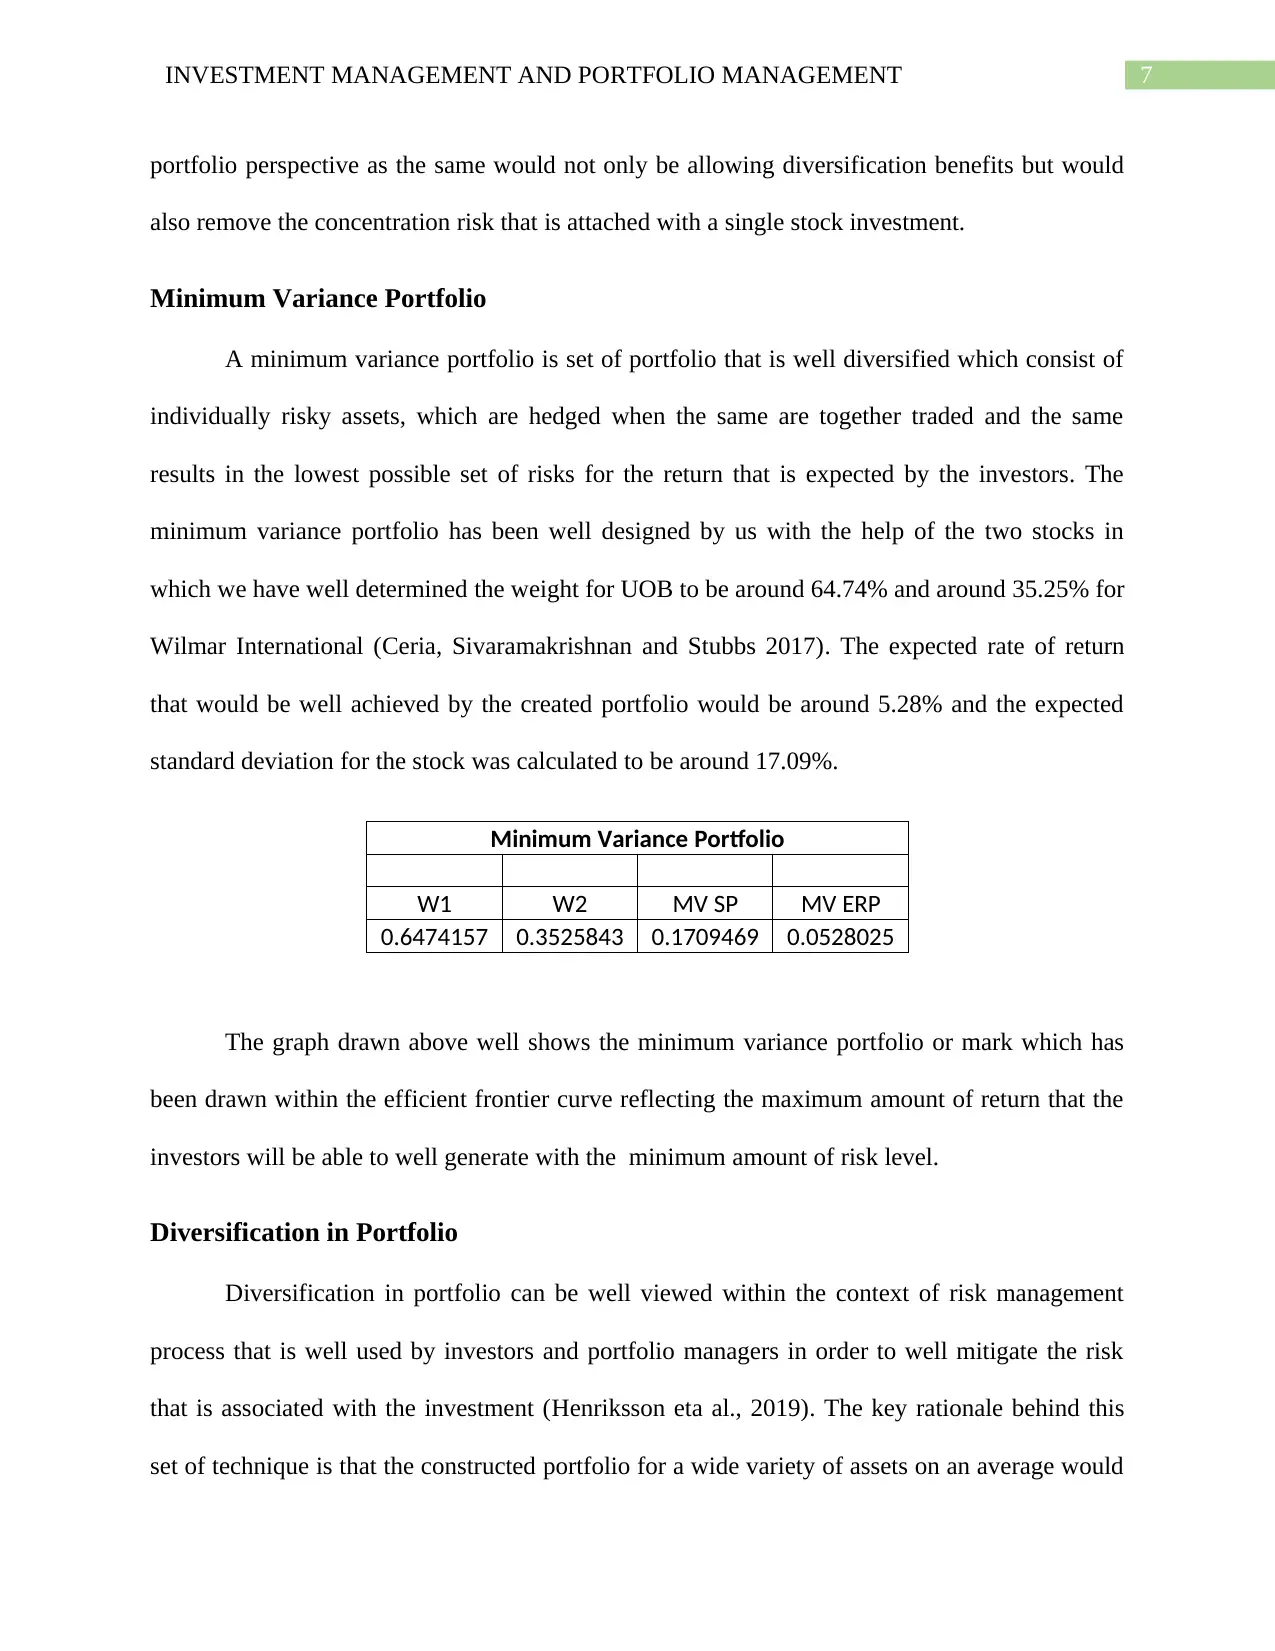
A minimum variance portfolio is set of portfolio that is well diversified which consist of
individually risky assets, which are hedged when the same are together traded and the same
results in the lowest possible set of risks for the return that is expected by the investors. The
minimum variance portfolio has been well designed by us with the help of the two stocks in
which we have well determined the weight for UOB to be around 64.74% and around 35.25% for
Wilmar International (Ceria, Sivaramakrishnan and Stubbs 2017). The expected rate of return
that would be well achieved by the created portfolio would be around 5.28% and the expected
standard deviation for the stock was calculated to be around 17.09%.
Minimum Variance Portfolio
W1 W2 MV SP MV ERP
0.6474157 0.3525843 0.1709469 0.0528025
The graph drawn above well shows the minimum variance portfolio or mark which has
been drawn within the efficient frontier curve reflecting the maximum amount of return that the
investors will be able to well generate with the minimum amount of risk level.
Diversification in Portfolio
Diversification in portfolio can be well viewed within the context of risk management
process that is well used by investors and portfolio managers in order to well mitigate the risk
that is associated with the investment (Henriksson eta al., 2019). The key rationale behind this
set of technique is that the constructed portfolio for a wide variety of assets on an average would
portfolio perspective as the same would not only be allowing diversification benefits but would
also remove the concentration risk that is attached with a single stock investment.
Minimum Variance Portfolio
A minimum variance portfolio is set of portfolio that is well diversified which consist of
individually risky assets, which are hedged when the same are together traded and the same
results in the lowest possible set of risks for the return that is expected by the investors. The
minimum variance portfolio has been well designed by us with the help of the two stocks in
which we have well determined the weight for UOB to be around 64.74% and around 35.25% for
Wilmar International (Ceria, Sivaramakrishnan and Stubbs 2017). The expected rate of return
that would be well achieved by the created portfolio would be around 5.28% and the expected
standard deviation for the stock was calculated to be around 17.09%.
Minimum Variance Portfolio
W1 W2 MV SP MV ERP
0.6474157 0.3525843 0.1709469 0.0528025
The graph drawn above well shows the minimum variance portfolio or mark which has
been drawn within the efficient frontier curve reflecting the maximum amount of return that the
investors will be able to well generate with the minimum amount of risk level.
Diversification in Portfolio
Diversification in portfolio can be well viewed within the context of risk management
process that is well used by investors and portfolio managers in order to well mitigate the risk
that is associated with the investment (Henriksson eta al., 2019). The key rationale behind this
set of technique is that the constructed portfolio for a wide variety of assets on an average would
8INVESTMENT MANAGEMENT AND PORTFOLIO MANAGEMENT
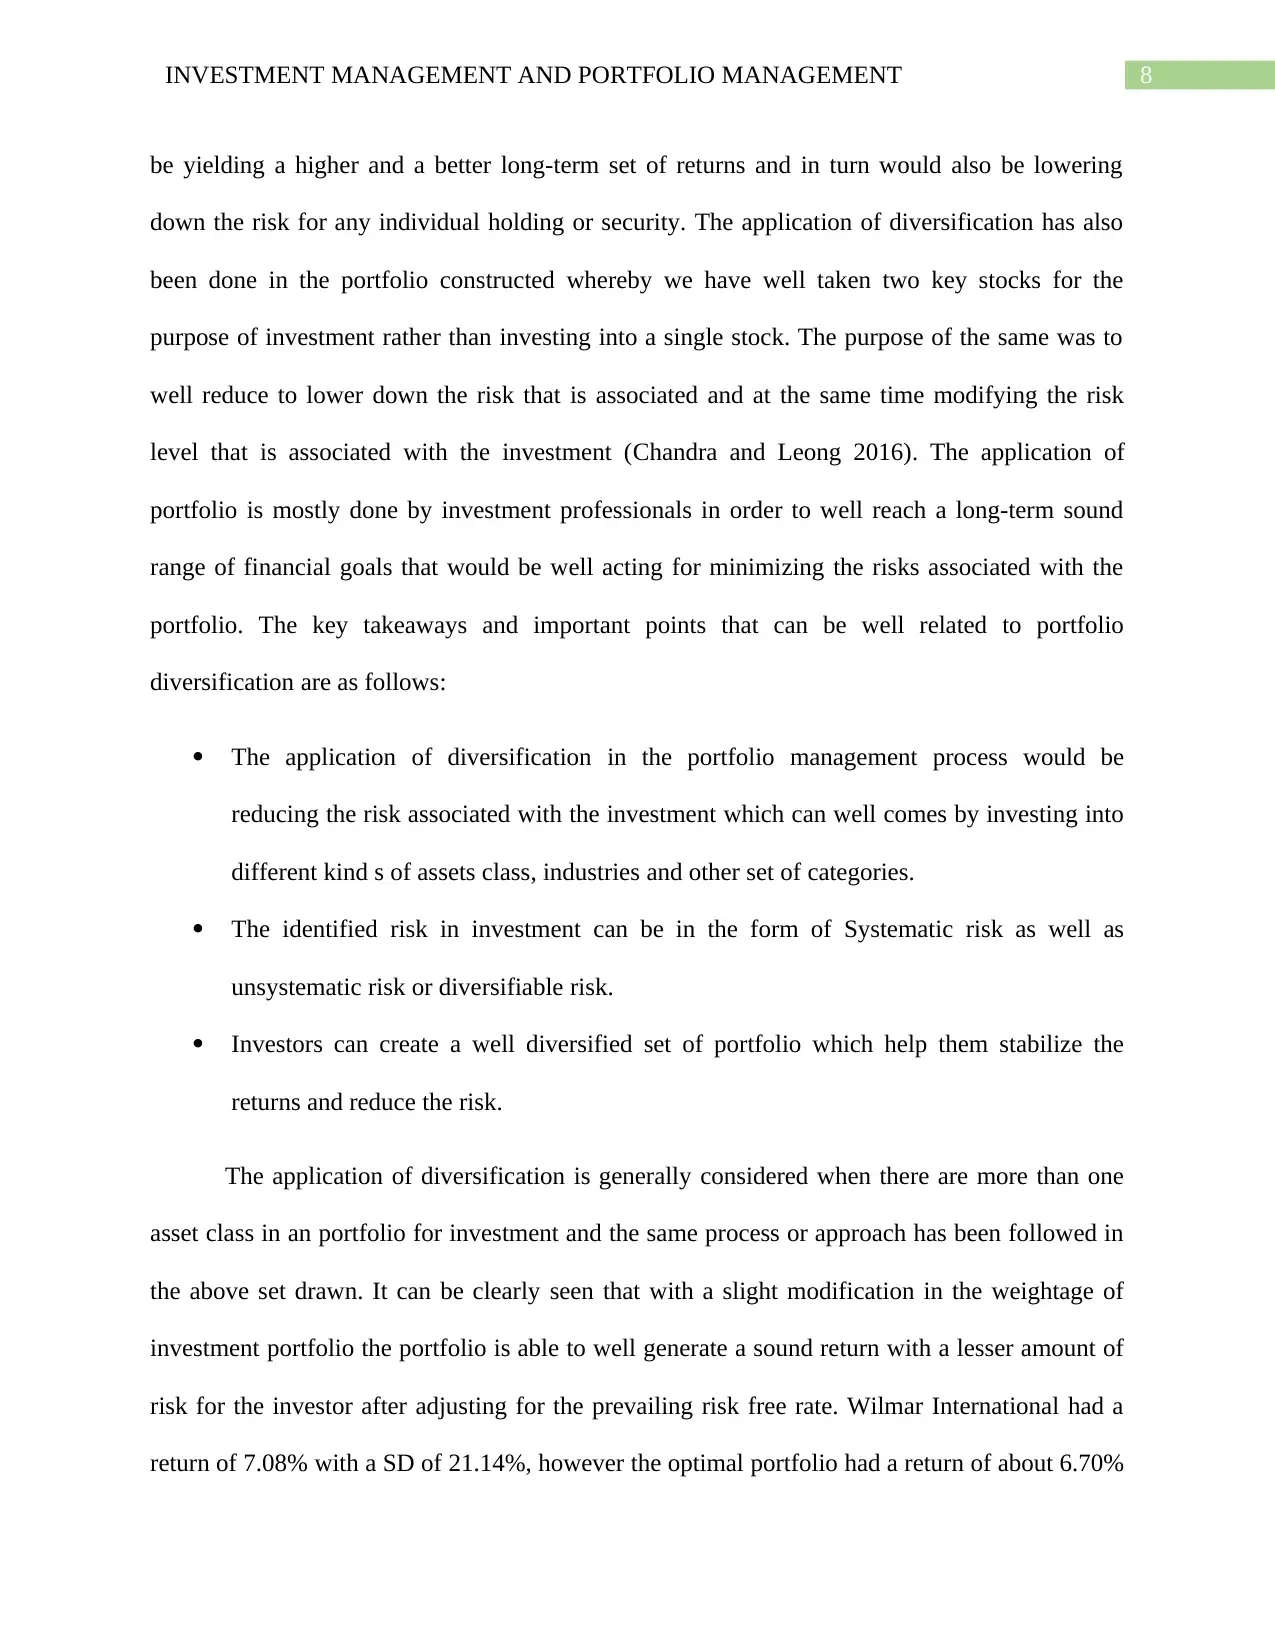
be yielding a higher and a better long-term set of returns and in turn would also be lowering
down the risk for any individual holding or security. The application of diversification has also
been done in the portfolio constructed whereby we have well taken two key stocks for the
purpose of investment rather than investing into a single stock. The purpose of the same was to
well reduce to lower down the risk that is associated and at the same time modifying the risk
level that is associated with the investment (Chandra and Leong 2016). The application of
portfolio is mostly done by investment professionals in order to well reach a long-term sound
range of financial goals that would be well acting for minimizing the risks associated with the
portfolio. The key takeaways and important points that can be well related to portfolio
diversification are as follows:
The application of diversification in the portfolio management process would be
reducing the risk associated with the investment which can well comes by investing into
different kind s of assets class, industries and other set of categories.
The identified risk in investment can be in the form of Systematic risk as well as
unsystematic risk or diversifiable risk.
Investors can create a well diversified set of portfolio which help them stabilize the
returns and reduce the risk.
The application of diversification is generally considered when there are more than one
asset class in an portfolio for investment and the same process or approach has been followed in
the above set drawn. It can be clearly seen that with a slight modification in the weightage of
investment portfolio the portfolio is able to well generate a sound return with a lesser amount of
risk for the investor after adjusting for the prevailing risk free rate. Wilmar International had a
return of 7.08% with a SD of 21.14%, however the optimal portfolio had a return of about 6.70%
⊘ This is a preview!⊘
Do you want full access?
Subscribe today to unlock all pages.
Trusted by 1+ million students worldwide
9INVESTMENT MANAGEMENT AND PORTFOLIO MANAGEMENT
with a standard deviation of about 19.70%. The is quite good from a portfolio perspective as the
same would not only be allowing diversification benefits but would also remove the
concentration risk that is attached with a single stock investment.
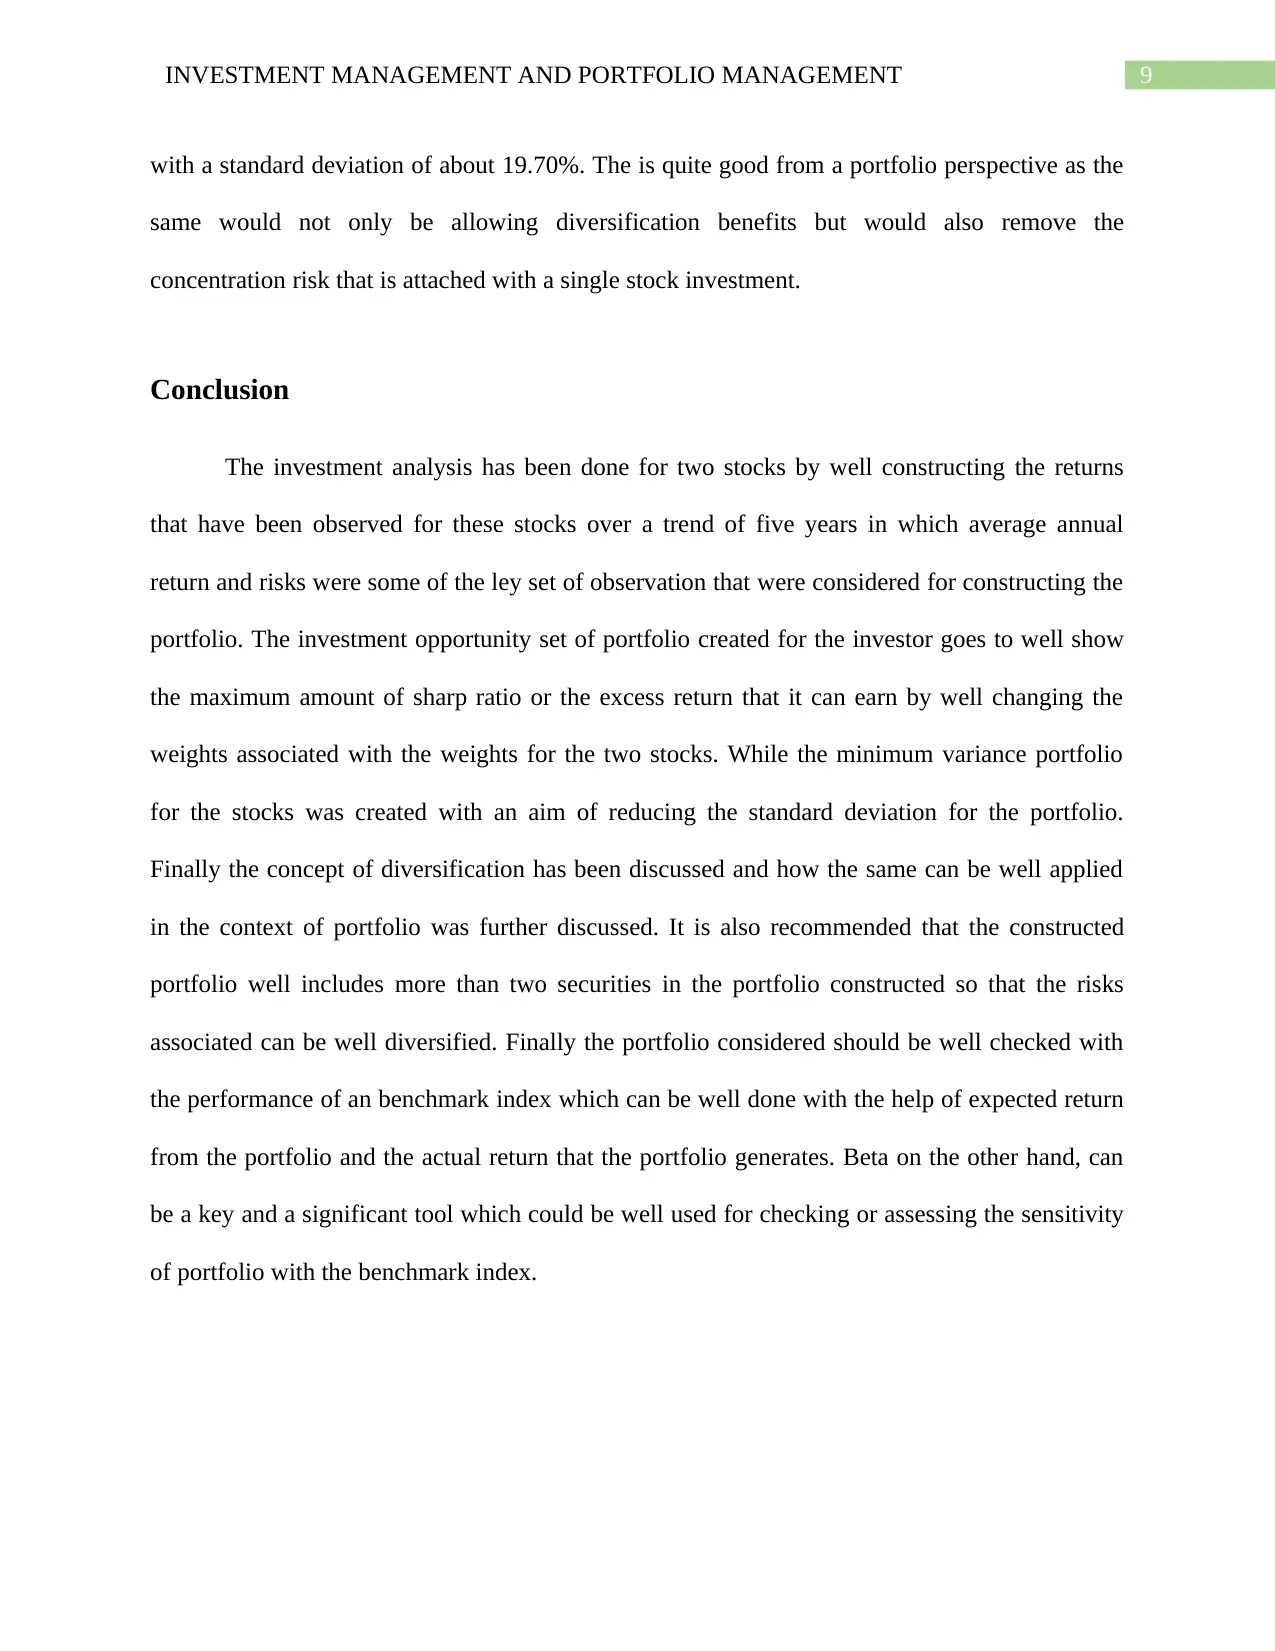
Conclusion
The investment analysis has been done for two stocks by well constructing the returns
that have been observed for these stocks over a trend of five years in which average annual
return and risks were some of the ley set of observation that were considered for constructing the
portfolio. The investment opportunity set of portfolio created for the investor goes to well show
the maximum amount of sharp ratio or the excess return that it can earn by well changing the
weights associated with the weights for the two stocks. While the minimum variance portfolio
for the stocks was created with an aim of reducing the standard deviation for the portfolio.
Finally the concept of diversification has been discussed and how the same can be well applied
in the context of portfolio was further discussed. It is also recommended that the constructed
portfolio well includes more than two securities in the portfolio constructed so that the risks
associated can be well diversified. Finally the portfolio considered should be well checked with
the performance of an benchmark index which can be well done with the help of expected return
from the portfolio and the actual return that the portfolio generates. Beta on the other hand, can
be a key and a significant tool which could be well used for checking or assessing the sensitivity
of portfolio with the benchmark index.
with a standard deviation of about 19.70%. The is quite good from a portfolio perspective as the
same would not only be allowing diversification benefits but would also remove the
concentration risk that is attached with a single stock investment.
Conclusion
The investment analysis has been done for two stocks by well constructing the returns
that have been observed for these stocks over a trend of five years in which average annual
return and risks were some of the ley set of observation that were considered for constructing the
portfolio. The investment opportunity set of portfolio created for the investor goes to well show
the maximum amount of sharp ratio or the excess return that it can earn by well changing the
weights associated with the weights for the two stocks. While the minimum variance portfolio
for the stocks was created with an aim of reducing the standard deviation for the portfolio.
Finally the concept of diversification has been discussed and how the same can be well applied
in the context of portfolio was further discussed. It is also recommended that the constructed
portfolio well includes more than two securities in the portfolio constructed so that the risks
associated can be well diversified. Finally the portfolio considered should be well checked with
the performance of an benchmark index which can be well done with the help of expected return
from the portfolio and the actual return that the portfolio generates. Beta on the other hand, can
be a key and a significant tool which could be well used for checking or assessing the sensitivity
of portfolio with the benchmark index.
Paraphrase This Document
Need a fresh take? Get an instant paraphrase of this document with our AI Paraphraser
10INVESTMENT MANAGEMENT AND PORTFOLIO MANAGEMENT
References
Adams, S.B., 2018. A Diversified Portfolio: Resources Fueling Silicon Valley Before Venture
Capital. In Business History Conference. Business and Economic History On-line: Papers
Presented at the BHC Annual Meeting (Vol. 16, pp. 1-14). Business History Conference.
Avagyan, V. and Mei, X., 2019. Precision matrix estimation under data contamination with an
application to minimum variance portfolio selection. Communications in Statistics-Simulation
and Computation, pp.1-20.
Benedetti, D., Biffis, E., Chatzimichalakis, F., Fedele, L.L. and Simm, I., 2019. Climate change
investment risk: optimal portfolio construction ahead of the transition to a lower-carbon
economy. Annals of Operations Research, pp.1-25.
Bodnar, T., Parolya, N. and Schmid, W., 2018. Estimation of the global minimum variance
portfolio in high dimensions. European Journal of Operational Research, 266(1), pp.371-390.
Branch, M., Goldberg, L. and Hand, P., 2020. Practical Applications of A Guide to ESG
Portfolio Construction. Practical Applications, 7(3), pp.1-6.
Calvo, C., Ivorra, C. and Liern, V., 2016. Fuzzy portfolio selection with non-financial goals:
exploring the efficient frontier. Annals of Operations Research, 245(1-2), pp.31-46.
Ceria, S., Sivaramakrishnan, K. and Stubbs, R.A., 2017. Alpha construction in a consistent
investment process. In Portfolio Construction, Measurement, and Efficiency (pp. 257-274).
Springer, Cham.
11INVESTMENT MANAGEMENT AND PORTFOLIO MANAGEMENT
Chandra, S. and Leong, F.T., 2016. A diversified portfolio model of adaptability. American
Psychologist, 71(9), p.847.
Clark, B.J., Feinstein, Z. and Simaan, M., 2020. A Machine Learning Efficient
Frontier. Available at SSRN 3541387.
Davis, B.J., 2018. Does financial well-being affect portfolio construction? Evidence from an
online survey. Economics Bulletin, 38(1), pp.362-366.
Deng, Y., 2018. Asset Investment and Portfolio Management of Sustainable Infrastructure
Systems: Optimization and Real-Options Approaches.
Henriksson, R., Livnat, J., Pfeifer, P. and Stumpp, M., 2019. Integrating ESG in portfolio
construction. The Journal of Portfolio Management, 45(4), pp.67-81.
Padma, A. and Rambabu, G., 2017. Optimal Portfolio Construction by Using Sharpe Single
Index Model. Sumedha Journal of Management, 6(4), pp.57-65.
Shimizu, H. and Shiohama, T., 2019. Multifactor Portfolio Construction by Factor Risk Parity
Strategies: An Empirical Comparison of Global Stock Markets. Asia-Pacific Financial
Markets, 26(4), pp.453-477.
Tu, Y.J., Huang, Y.H., Strader, T.J., Subramanyam, R. and Shaw, M.J., 2019. Candidate
diversity and granularity in IT portfolio construction. Information Technology and Management,
pp.1-12.
⊘ This is a preview!⊘
Do you want full access?
Subscribe today to unlock all pages.
Trusted by 1+ million students worldwide
1 out of 12
Related Documents


Your All-in-One AI-Powered Toolkit for Academic Success.
+13062052269
info@desklib.com
Available 24*7 on WhatsApp / Email
![[object Object]](/_next/static/media/star-bottom.7253800d.svg)
Unlock your academic potential
Copyright © 2020–2026 A2Z Services. All Rights Reserved. Developed and managed by ZUCOL.