Investment Analysis Report: Assessing Portfolio Performance and Risk
VerifiedAdded on 2020/07/22
|15
|714
|74
Report
AI Summary
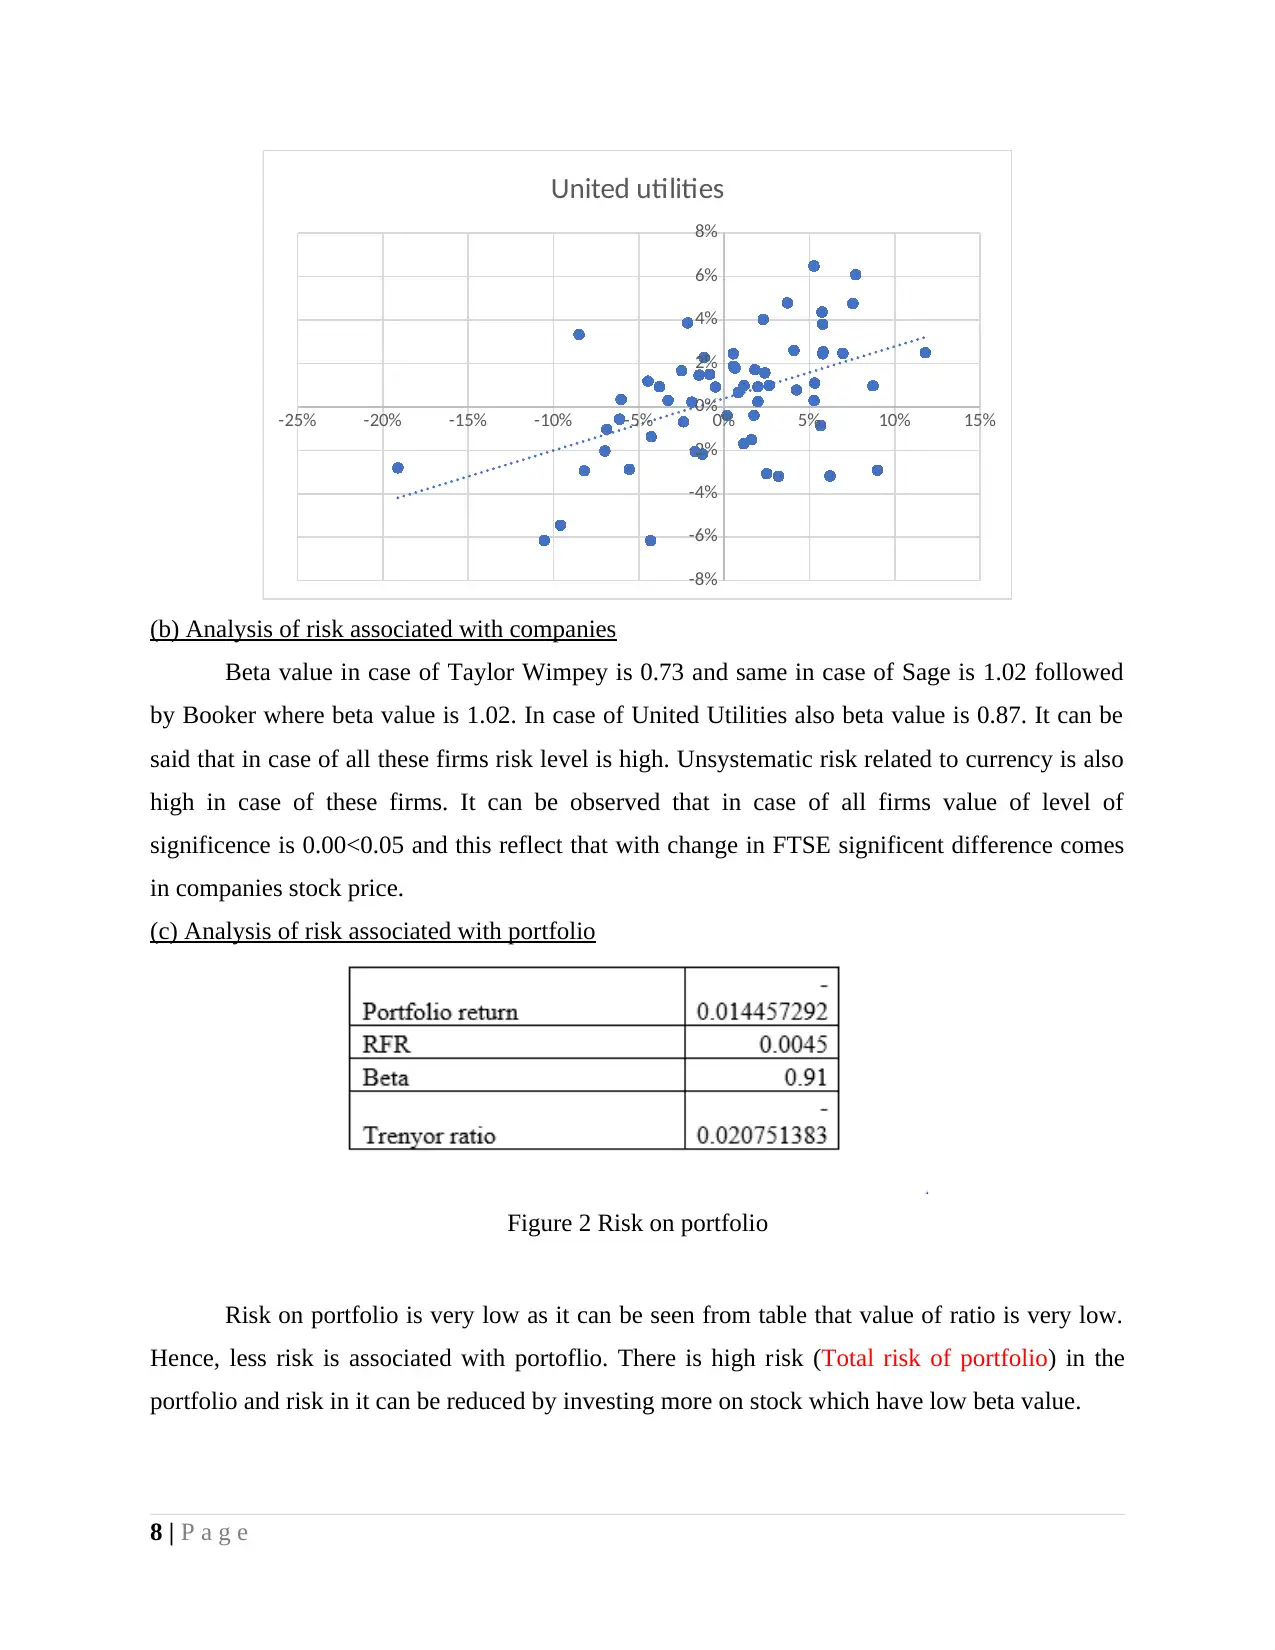
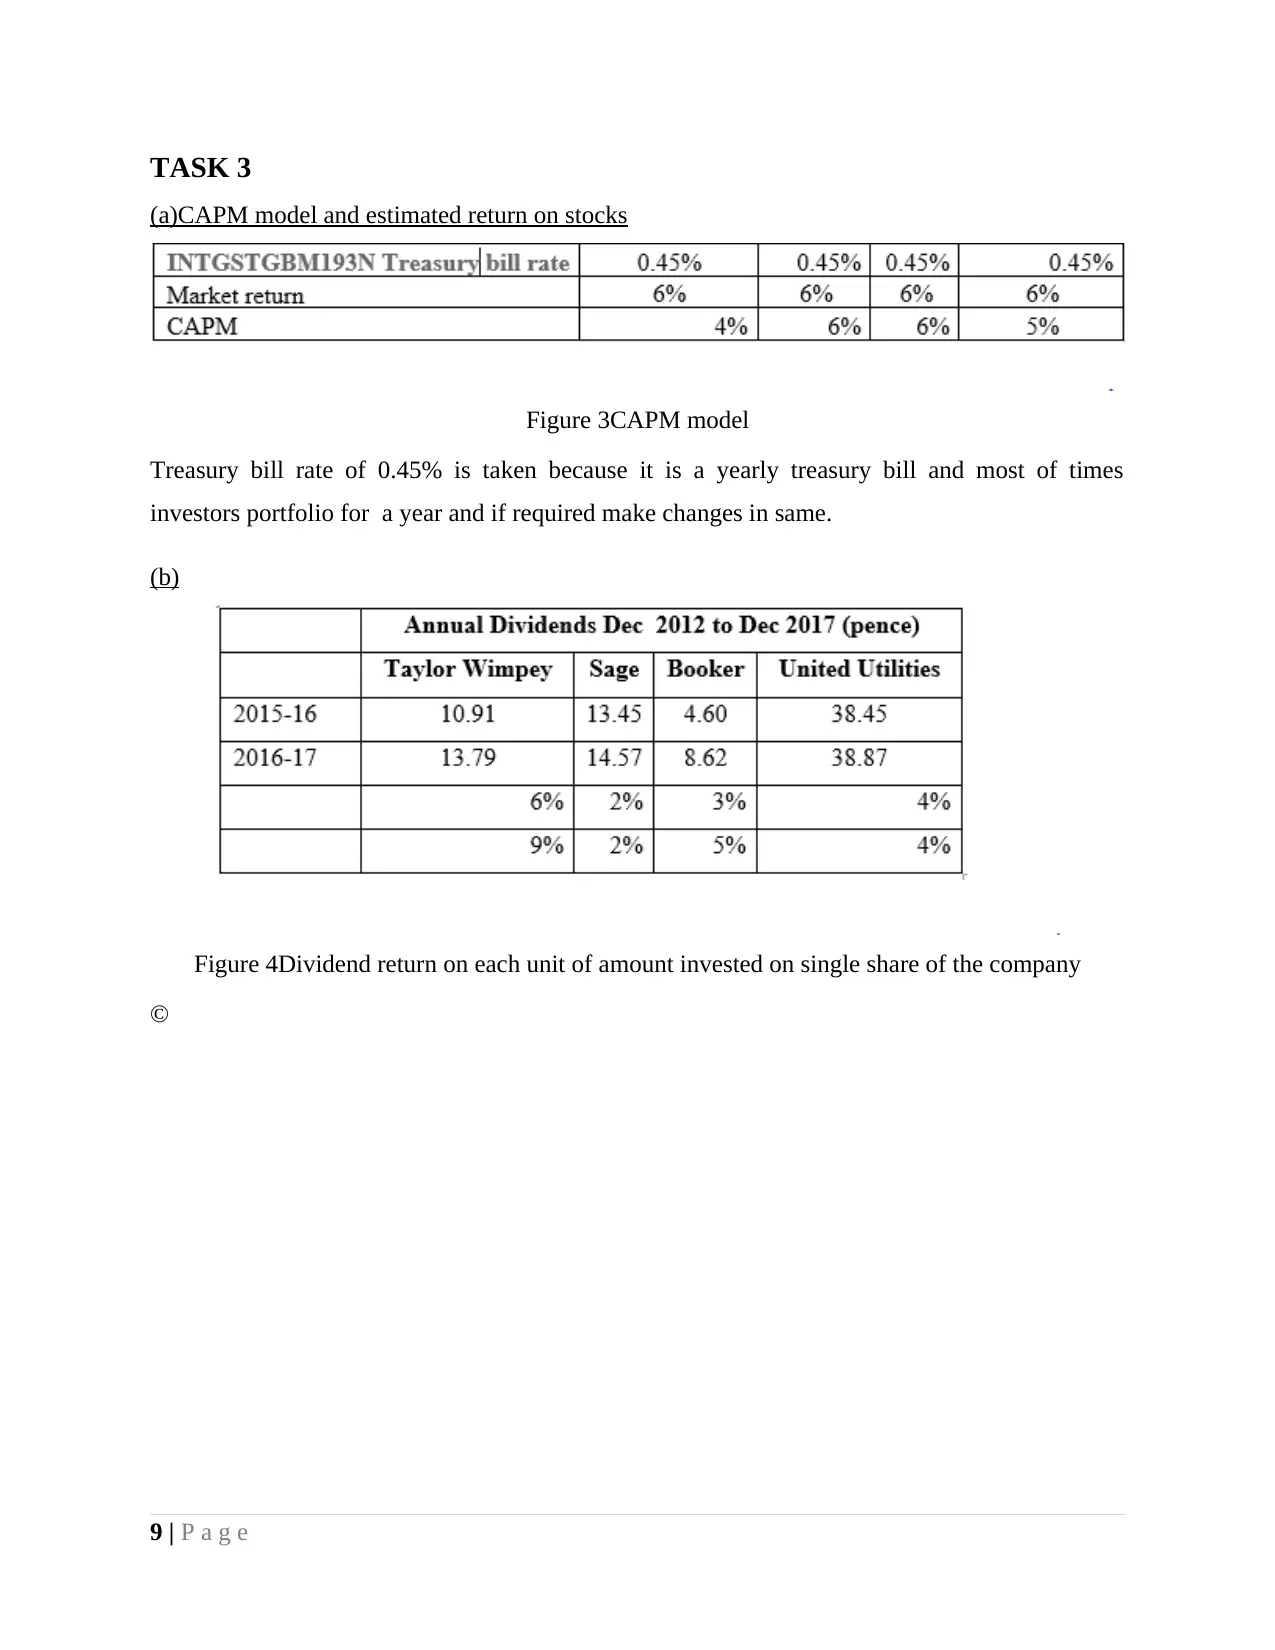
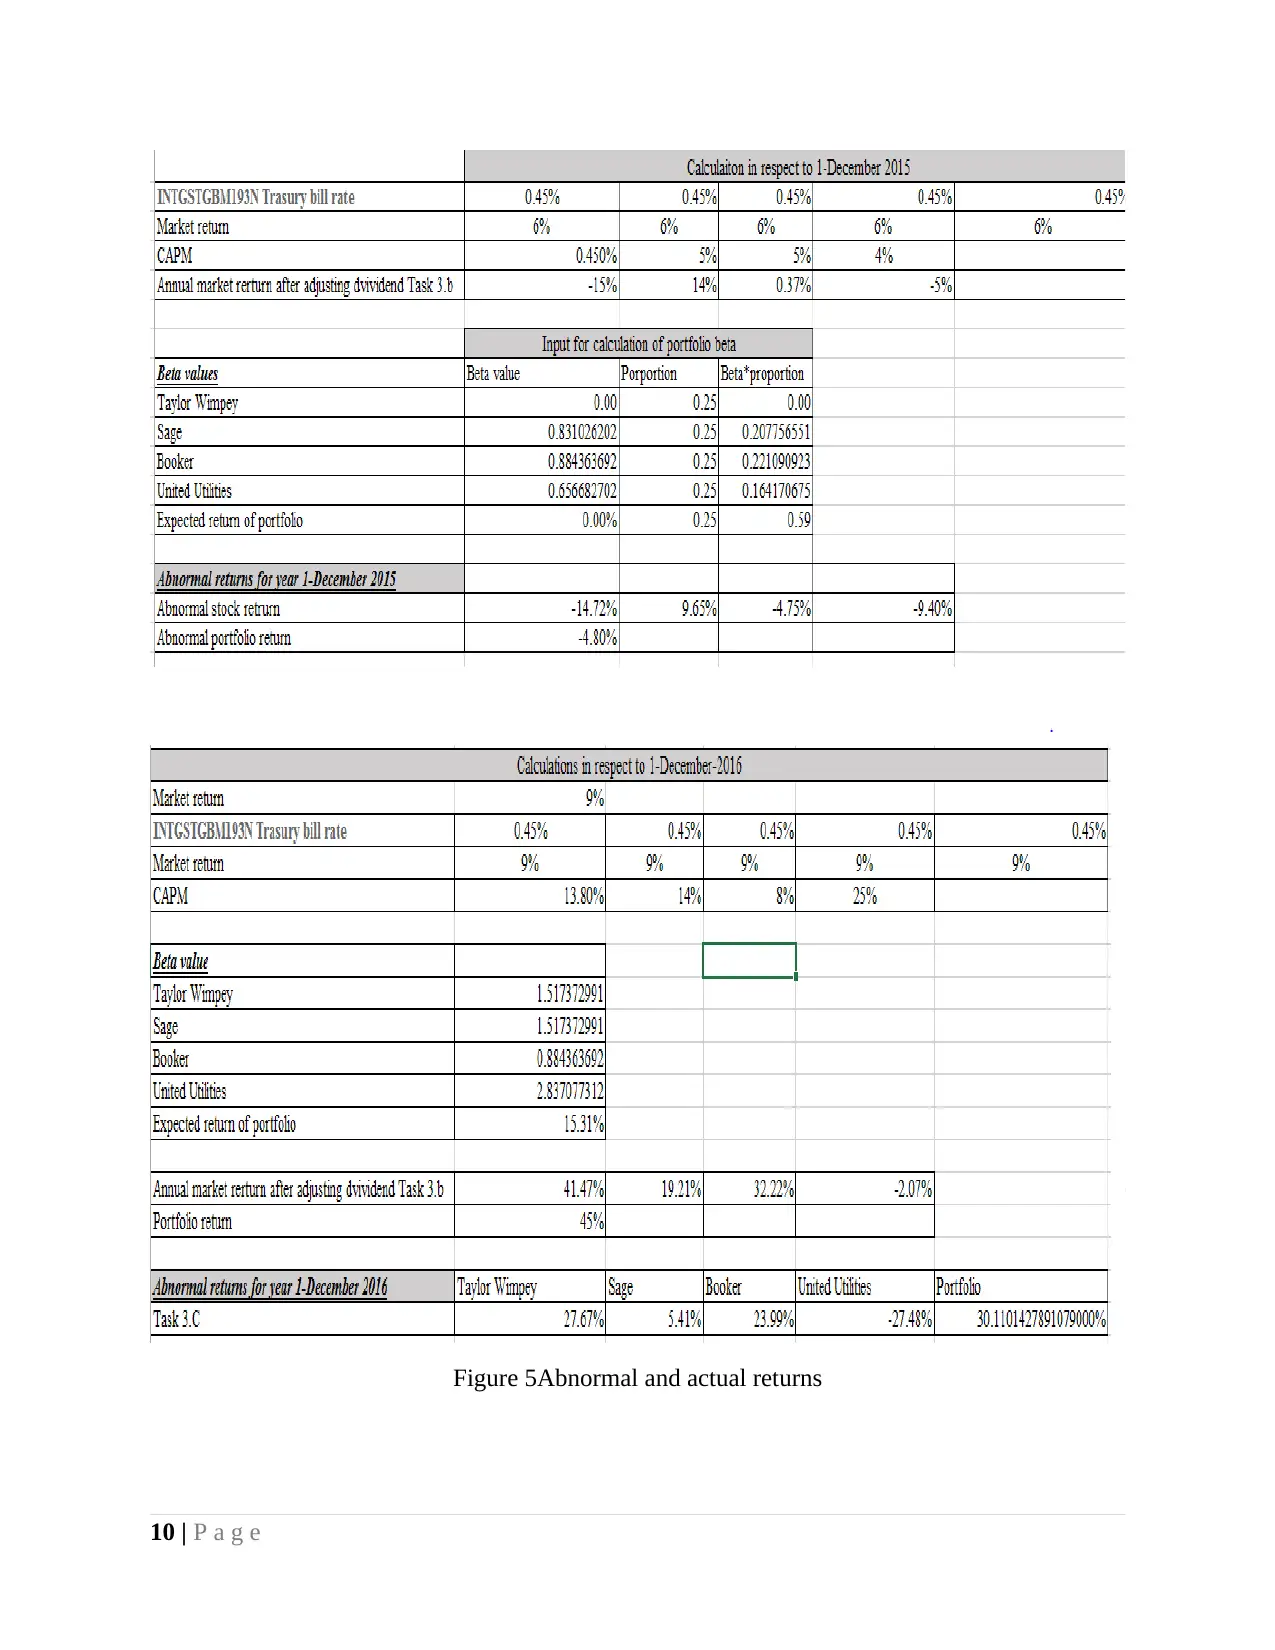
This report presents an investment analysis, evaluating a portfolio of companies. It begins with an overview of the portfolio, followed by an assessment of asset and portfolio risk, including regression analysis of stock and market returns, and an analysis of risk associated with each company and the portfolio as a whole. The Capital Asset Pricing Model (CAPM) is applied to estimate stock returns. The report also includes an analysis of dividend returns and abnormal returns. Finally, the report examines portfolio performance after reinvestment of dividends, including changes in portfolio weights and growth rates. The analysis uses figures and tables to illustrate key findings and performance metrics, concluding with an evaluation of overall portfolio performance for the investor.

INVESTMENT ANALYSIS
Paraphrase This Document
Need a fresh take? Get an instant paraphrase of this document with our AI Paraphraser

TABLE OF CONTENTS
TASK 1 Portfolio.............................................................................................................................1
TASK 2: Asset and portfolio risk....................................................................................................1
(a)Regression of companies stock and market return..................................................................1
(b) Analysis of risk associated with companies...........................................................................5
(c) Analysis of risk associated with portfolio..............................................................................5
TASK 3............................................................................................................................................6
(a)CAPM model and estimated return on stocks.........................................................................6
Treasury bill rate of 0.45% is taken because it is a yearly treasury bill and most of times
investors portfolio for a year and if required make changes in same.........................................6
(b).................................................................................................................................................6
TASK 4............................................................................................................................................8
(a)Portfolio after reinvestment of dividend amount....................................................................8
Figure 1CAPM model......................................................................................................................6
Figure 2Dividend return on each unit of amount invested on single share of the company...........6
Figure 3Abnormal and actual returns..............................................................................................7
Figure 4Portfolio weights change and addition of new units..........................................................8
Figure 5 Portfolio weight on 1December 2017...............................................................................9
Table 1Portfolio of companies.........................................................................................................1
Table 3Portfolio growth rate for the specific duration....................................................................9

TASK 1 Portfolio
Figure 1 Portfolio of companies
TASK 2: Asset and portfolio risk
(a)Regression of companies stock and market return
Taylor Wimpey
1 | P a g e
Figure 1 Portfolio of companies
TASK 2: Asset and portfolio risk
(a)Regression of companies stock and market return
Taylor Wimpey
1 | P a g e
⊘ This is a preview!⊘
Do you want full access?
Subscribe today to unlock all pages.

Trusted by 1+ million students worldwide

2 | P a g e
Paraphrase This Document
Need a fresh take? Get an instant paraphrase of this document with our AI Paraphraser

-50% -40% -30% -20% -10% 0% 10% 20%
-8%
-6%
-4%
-2%
0%
2%
4%
6%
8%
Taylor Wimpey
Sage
3 | P a g e
-8%
-6%
-4%
-2%
0%
2%
4%
6%
8%
Taylor Wimpey
Sage
3 | P a g e

-15% -10% -5% 0% 5% 10% 15% 20%
-8%
-6%
-4%
-2%
0%
2%
4%
6%
8%
Sage
Booker
4 | P a g e
-8%
-6%
-4%
-2%
0%
2%
4%
6%
8%
Sage
Booker
4 | P a g e
⊘ This is a preview!⊘
Do you want full access?
Subscribe today to unlock all pages.

Trusted by 1+ million students worldwide

5 | P a g e
Paraphrase This Document
Need a fresh take? Get an instant paraphrase of this document with our AI Paraphraser

-15% -10% -5% 0% 5% 10% 15% 20% 25%
-8%
-6%
-4%
-2%
0%
2%
4%
6%
8%
Booker
6 | P a g e
-8%
-6%
-4%
-2%
0%
2%
4%
6%
8%
Booker
6 | P a g e

United utilities
7 | P a g e
7 | P a g e
⊘ This is a preview!⊘
Do you want full access?
Subscribe today to unlock all pages.

Trusted by 1+ million students worldwide

-25% -20% -15% -10% -5% 0% 5% 10% 15%
-8%
-6%
-4%
-2%
0%
2%
4%
6%
8%
United utilities
(b) Analysis of risk associated with companies
Beta value in case of Taylor Wimpey is 0.73 and same in case of Sage is 1.02 followed
by Booker where beta value is 1.02. In case of United Utilities also beta value is 0.87. It can be
said that in case of all these firms risk level is high. Unsystematic risk related to currency is also
high in case of these firms. It can be observed that in case of all firms value of level of
significence is 0.00<0.05 and this reflect that with change in FTSE significent difference comes
in companies stock price.
(c) Analysis of risk associated with portfolio
Figure 2 Risk on portfolio
Risk on portfolio is very low as it can be seen from table that value of ratio is very low.
Hence, less risk is associated with portoflio. There is high risk (Total risk of portfolio) in the
portfolio and risk in it can be reduced by investing more on stock which have low beta value.
8 | P a g e
Paraphrase This Document
Need a fresh take? Get an instant paraphrase of this document with our AI Paraphraser

TASK 3
(a)CAPM model and estimated return on stocks
Figure 3CAPM model
Treasury bill rate of 0.45% is taken because it is a yearly treasury bill and most of times
investors portfolio for a year and if required make changes in same.
(b)
Figure 4Dividend return on each unit of amount invested on single share of the company
©
9 | P a g e

Figure 5Abnormal and actual returns
10 | P a g e
10 | P a g e
⊘ This is a preview!⊘
Do you want full access?
Subscribe today to unlock all pages.

Trusted by 1+ million students worldwide
1 out of 15
Related Documents

Your All-in-One AI-Powered Toolkit for Academic Success.
+13062052269
info@desklib.com
Available 24*7 on WhatsApp / Email
Unlock your academic potential
Copyright © 2020–2025 A2Z Services. All Rights Reserved. Developed and managed by ZUCOL.