25503 Investment Analysis Assignment Part II: Portfolio Analysis

Verified

Added on  2023/04/24

|10
|872
|212
Report
AI Summary
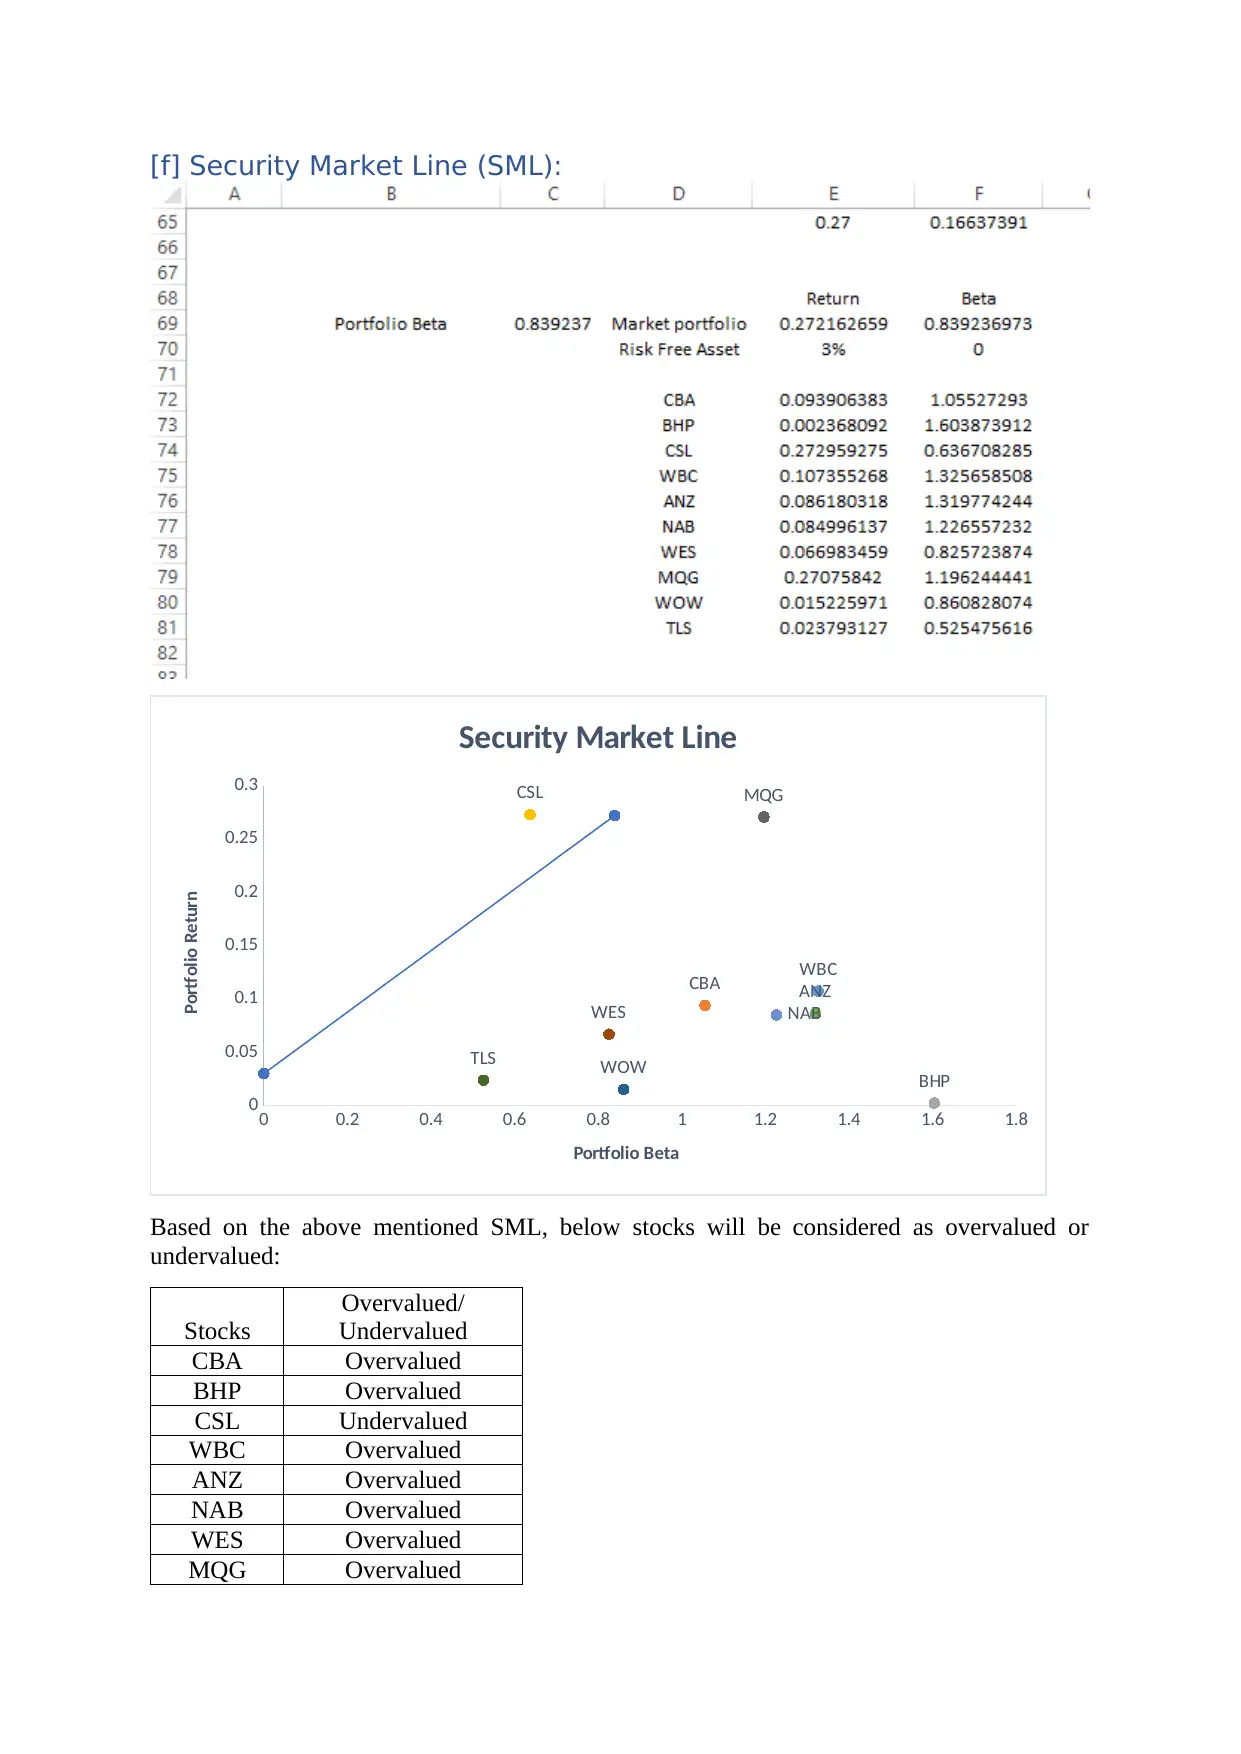
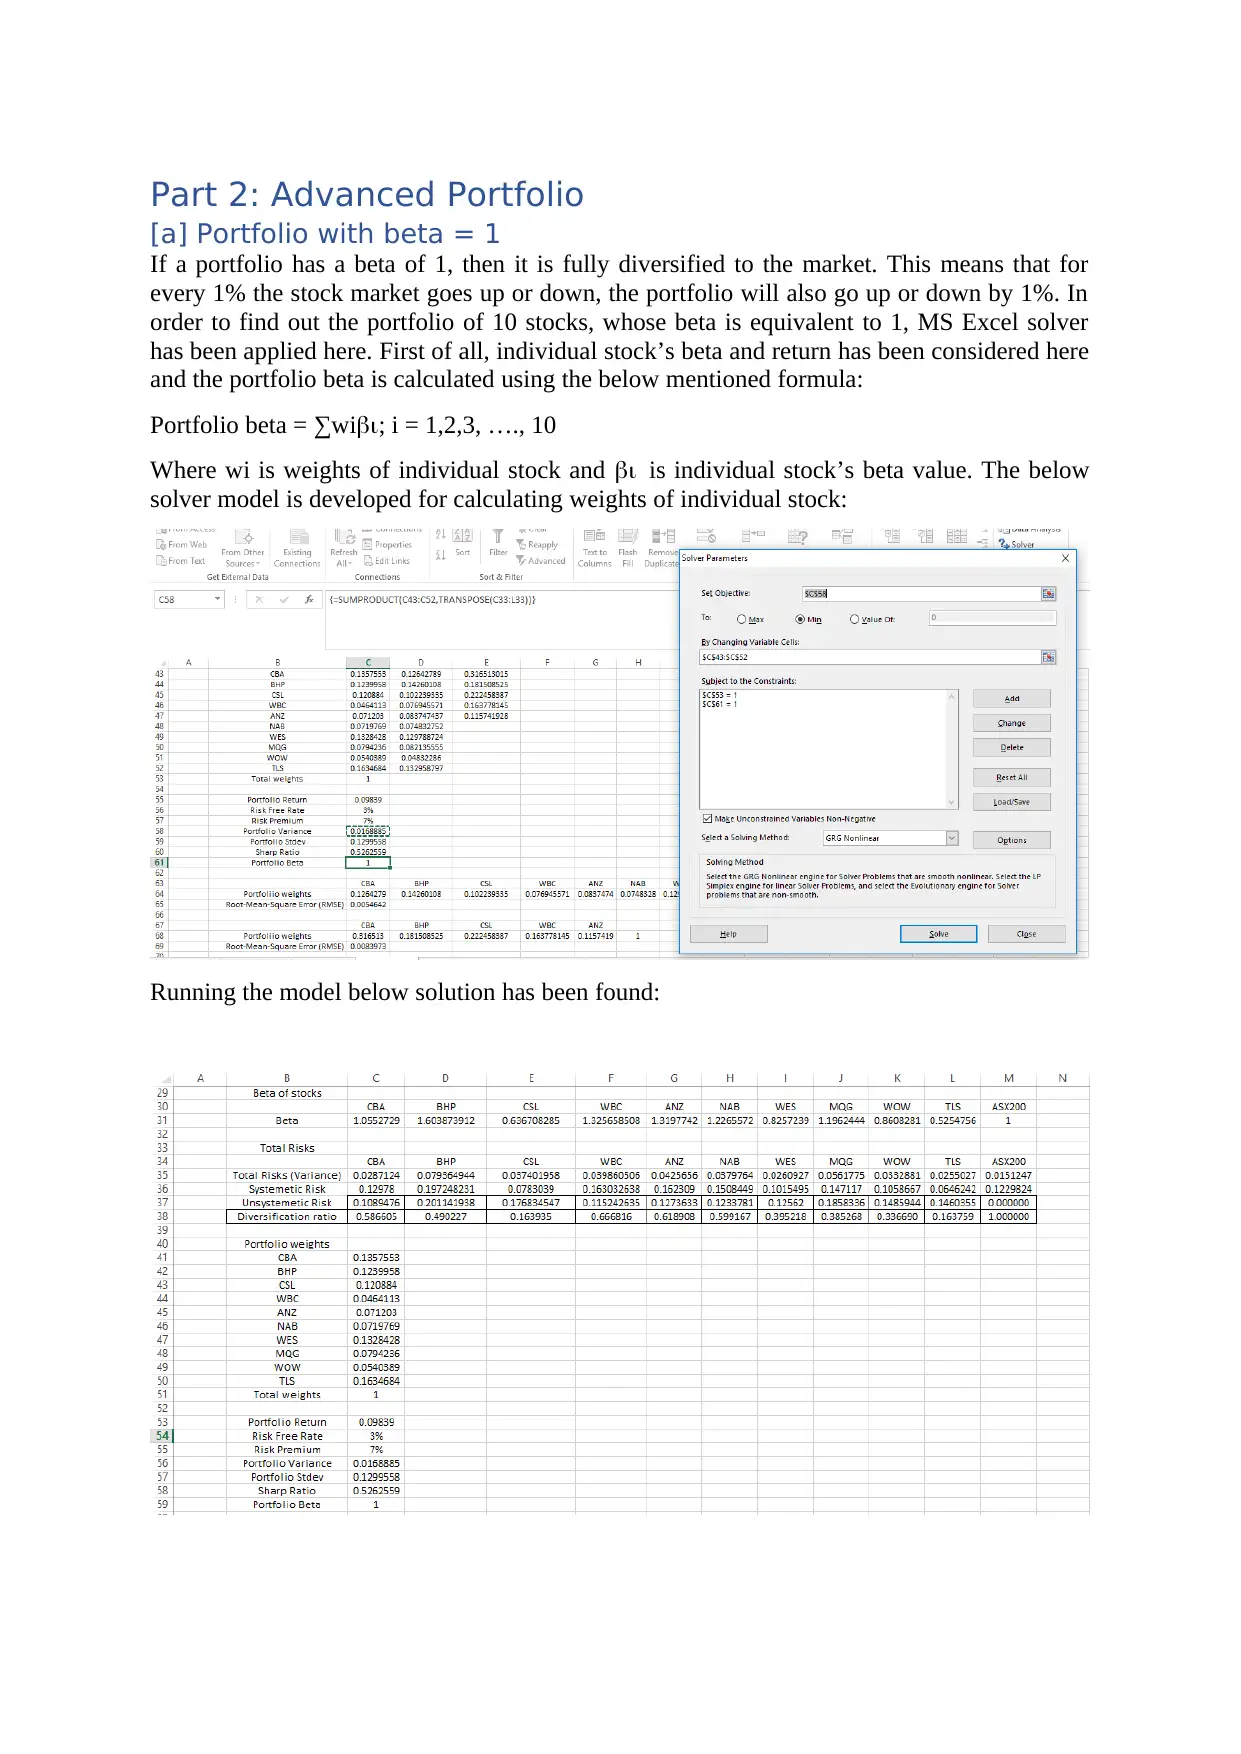
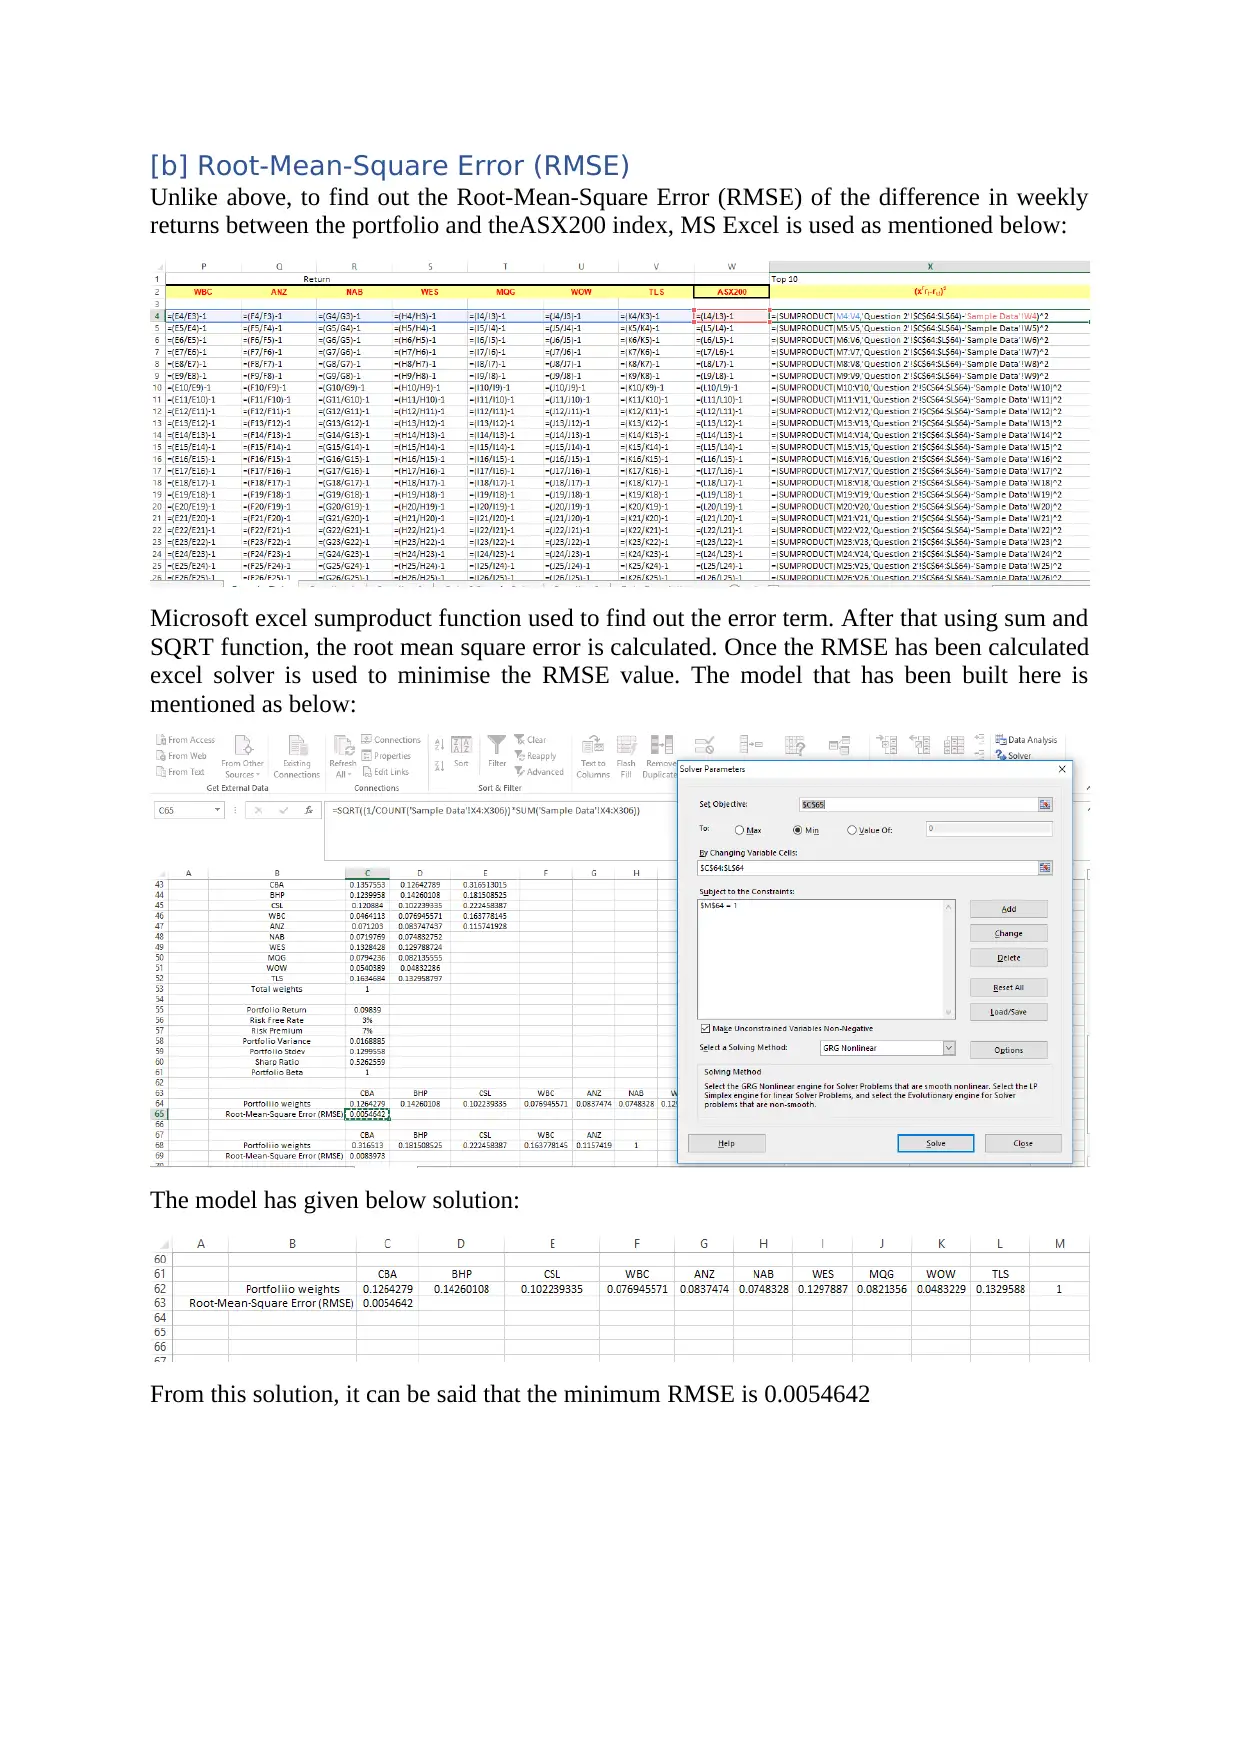
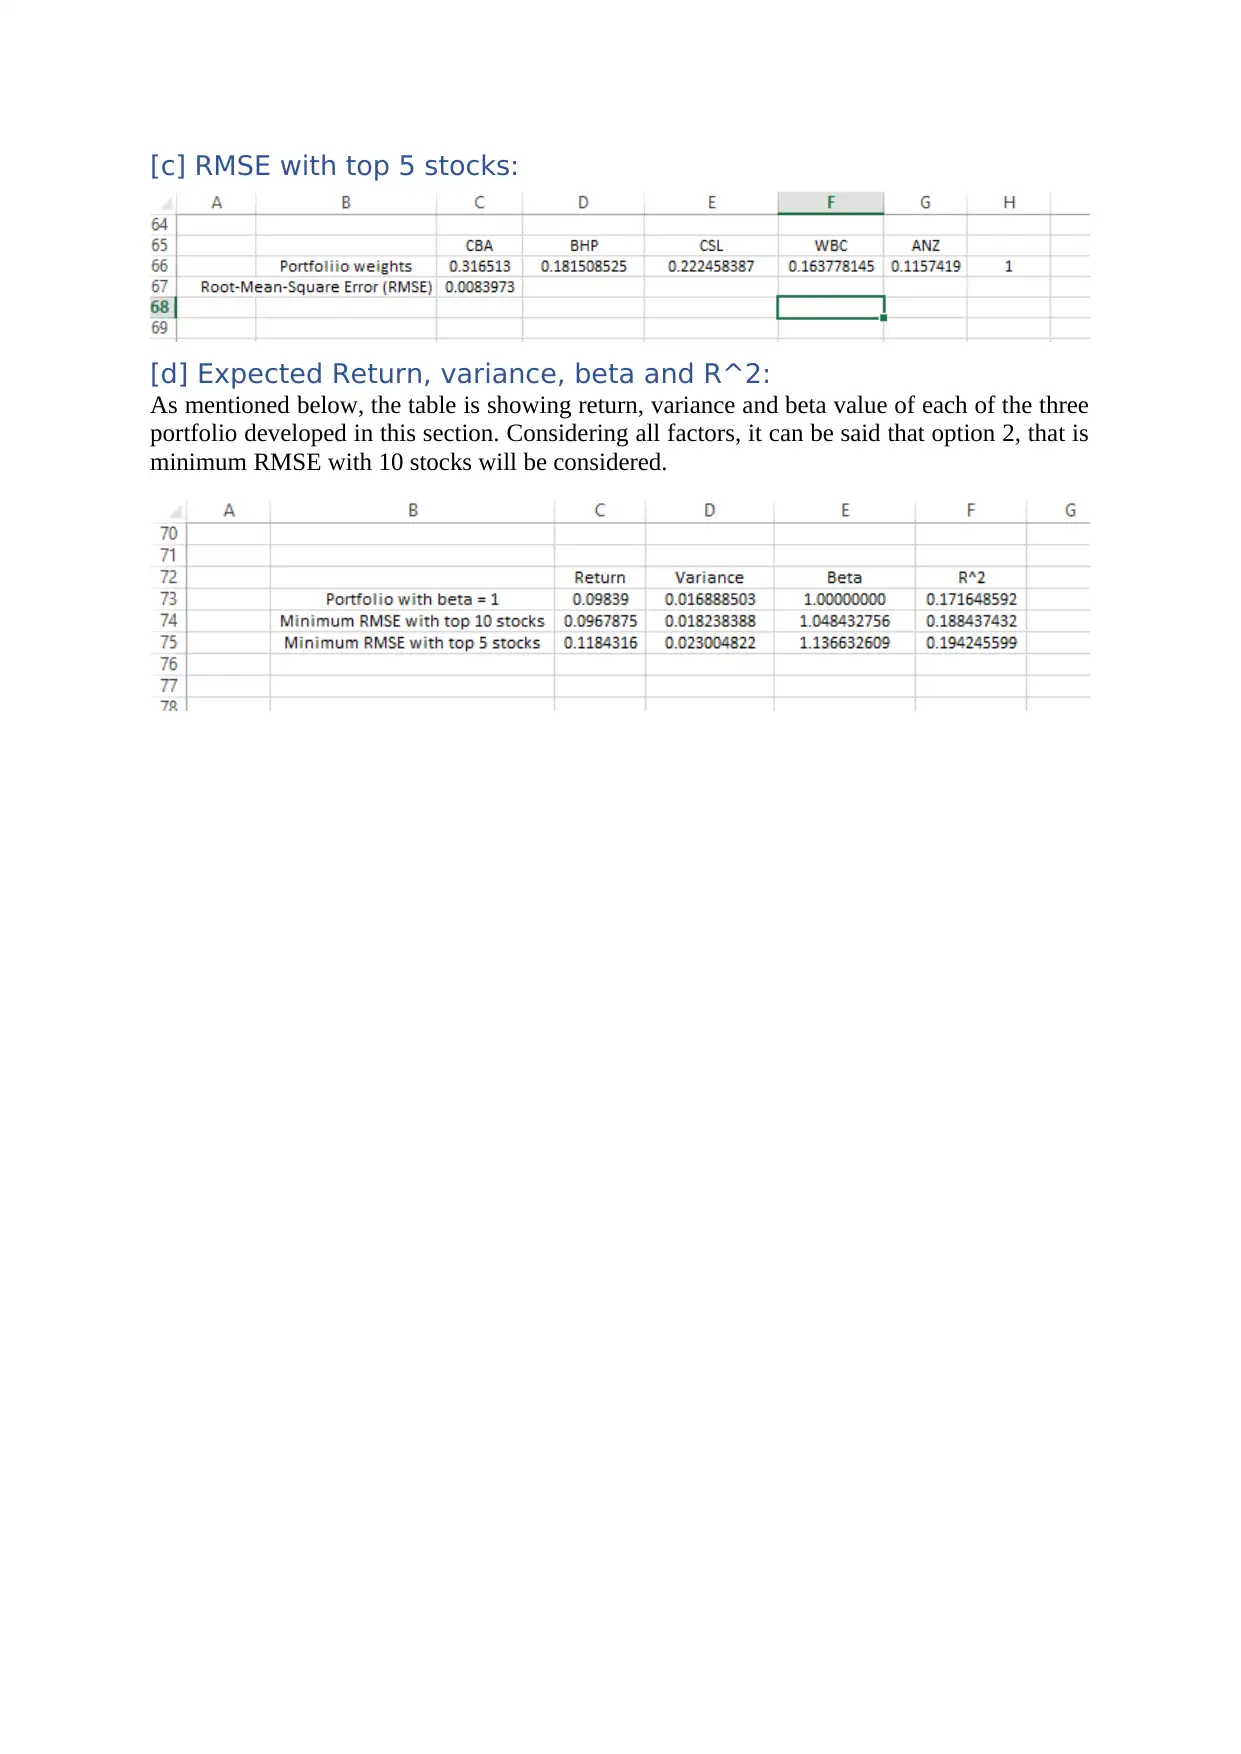
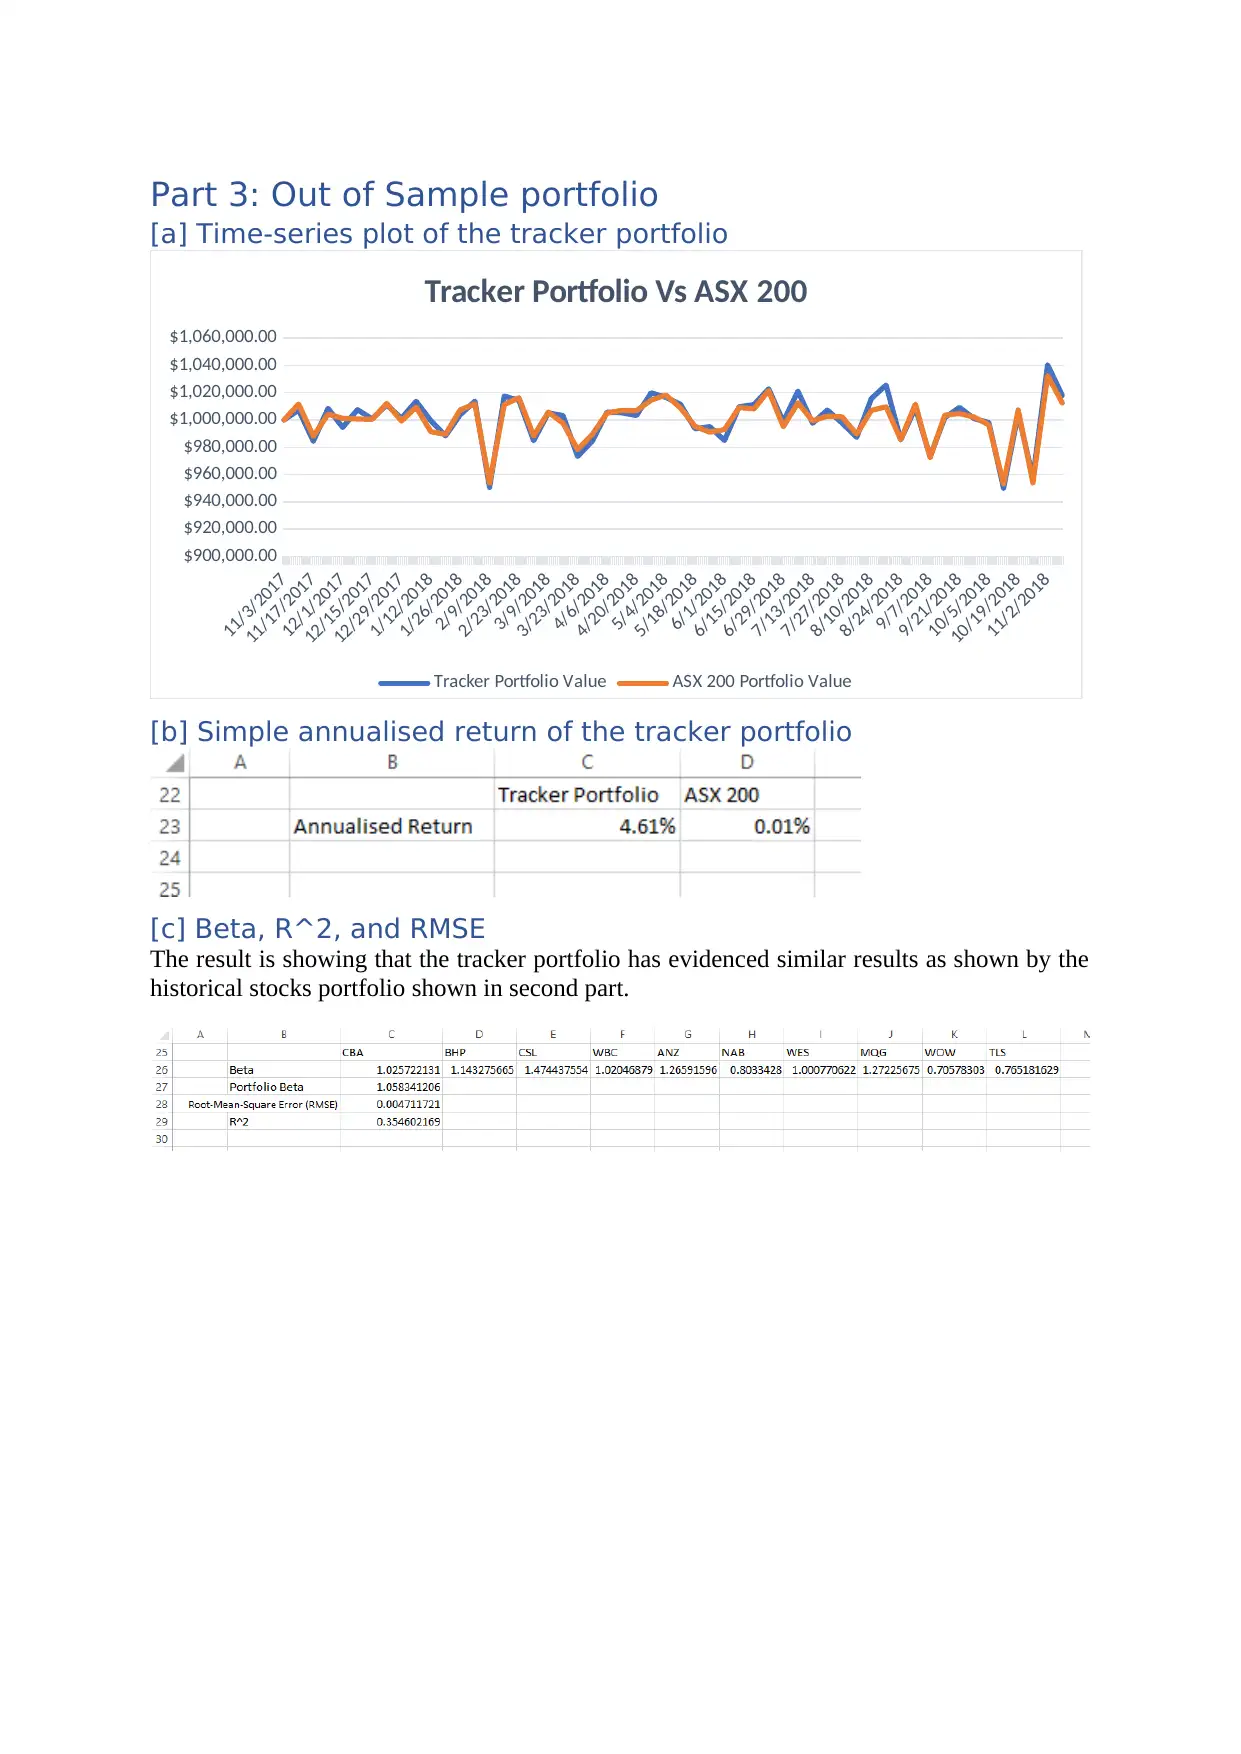
This report provides a detailed analysis of portfolio construction and performance, focusing on key aspects such as weekly returns, expected returns, variance-covariance matrix, portfolio beta, and total risks. It evaluates the Capital Market Line (CML) and Security Market Line (SML) to identify overvalued and undervalued stocks. The report also explores advanced portfolio strategies, including constructing a portfolio with a beta of 1 and minimizing the Root-Mean-Square Error (RMSE) to track the ASX200 index. Furthermore, it examines an out-of-sample tracker portfolio, assessing its annualized return, beta, R^2, and RMSE, comparing its performance against historical stock portfolios. The analysis leverages tools like MS Excel and solver models to optimize portfolio weights and minimize errors, providing a comprehensive evaluation of investment strategies and risk management.
Document Page
25503 Investment Analysis
Assignment |Part II
Summer 2018
tabler-icon-diamond-filled.svg

Paraphrase This Document

Need a fresh take? Get an instant paraphrase of this document with our AI Paraphraser
Document Page
Table of Contents
Part 1: Portfolio Construction....................................................................................................3
[a] Weekly Return..................................................................................................................3
[b] Expected Return and Variance- Covariance Matrix.........................................................3
[c] Portfolio beta.....................................................................................................................3
[d] Total Risks........................................................................................................................3
[e] Capital Market Line (CML):.............................................................................................4
[f] Security Market Line (SML):............................................................................................5
Part 2: Advanced Portfolio.........................................................................................................7
[a] Portfolio with beta = 1......................................................................................................7
[b] Root-Mean-Square Error (RMSE)....................................................................................8
[c] RMSE with top 5:.............................................................................................................9
[d] Expected Return, variance, beta and R^2:........................................................................9
Part 3: Out of Sample portfolio................................................................................................10
[a] Time-series plot of the tracker portfolio.........................................................................10
[b] Simple annualised return of the tracker portfolio...........................................................10
[c] Beta, R^2, and RMSE.....................................................................................................10
Document Page
Part 1: Portfolio Construction
[a] Weekly Return
[b] Expected Return and Variance- Covariance Matrix
[c] Portfolio beta
[d] Total Risks
Document Page
[e] Capital Market Line (CML):
0.1 0.12 0.14 0.16 0.18 0.2 0.22 0.24 0.26 0.28 0.3
0
0.05
0.1
0.15
0.2
0.25
0.3
TLS WOW
MQG
WES
NAB
ANZWBC
CSL
BHP
CBA
Capital Market Line
Portfolio Stdev
Portfolio Return
tabler-icon-diamond-filled.svg

Paraphrase This Document

Need a fresh take? Get an instant paraphrase of this document with our AI Paraphraser
Document Page
[f] Security Market Line (SML):
0 0.2 0.4 0.6 0.8 1 1.2 1.4 1.6 1.8
0
0.05
0.1
0.15
0.2
0.25
0.3
NAB
TLS WOW
MQG
WES
ANZ
WBC
CSL
BHP
CBA
Security Market Line
Portfolio Beta
Portfolio Return
Based on the above mentioned SML, below stocks will be considered as overvalued or
undervalued:
Stocks
Overvalued/
Undervalued
CBA Overvalued
BHP Overvalued
CSL Undervalued
WBC Overvalued
ANZ Overvalued
NAB Overvalued
WES Overvalued
MQG Overvalued
Document Page
WOW Overvalued
TLS Overvalued
Document Page
Part 2: Advanced Portfolio
[a] Portfolio with beta = 1
If a portfolio has a beta of 1, then it is fully diversified to the market. This means that for
every 1% the stock market goes up or down, the portfolio will also go up or down by 1%. In
order to find out the portfolio of 10 stocks, whose beta is equivalent to 1, MS Excel solver
has been applied here. First of all, individual stock’s beta and return has been considered here
and the portfolio beta is calculated using the below mentioned formula:
Portfolio beta = wi; i = 1,2,3, …., 10
Where wi is weights of individual stock and is individual stock’s beta value. The below
solver model is developed for calculating weights of individual stock:
Running the model below solution has been found:
tabler-icon-diamond-filled.svg

Paraphrase This Document

Need a fresh take? Get an instant paraphrase of this document with our AI Paraphraser
Document Page
[b] Root-Mean-Square Error (RMSE)
Unlike above, to find out the Root-Mean-Square Error (RMSE) of the difference in weekly
returns between the portfolio and theASX200 index, MS Excel is used as mentioned below:
Microsoft excel sumproduct function used to find out the error term. After that using sum and
SQRT function, the root mean square error is calculated. Once the RMSE has been calculated
excel solver is used to minimise the RMSE value. The model that has been built here is
mentioned as below:
The model has given below solution:
From this solution, it can be said that the minimum RMSE is 0.0054642
Document Page
[c] RMSE with top 5 stocks:
[d] Expected Return, variance, beta and R^2:
As mentioned below, the table is showing return, variance and beta value of each of the three
portfolio developed in this section. Considering all factors, it can be said that option 2, that is
minimum RMSE with 10 stocks will be considered.
Document Page
Part 3: Out of Sample portfolio
[a] Time-series plot of the tracker portfolio
11/3/2017
11/17/2017
12/1/2017
12/15/2017
12/29/2017
1/12/2018
1/26/2018
2/9/2018
2/23/2018
3/9/2018
3/23/2018
4/6/2018
4/20/2018
5/4/2018
5/18/2018
6/1/2018
6/15/2018
6/29/2018
7/13/2018
7/27/2018
8/10/2018
8/24/2018
9/7/2018
9/21/2018
10/5/2018
10/19/2018
11/2/2018
$900,000.00
$920,000.00
$940,000.00
$960,000.00
$980,000.00
$1,000,000.00
$1,020,000.00
$1,040,000.00
$1,060,000.00
Tracker Portfolio Vs ASX 200
Tracker Portfolio Value ASX 200 Portfolio Value
[b] Simple annualised return of the tracker portfolio
[c] Beta, R^2, and RMSE
The result is showing that the tracker portfolio has evidenced similar results as shown by the
historical stocks portfolio shown in second part.
chevron_up_icon
1 out of 10
circle_padding
hide_on_mobile
zoom_out_icon
[object Object]