Financial Management Report: Financial Analysis of Outdoors PLC
VerifiedAdded on 2020/01/23
|17
|5347
|37
Report
AI Summary
This report offers a detailed financial analysis of Outdoors PLC, focusing on key aspects of financial management. It begins with an introduction to financial management and its significance in fund allocation and investment decisions. The report then delves into the organization's performance through ratio analysis, evaluating liquidity, profitability, debt-equity, and asset management ratios to assess Outdoors PLC's financial position. Furthermore, it explores investment appraisal techniques, specifically net present value (NPV) and internal rate of return (IRR), along with decision-making tools for optimal investment strategies. The report also examines financial sources and the decision-making process for adequate investment, concluding with a comprehensive overview of the financial management tools and their impact on Outdoors PLC's expansion and operational efficiency.

Financial
Management
1
Management
1
Paraphrase This Document
Need a fresh take? Get an instant paraphrase of this document with our AI Paraphraser
Table of Contents
INTRODUCTION...........................................................................................................................3
A) ORGANIZATION'S PERFORMANCE THROUGH RATIO ANALYSIS..............................3
B) INVESTMENT APPRAISAL TECHNIQUES AND DECISION MAKING TOOLS.............7
a) Net present value (NPV)..........................................................................................................7
b) Internal rate of return (IRR).....................................................................................................9
c) Data interpretation and results for management....................................................................11
d) Optimal investment policy.....................................................................................................12
C) FINANCIAL SOURCES AND DECISION MAKING PROCESS FOR ADEQUATE
INVESTMENT..............................................................................................................................13
CONCLUSION..............................................................................................................................15
REFERENCE.................................................................................................................................16
2
INTRODUCTION
Financial management is one of the main approach that is helpful for fund allocation
impacts on profitability of organization. It is related to making decisions for investment and
getting sources for business operations. The present report is based on understanding financial
management tools of outdoors plc including ratio analysis and different investment appraisal
techniques. However, several kinds of ratios involving liquidity, profitability, debt equity and all
that presents organization's performance effectively. In addition to this, several tools and
techniques for expansion of firm, increasing internet sales as well producing greenhouses and
conservatories are to be described through this assignment. Moreover, net present value and
internal rate of return is to expressed. Along with this, different decision making tools are to be
obtained for appropriate investment. Hence, students are able to understand significance of
financial management of expansion of outdoors plc and enhancing this efficiency through this
report.
A) ORGANIZATION'S PERFORMANCE THROUGH RATIO ANALYSIS
It is a form of financial statement analysis that is used to measure or to find the financial
position of the organization. Ratio analysis have several categories i.e. debt management ratio,
asset management ratio, market value ratio, short term solvency ratio. In other words we can say
that it evaluate various aspects of operating and financial liquidity, profitability, efficiency and
solvency. It is based on accounting information (Adrian, Etula and Muir, 2014). It is the first step
in the financial analysis. It helps to compare organizations financial performance with industry
average. It helps to find out the relationship between two variables or figure.
However, ratio analysis is financial component that presents overall performance of
business organization. Including this, different kinds of ratios are determined that evaluates
liquidity, profitability, debt equity and all for making decisions regarding further business
operations. Including this, comparison of last years financial positions is compared therefore,
appropriate decisions can be made to operate business activities in future time. According to this
given case scenario, outdoors plc aims to expand its flourishing retail outlet, develop into interest
sales and producing greenhouses and conservatives (Andréadès, 2013). Therefore, it is required
3
⊘ This is a preview!⊘
Do you want full access?
Subscribe today to unlock all pages.
Trusted by 1+ million students worldwide
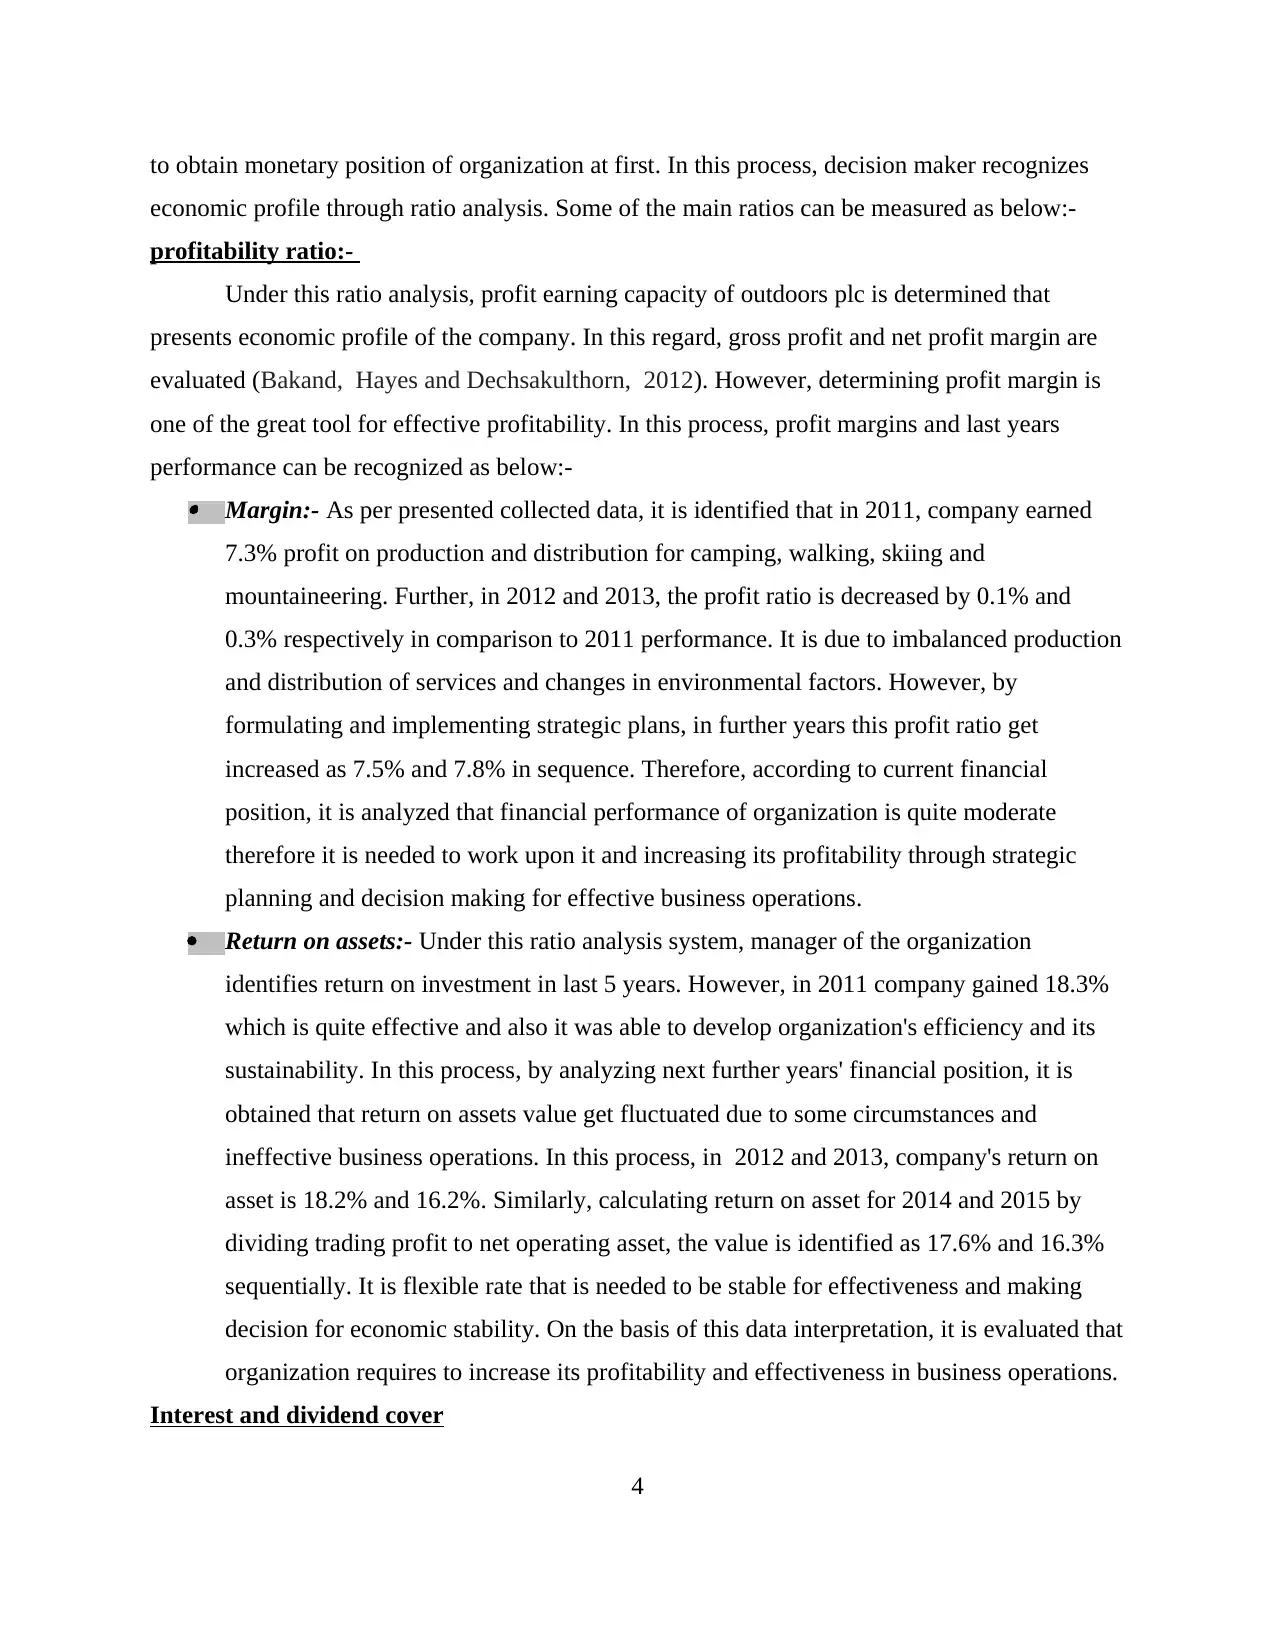
to obtain monetary position of organization at first. In this process, decision maker recognizes
economic profile through ratio analysis. Some of the main ratios can be measured as below:-
profitability ratio:-
Under this ratio analysis, profit earning capacity of outdoors plc is determined that
presents economic profile of the company. In this regard, gross profit and net profit margin are
evaluated (Bakand, Hayes and Dechsakulthorn, 2012). However, determining profit margin is
one of the great tool for effective profitability. In this process, profit margins and last years
performance can be recognized as below:- Margin:- As per presented collected data, it is identified that in 2011, company earned
7.3% profit on production and distribution for camping, walking, skiing and
mountaineering. Further, in 2012 and 2013, the profit ratio is decreased by 0.1% and
0.3% respectively in comparison to 2011 performance. It is due to imbalanced production
and distribution of services and changes in environmental factors. However, by
formulating and implementing strategic plans, in further years this profit ratio get
increased as 7.5% and 7.8% in sequence. Therefore, according to current financial
position, it is analyzed that financial performance of organization is quite moderate
therefore it is needed to work upon it and increasing its profitability through strategic
planning and decision making for effective business operations.
Return on assets:- Under this ratio analysis system, manager of the organization
identifies return on investment in last 5 years. However, in 2011 company gained 18.3%
which is quite effective and also it was able to develop organization's efficiency and its
sustainability. In this process, by analyzing next further years' financial position, it is
obtained that return on assets value get fluctuated due to some circumstances and
ineffective business operations. In this process, in 2012 and 2013, company's return on
asset is 18.2% and 16.2%. Similarly, calculating return on asset for 2014 and 2015 by
dividing trading profit to net operating asset, the value is identified as 17.6% and 16.3%
sequentially. It is flexible rate that is needed to be stable for effectiveness and making
decision for economic stability. On the basis of this data interpretation, it is evaluated that
organization requires to increase its profitability and effectiveness in business operations.
Interest and dividend cover
4
Paraphrase This Document
Need a fresh take? Get an instant paraphrase of this document with our AI Paraphraser
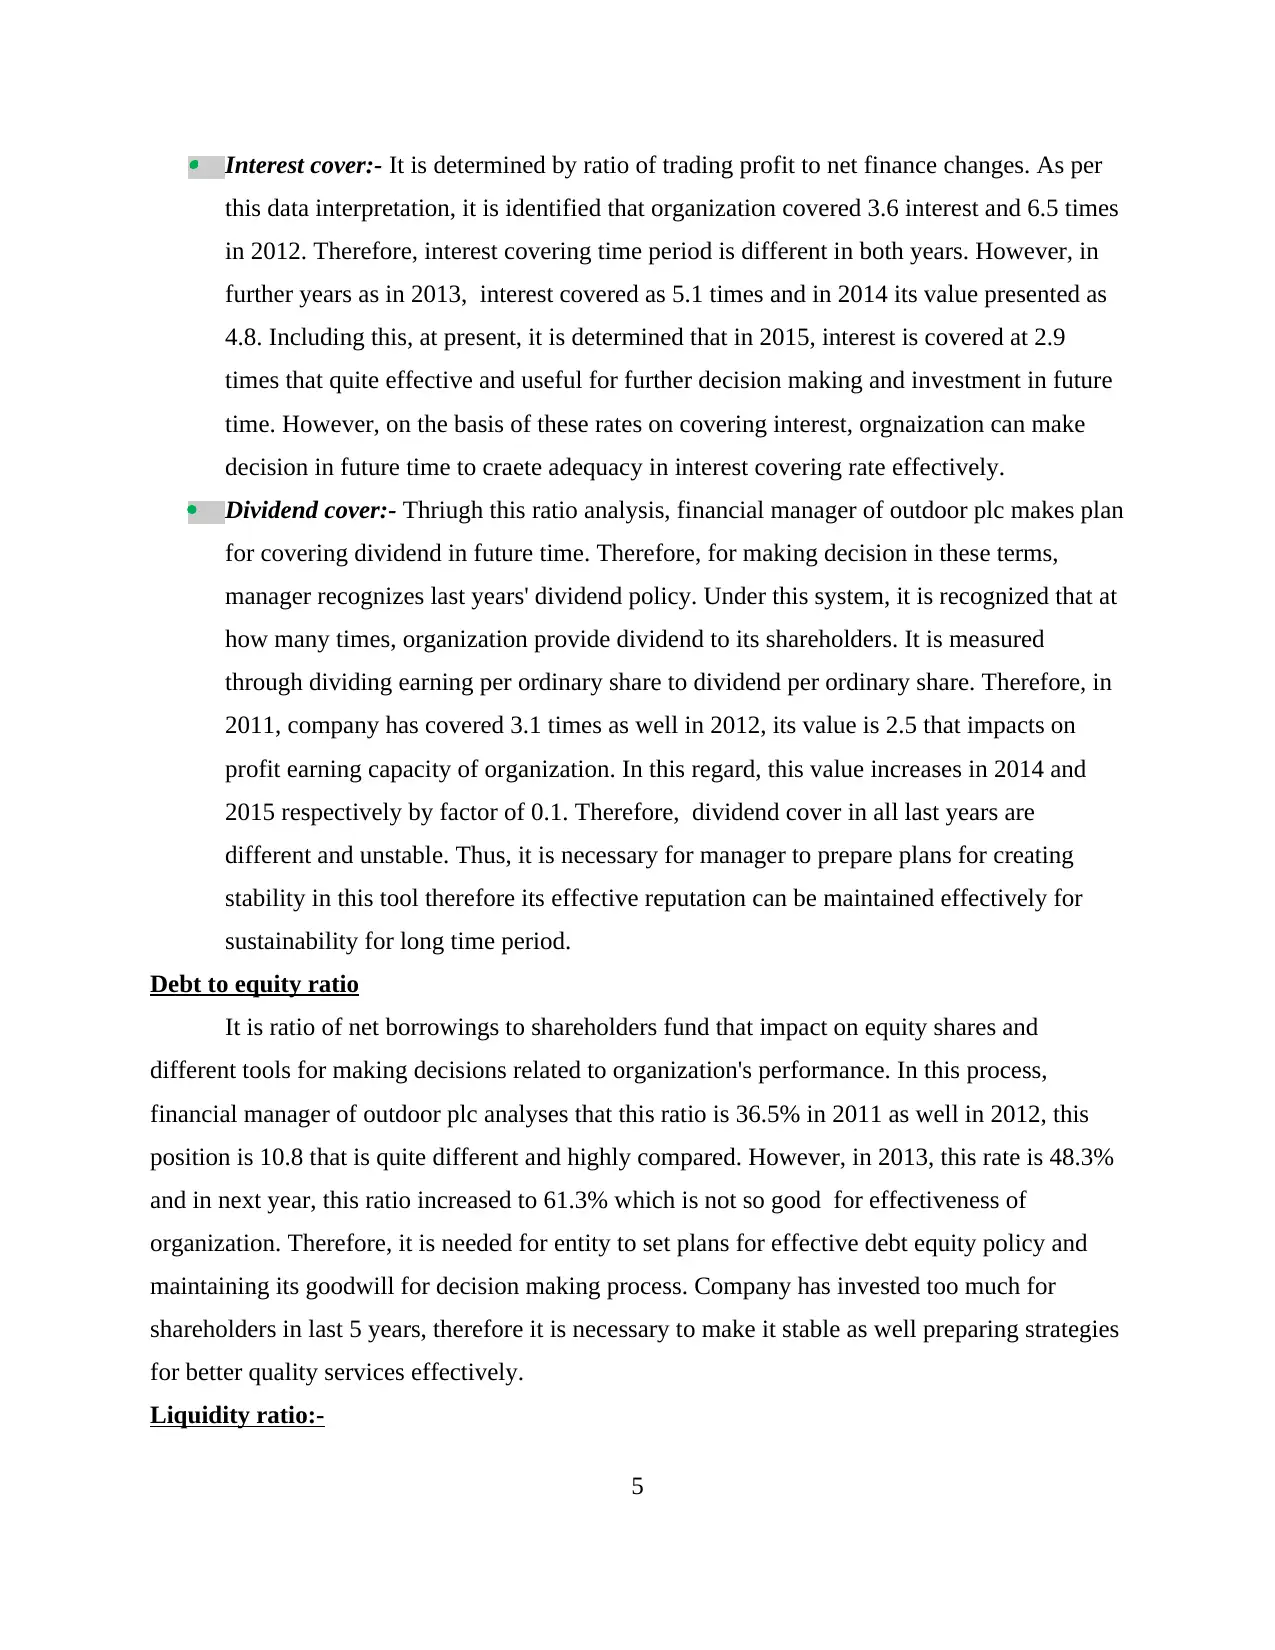
Interest cover:- It is determined by ratio of trading profit to net finance changes. As per
this data interpretation, it is identified that organization covered 3.6 interest and 6.5 times
in 2012. Therefore, interest covering time period is different in both years. However, in
further years as in 2013, interest covered as 5.1 times and in 2014 its value presented as
4.8. Including this, at present, it is determined that in 2015, interest is covered at 2.9
times that quite effective and useful for further decision making and investment in future
time. However, on the basis of these rates on covering interest, orgnaization can make
decision in future time to craete adequacy in interest covering rate effectively.
Dividend cover:- Thriugh this ratio analysis, financial manager of outdoor plc makes plan
for covering dividend in future time. Therefore, for making decision in these terms,
manager recognizes last years' dividend policy. Under this system, it is recognized that at
how many times, organization provide dividend to its shareholders. It is measured
through dividing earning per ordinary share to dividend per ordinary share. Therefore, in
2011, company has covered 3.1 times as well in 2012, its value is 2.5 that impacts on
profit earning capacity of organization. In this regard, this value increases in 2014 and
2015 respectively by factor of 0.1. Therefore, dividend cover in all last years are
different and unstable. Thus, it is necessary for manager to prepare plans for creating
stability in this tool therefore its effective reputation can be maintained effectively for
sustainability for long time period.
Debt to equity ratio
It is ratio of net borrowings to shareholders fund that impact on equity shares and
different tools for making decisions related to organization's performance. In this process,
financial manager of outdoor plc analyses that this ratio is 36.5% in 2011 as well in 2012, this
position is 10.8 that is quite different and highly compared. However, in 2013, this rate is 48.3%
and in next year, this ratio increased to 61.3% which is not so good for effectiveness of
organization. Therefore, it is needed for entity to set plans for effective debt equity policy and
maintaining its goodwill for decision making process. Company has invested too much for
shareholders in last 5 years, therefore it is necessary to make it stable as well preparing strategies
for better quality services effectively.
Liquidity ratio:-
5
This ratio analysis is effective to present liquidity position of outdoor plc. In this process,
different ratios including quick and current ratio are determined to present organization's
performance as well making decisions on behalf of this ratio analysis component. Quick ratio:- It is evaluated through ratio formula of [(current assets-stock)/ current
liability]. Under this ratio analysis system, different performance of organization is
recognized for last 5 years such in 2011, this this value is 0.93% and in 2012, its value is
1.13% that is quite moderate for effectiveness of organization. Further, in 2013, this ratio
is obtained as 0.78% and in 2014 ratio is analyzed as 0.73%. Similarly, in 2015, this ratio
is measured as 1.34% thus it is needed for organization to focus on liquidity and cash
reserve at organization so that effective plans can be created in future time for its
expansion and increasing selling of goods efficiently. However, proper management of
all organization's products can be gained through this analysis is useful for improving its
efficiency at high level.
Current ratio:- This ratio presents actual liquidity and profitability of organization that
impacts on productivity and profit earning capacity in future time. It is evaluated in
percentage as a fraction of current assets to current liabilities of the organization. In this
process, in 2011, current ratio was 1.75:1 and in 2012, it was 1.79:1 that was quite
effective because of balanced production and distribution system of products produced by
firm. In this regard, current ratio for further yaers as 2013, 2014 and 2015 is 1.42:1,
1.30:1 and 1.34:1 that is related to making decisions for effectiveness and making
decisions for improving its efficiency at higth level. It is considered that an ideal current
ratio for any organization is 2:1. Therefore, to reach out this ideal ratio, it is needed for
manager to prepare strategy and making decisions in future time through creating balance
of current assets and current liability. However, strategic management and proper fund
allocation can be gained through this process system effectively.
Asset ratio
It is also known as efficiency ratio that includes operating asset turnover and working
capital turnover that impacts on assets quality of organization. However, both of these ratios'
analysis for last years' performance can be expressed as below:-
6
⊘ This is a preview!⊘
Do you want full access?
Subscribe today to unlock all pages.
Trusted by 1+ million students worldwide
Operating asset turnover:- It is evaluated by dividing sales to net operating assets to
analyse organization's performance. In this process, in 2011 and 2012, this values are
similar as 2.5 times however in further this ratio get fluctuated in 2013 and in 2014 as
2.3 times and 2.4 times. In addition to this, this rate is 2.1 times in 2015 that is needed
to be focused in future time for effectiveness of organization as well making decisions
for improving its efficiency in systematic manner.
Working capital turnover:- This ratio presnts efficiency of organization measured as a
fraction of sales to wroaking capital presented in times. Therefore, in 2011, its position is
6.2 times as well in 2012 this value is 7.4 times that presents working efficiency of
organization to make place and selling its goods. However, in 2013 and 2014, these
values are 7 and 8 times that increased in 2015 by 0.6 times. Thus, it is necessary for
manager of organization to focus on this factor critically therefore further implementation
can be achieved effectively.
Per share
It includes different per share ratios including earning per share, dividend per share and
net assets. Therefore, in different years, these ratios are compared in various ways that leads to
make decisions in further year. However, in 2015, earning, dividend and net asset per sahre are
15.65p, 5.90 p and 102.10p that imapcts on organization's efficiency and its goodwill to sustain
its reputation in future time.
B) INVESTMENT APPRAISAL TECHNIQUES AND DECISION MAKING
TOOLS
a) Net present value (NPV)
Net present value is the difference between the present value of cash inflows and the
present value of cash outflows. The values of the money in hand is more than the same amount
of money in the future. It is calculated on the basis of the cost of capital and the risk involved the
investment or the project. There are some Advantages and disadvantages of net present value.
Time value is the first advantage of the net present value of money (Bartram, Brown and Waller,
2016). The value of the money changes many a time, especially during the inflation or deflation.
It is not fix that the value at present of money will remain same in the future. Ranking capability
7
Paraphrase This Document
Need a fresh take? Get an instant paraphrase of this document with our AI Paraphraser
is the second advantage of the net present value. It has the ability to compare the two different
projects so that the decision can be made which project to select to have more return. It
calculates and evaluate the value of the project. It prefers each cash receipts and the cash
payments and the value of the money at the time of the transaction. The organization select the
highest net present value projects. The disadvantage of the net present value is that it requires
company to perform more complex calculations (Battiston and et.al., 2016). Business need to
calculate each transaction of cash during the project. Organization have to use the numeric tables
that provides various types of interest rates of various time period. It uses the assumptions it's the
another disadvantage for the organizations. The organization have to make the assumptions to
the value of the amount and the time value of the future. Firms also need to calculate and assume
the interest rate for the running duration of the project. Assumptions are not fix, it is just used to
take and estimate for the calculation. Inaccurate calculation of assumption leads to inaccurate
calculation of net present value. However, net present value can be estimated for further
investment as:-
A B C
Initial investment
(Cash outflow) 75000 PV 120000 PV 200000 PV
Cash inflow (1`st
year) 40000 0.9
3636
3.63 50000 0.9 45454.5 50000 0.9 45454.54
(2nd year) 50000 0.82
4132
2.31 60000 0.8 49586.7 100000 0.82 82644.63
(3rd year) 50000 0.75
3756
5.74 80000 0.75 60105.18 150000 0.75 112697.22
(4th year) 50000 0.68
3415
0.67 100000 0.68 68301.34 150000 0.68 102452.01
Cash Flow 190000
1494
02.36 290000 223447.85 450000 343248.41
Net Present value
(NPV)
7440
2.36 103447.85 143248.41
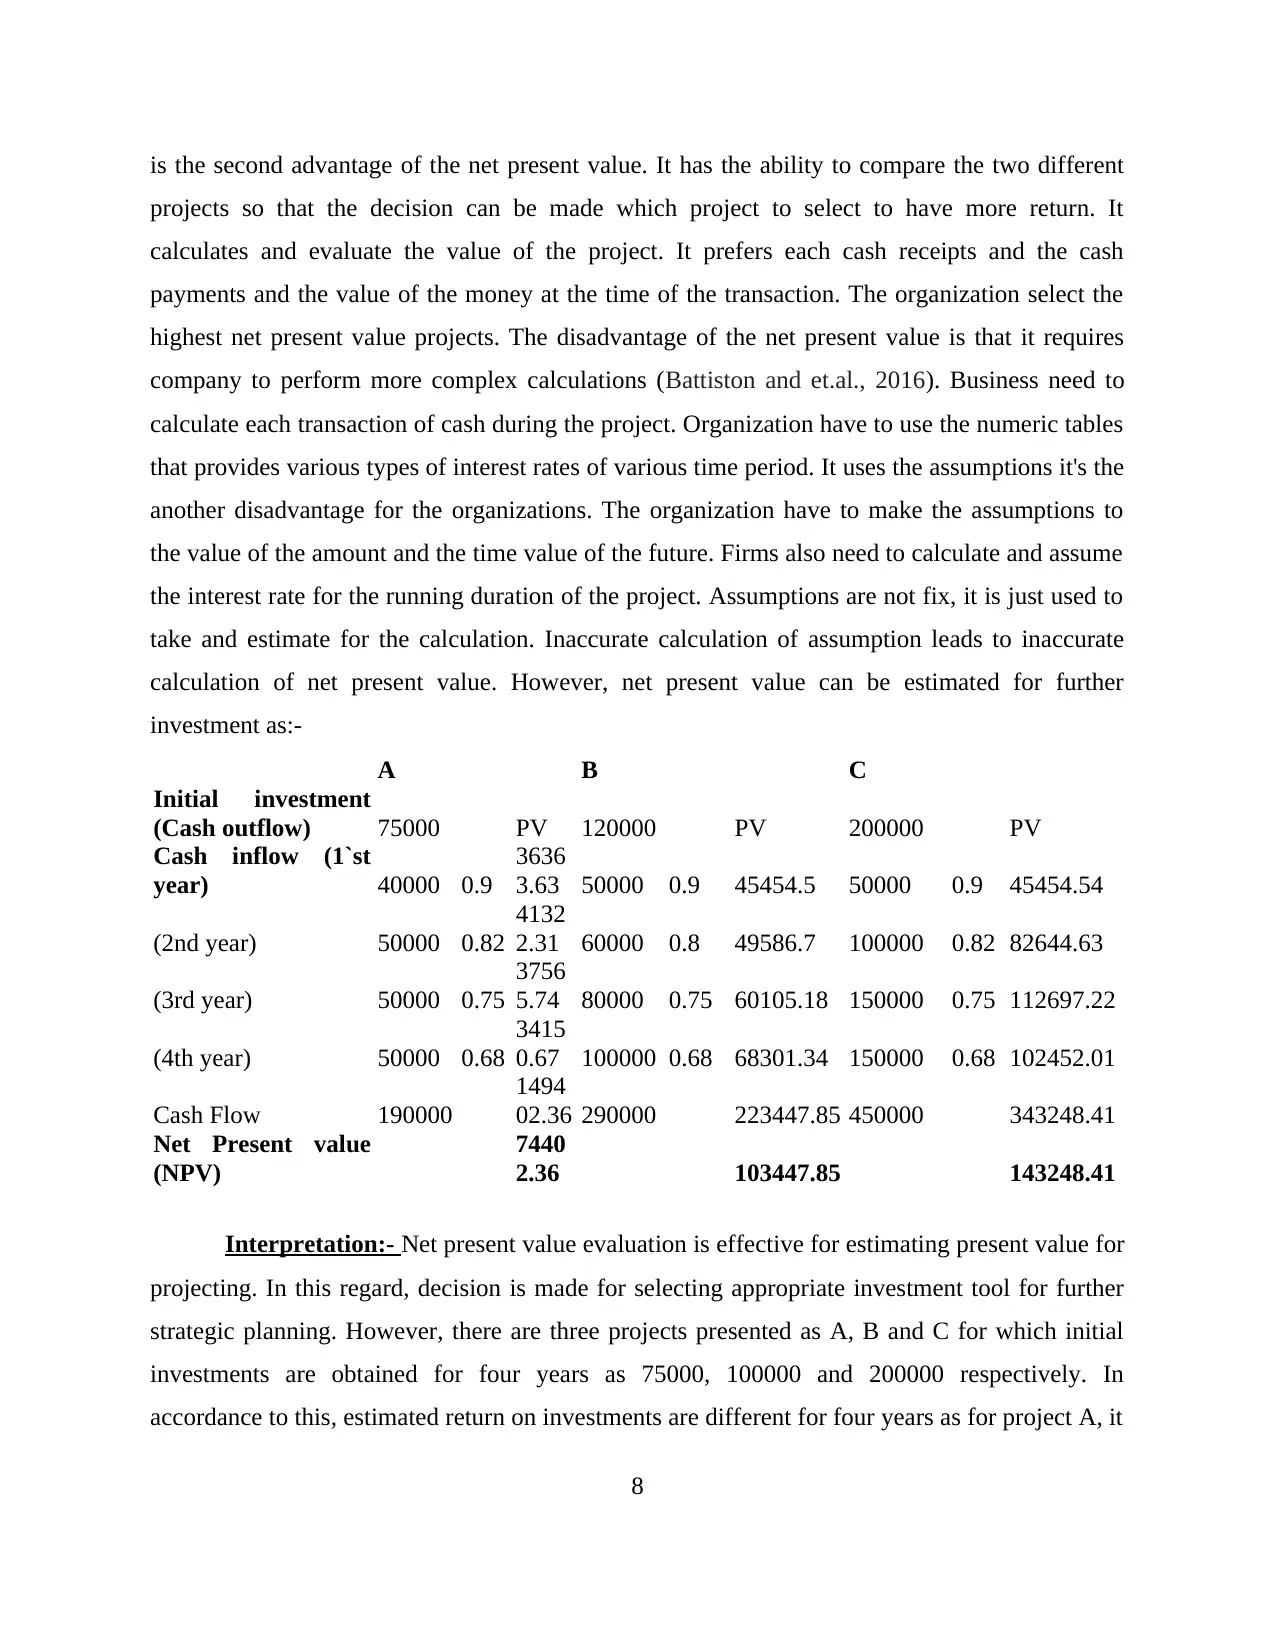
Interpretation:- Net present value evaluation is effective for estimating present value for
projecting. In this regard, decision is made for selecting appropriate investment tool for further
strategic planning. However, there are three projects presented as A, B and C for which initial
investments are obtained for four years as 75000, 100000 and 200000 respectively. In
accordance to this, estimated return on investments are different for four years as for project A, it
8
projects so that the decision can be made which project to select to have more return. It
calculates and evaluate the value of the project. It prefers each cash receipts and the cash
payments and the value of the money at the time of the transaction. The organization select the
highest net present value projects. The disadvantage of the net present value is that it requires
company to perform more complex calculations (Battiston and et.al., 2016). Business need to
calculate each transaction of cash during the project. Organization have to use the numeric tables
that provides various types of interest rates of various time period. It uses the assumptions it's the
another disadvantage for the organizations. The organization have to make the assumptions to
the value of the amount and the time value of the future. Firms also need to calculate and assume
the interest rate for the running duration of the project. Assumptions are not fix, it is just used to
take and estimate for the calculation. Inaccurate calculation of assumption leads to inaccurate
calculation of net present value. However, net present value can be estimated for further
investment as:-
A B C
Initial investment
(Cash outflow) 75000 PV 120000 PV 200000 PV
Cash inflow (1`st
year) 40000 0.9
3636
3.63 50000 0.9 45454.5 50000 0.9 45454.54
(2nd year) 50000 0.82
4132
2.31 60000 0.8 49586.7 100000 0.82 82644.63
(3rd year) 50000 0.75
3756
5.74 80000 0.75 60105.18 150000 0.75 112697.22
(4th year) 50000 0.68
3415
0.67 100000 0.68 68301.34 150000 0.68 102452.01
Cash Flow 190000
1494
02.36 290000 223447.85 450000 343248.41
Net Present value
(NPV)
7440
2.36 103447.85 143248.41
Interpretation:- Net present value evaluation is effective for estimating present value for
projecting. In this regard, decision is made for selecting appropriate investment tool for further
strategic planning. However, there are three projects presented as A, B and C for which initial
investments are obtained for four years as 75000, 100000 and 200000 respectively. In
accordance to this, estimated return on investments are different for four years as for project A, it
8
is 40000, 50000, 50000 and 50000. Similarly, for project B, estimated return cost is evaluated as
50000, 60000, 80000 and 100000. For project C, estimated investment rates are different in
further years. Therefore, on the basis of these values, net present value is measured that is
suitable for selecting best project in terms of NPV. In addition to this, cost of capital on each
project is presented as 10%. Therefore, discount rates for further 4 years are measured as 0.90,
0.82, 0.75 and 068 respectively. It is determined by the formula as [1/(1+R)^number of year].
However, to evaluate present value for each project, these values are multiplied by cash
inflow. Therefore, net present value for all three projects A, B and C are determined differently.
Moreover, total sum of present is deducted with initial investment on project so proper net
present value is identified. In this process, net present value for all of the three projects are
74402, 103447.85 and 143248.41 in sequence. Thus, project manager of organization evaluates
projecting and further makes decision on the basis of these calculations. As per analyzing this
data interpretation, project C is considered as appropriate for further investment and making
decisions for strategic planning effectively. It will able for proper projecting and implementing
quality services of outdoors plc. However, company can invest this fund for its expansion and
increasing its sales for future business operations.
b) Internal rate of return (IRR)
Internal rate of return is the interest rate at the net present value of all the cash flow
whether it is positive or negative for an investment in the project. It is a metric that is used in
capital budgeting for measuring the profitability of the investment in the project. It is the
discount rate which makes the net present value of all the cash flows equal to zero. To calculate
interest rate of return the net present value would be equal to zero. If the firm finds higher
internal rate of return to any particular project they will be willing to take the project or will try
to undertake and invest in the particular project (Benson and Davidson, 2010). Internal rate of
return ranks the project according to the higher return of the project. Internal rate of return also
refers to “economic rate of return”. Depending only using of internal rate of return can mislead
the firm. The project may have low internal rate of return but with the higher net present value.
The project many not be giving the return that was estimated. Internal rate of rate is a helpful
tool for management for making the decisions. Internal rate of return is not always equal to the
annual compound rate of return. There are some advantages and disadvantages of internal rate of
9
⊘ This is a preview!⊘
Do you want full access?
Subscribe today to unlock all pages.
Trusted by 1+ million students worldwide
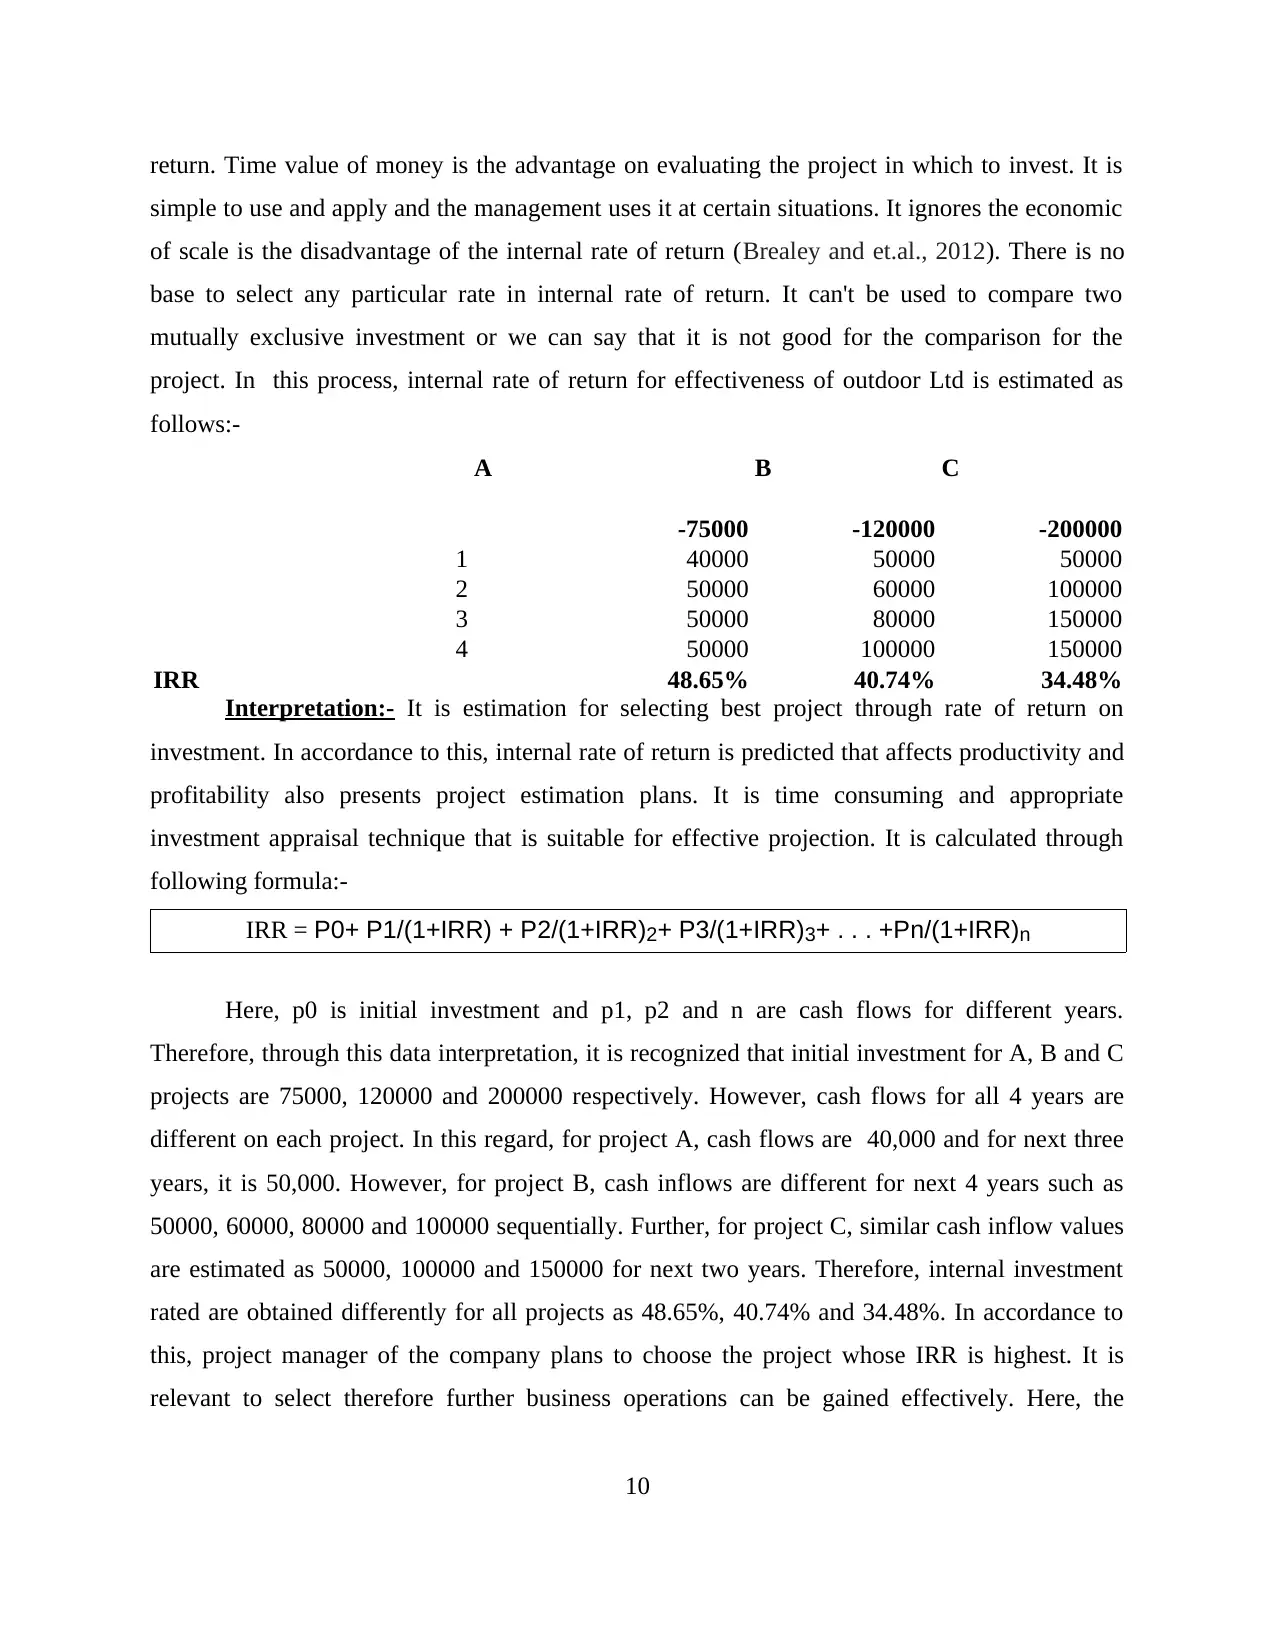
return. Time value of money is the advantage on evaluating the project in which to invest. It is
simple to use and apply and the management uses it at certain situations. It ignores the economic
of scale is the disadvantage of the internal rate of return (Brealey and et.al., 2012). There is no
base to select any particular rate in internal rate of return. It can't be used to compare two
mutually exclusive investment or we can say that it is not good for the comparison for the
project. In this process, internal rate of return for effectiveness of outdoor Ltd is estimated as
follows:-
A B C
-75000 -120000 -200000
1 40000 50000 50000
2 50000 60000 100000
3 50000 80000 150000
4 50000 100000 150000
IRR 48.65% 40.74% 34.48%
Interpretation:- It is estimation for selecting best project through rate of return on
investment. In accordance to this, internal rate of return is predicted that affects productivity and
profitability also presents project estimation plans. It is time consuming and appropriate
investment appraisal technique that is suitable for effective projection. It is calculated through
following formula:-
IRR = P0+ P1/(1+IRR) + P2/(1+IRR)2+ P3/(1+IRR)3+ . . . +Pn/(1+IRR)n
Here, p0 is initial investment and p1, p2 and n are cash flows for different years.
Therefore, through this data interpretation, it is recognized that initial investment for A, B and C
projects are 75000, 120000 and 200000 respectively. However, cash flows for all 4 years are
different on each project. In this regard, for project A, cash flows are 40,000 and for next three
years, it is 50,000. However, for project B, cash inflows are different for next 4 years such as
50000, 60000, 80000 and 100000 sequentially. Further, for project C, similar cash inflow values
are estimated as 50000, 100000 and 150000 for next two years. Therefore, internal investment
rated are obtained differently for all projects as 48.65%, 40.74% and 34.48%. In accordance to
this, project manager of the company plans to choose the project whose IRR is highest. It is
relevant to select therefore further business operations can be gained effectively. Here, the
10
Paraphrase This Document
Need a fresh take? Get an instant paraphrase of this document with our AI Paraphraser
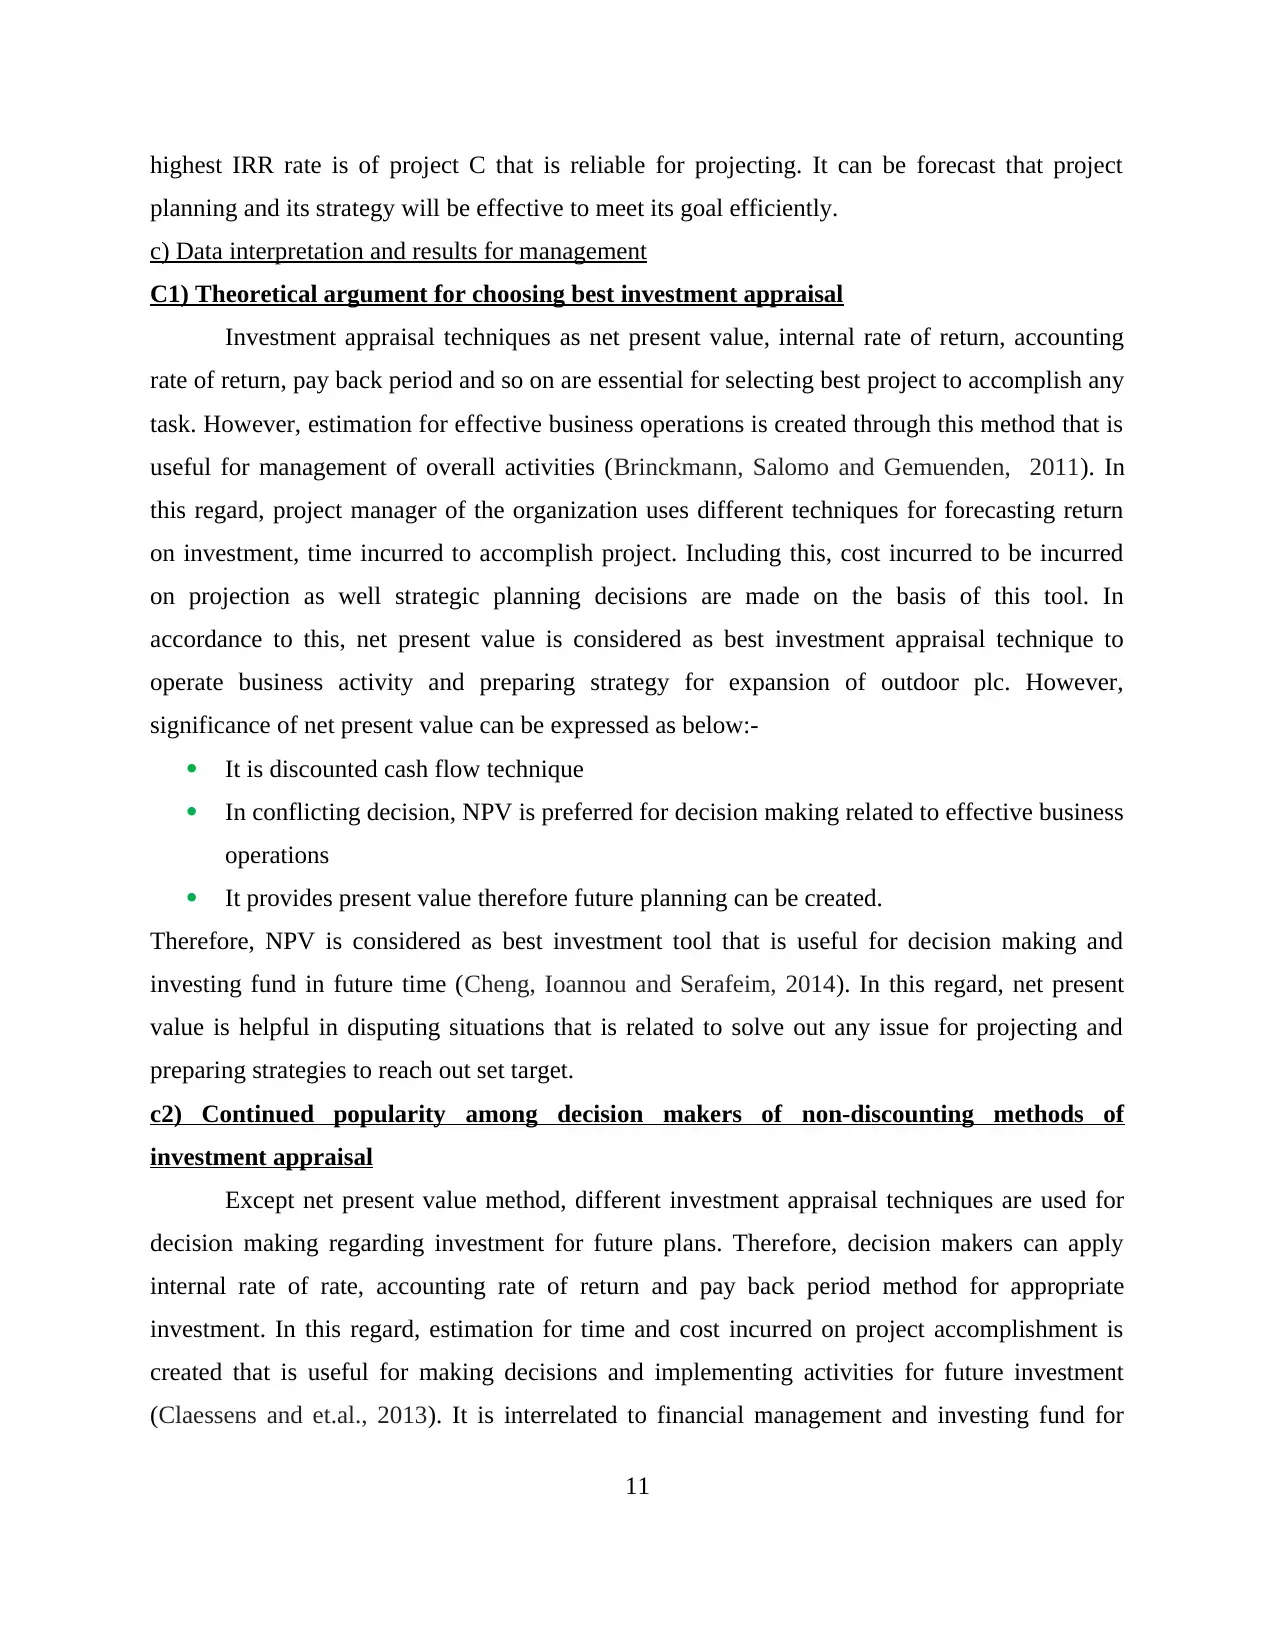
highest IRR rate is of project C that is reliable for projecting. It can be forecast that project
planning and its strategy will be effective to meet its goal efficiently.
c) Data interpretation and results for management
C1) Theoretical argument for choosing best investment appraisal
Investment appraisal techniques as net present value, internal rate of return, accounting
rate of return, pay back period and so on are essential for selecting best project to accomplish any
task. However, estimation for effective business operations is created through this method that is
useful for management of overall activities (Brinckmann, Salomo and Gemuenden, 2011). In
this regard, project manager of the organization uses different techniques for forecasting return
on investment, time incurred to accomplish project. Including this, cost incurred to be incurred
on projection as well strategic planning decisions are made on the basis of this tool. In
accordance to this, net present value is considered as best investment appraisal technique to
operate business activity and preparing strategy for expansion of outdoor plc. However,
significance of net present value can be expressed as below:-
It is discounted cash flow technique
In conflicting decision, NPV is preferred for decision making related to effective business
operations
It provides present value therefore future planning can be created.
Therefore, NPV is considered as best investment tool that is useful for decision making and
investing fund in future time (Cheng, Ioannou and Serafeim, 2014). In this regard, net present
value is helpful in disputing situations that is related to solve out any issue for projecting and
preparing strategies to reach out set target.
c2) Continued popularity among decision makers of non-discounting methods of
investment appraisal
Except net present value method, different investment appraisal techniques are used for
decision making regarding investment for future plans. Therefore, decision makers can apply
internal rate of rate, accounting rate of return and pay back period method for appropriate
investment. In this regard, estimation for time and cost incurred on project accomplishment is
created that is useful for making decisions and implementing activities for future investment
(Claessens and et.al., 2013). It is interrelated to financial management and investing fund for
11
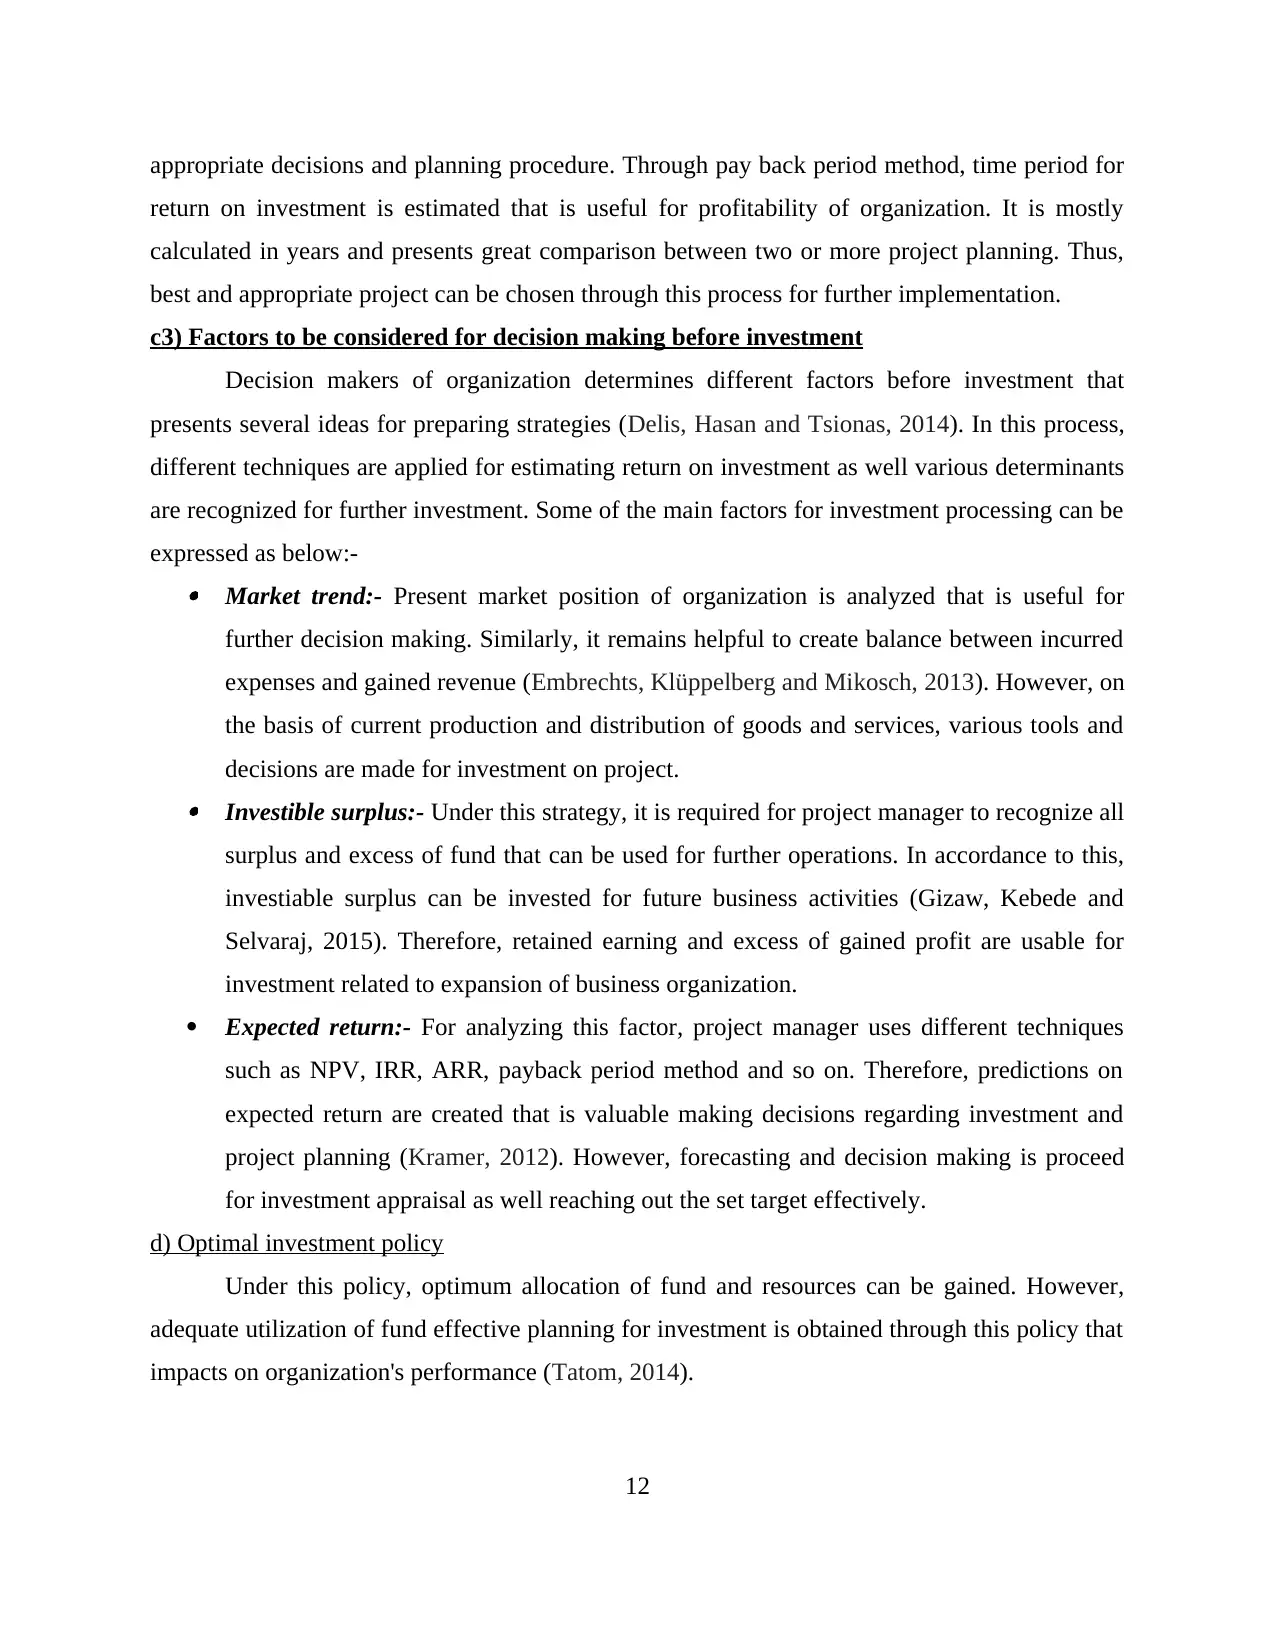
appropriate decisions and planning procedure. Through pay back period method, time period for
return on investment is estimated that is useful for profitability of organization. It is mostly
calculated in years and presents great comparison between two or more project planning. Thus,
best and appropriate project can be chosen through this process for further implementation.
c3) Factors to be considered for decision making before investment
Decision makers of organization determines different factors before investment that
presents several ideas for preparing strategies (Delis, Hasan and Tsionas, 2014). In this process,
different techniques are applied for estimating return on investment as well various determinants
are recognized for further investment. Some of the main factors for investment processing can be
expressed as below:- Market trend:- Present market position of organization is analyzed that is useful for
further decision making. Similarly, it remains helpful to create balance between incurred
expenses and gained revenue (Embrechts, Klüppelberg and Mikosch, 2013). However, on
the basis of current production and distribution of goods and services, various tools and
decisions are made for investment on project. Investible surplus:- Under this strategy, it is required for project manager to recognize all
surplus and excess of fund that can be used for further operations. In accordance to this,
investiable surplus can be invested for future business activities (Gizaw, Kebede and
Selvaraj, 2015). Therefore, retained earning and excess of gained profit are usable for
investment related to expansion of business organization.
Expected return:- For analyzing this factor, project manager uses different techniques
such as NPV, IRR, ARR, payback period method and so on. Therefore, predictions on
expected return are created that is valuable making decisions regarding investment and
project planning (Kramer, 2012). However, forecasting and decision making is proceed
for investment appraisal as well reaching out the set target effectively.
d) Optimal investment policy
Under this policy, optimum allocation of fund and resources can be gained. However,
adequate utilization of fund effective planning for investment is obtained through this policy that
impacts on organization's performance (Tatom, 2014).
12
⊘ This is a preview!⊘
Do you want full access?
Subscribe today to unlock all pages.
Trusted by 1+ million students worldwide
1 out of 17
Related Documents


Your All-in-One AI-Powered Toolkit for Academic Success.
+13062052269
info@desklib.com
Available 24*7 on WhatsApp / Email
![[object Object]](/_next/static/media/star-bottom.7253800d.svg)
Unlock your academic potential
Copyright © 2020–2026 A2Z Services. All Rights Reserved. Developed and managed by ZUCOL.