Economics Report: Financial Analysis and Investment Appraisal
VerifiedAdded on 2023/01/13
|21
|3586
|48
Report
AI Summary
This report analyzes the impact of macro and microeconomic factors on a chosen company, Mothercare PLC, examining how factors like unemployment, GDP growth, and inflation affect its financial performance. The report delves into the company's financial information, calculating and interpreting profitability, liquidity, leverage, and efficiency ratios to assess its financial health. Furthermore, the report explores investment appraisal techniques, including payback period, net present value (NPV), internal rate of return (IRR), and accounting rate of return (ARR), to evaluate potential investment opportunities for a hypothetical company, Imad's Luxury Ltd. The report concludes with recommendations to enhance the company's performance, based on the financial analysis and economic context.

REPORT ON ECONOMICS
Paraphrase This Document
Need a fresh take? Get an instant paraphrase of this document with our AI Paraphraser
EXECUTIVE SUMMARY
The report summarise about impact of macro and micro factors on chosen company's
performance. In addition financial performance of company is analysed and suitable
recommendations are given so that deficiencies can be enhanced. The end part of report
summarise about different investment appraisal techniques.
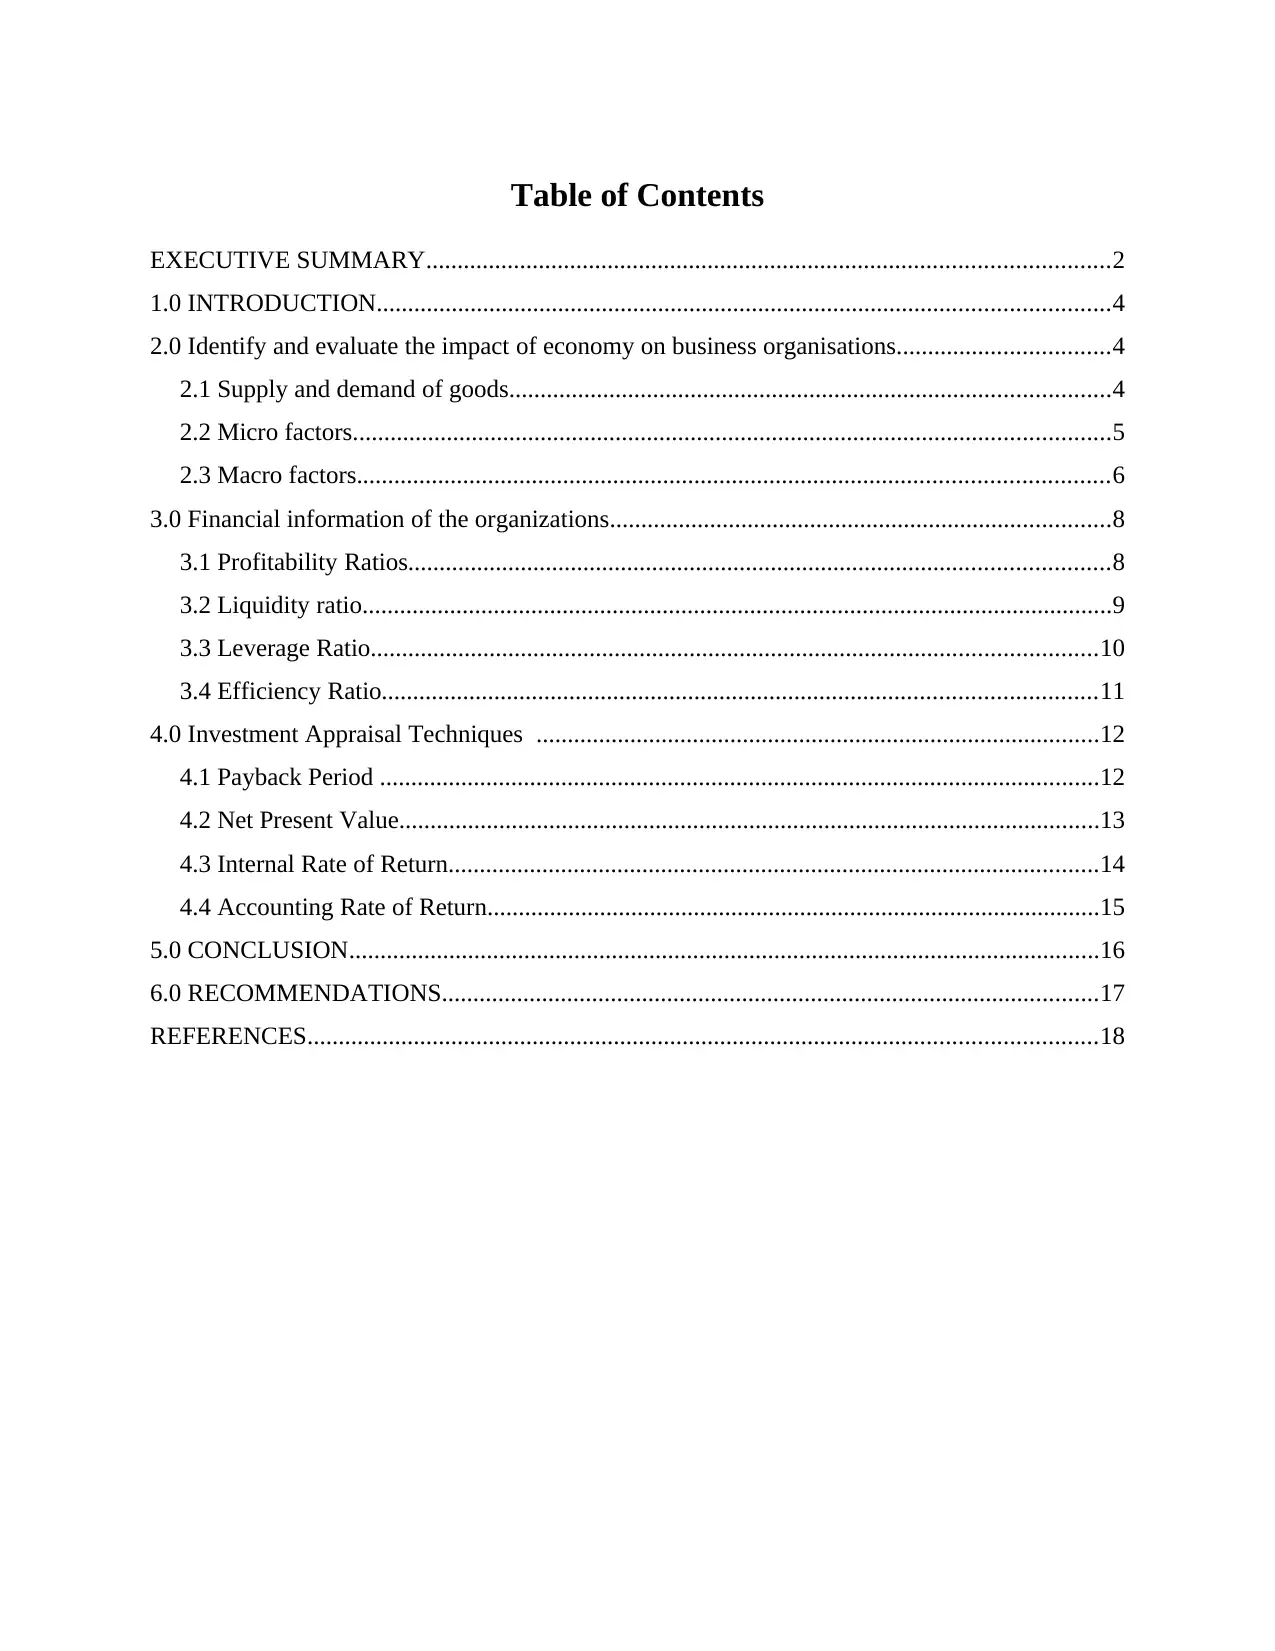
Table of Contents
EXECUTIVE SUMMARY.............................................................................................................2
1.0 INTRODUCTION.....................................................................................................................4
2.0 Identify and evaluate the impact of economy on business organisations..................................4
2.1 Supply and demand of goods................................................................................................4
2.2 Micro factors.........................................................................................................................5
2.3 Macro factors........................................................................................................................6
3.0 Financial information of the organizations................................................................................8
3.1 Profitability Ratios................................................................................................................8
3.2 Liquidity ratio........................................................................................................................9
3.3 Leverage Ratio....................................................................................................................10
3.4 Efficiency Ratio..................................................................................................................11
4.0 Investment Appraisal Techniques ..........................................................................................12
4.1 Payback Period ...................................................................................................................12
4.2 Net Present Value................................................................................................................13
4.3 Internal Rate of Return........................................................................................................14
4.4 Accounting Rate of Return..................................................................................................15
5.0 CONCLUSION........................................................................................................................16
6.0 RECOMMENDATIONS.........................................................................................................17
REFERENCES..............................................................................................................................18
⊘ This is a preview!⊘
Do you want full access?
Subscribe today to unlock all pages.
Trusted by 1+ million students worldwide
1.0 INTRODUCTION
The term economics is a key aspect of external which has a significant impact on
financial performance of business entities (Persson and Tabellini, 2016). In the project report a
company has been chosen that is Mother care plc. This company is a British retailer that provides
products for expectant mothers and for children up to 8 years. It is listed on London stock
exchange. In January 2019, Mother care plc faced that about 79 stores in UK, refused to take
products from them. The reason of this lower sales was increasing in online sales and increased
competition.
2.0 Identify and evaluate the impact of economy on business organisations.
2.1 Supply and demand of goods.
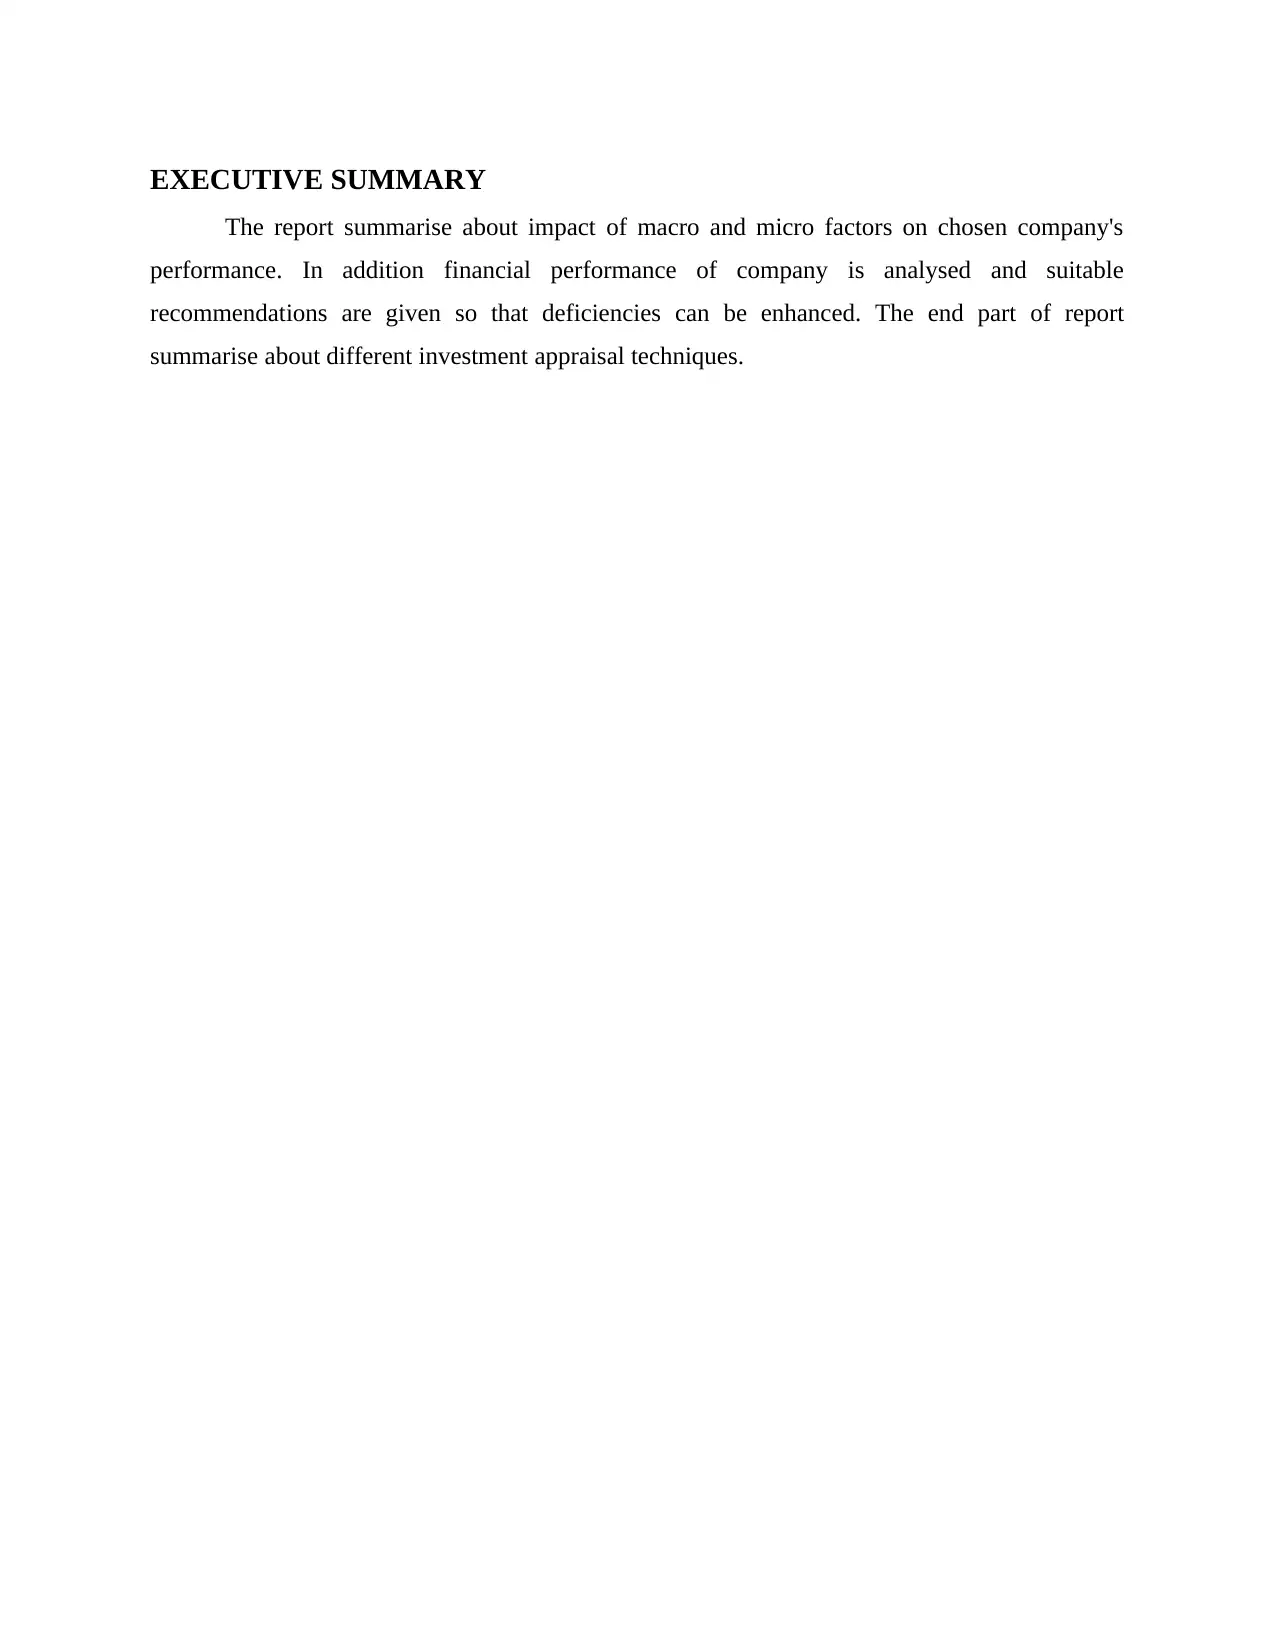
Principle of supply and demand:
Principle of supply- The supply can be defined as amount of goods and services are
available to customers. It is based on a principle which is that keeping other factors
constant, a raise in prices may lead to increase in supplied quantity. In the aspect of above
mother care plc, if price of their products will raise then supply of products will also
increase vice versa.
The term economics is a key aspect of external which has a significant impact on
financial performance of business entities (Persson and Tabellini, 2016). In the project report a
company has been chosen that is Mother care plc. This company is a British retailer that provides
products for expectant mothers and for children up to 8 years. It is listed on London stock
exchange. In January 2019, Mother care plc faced that about 79 stores in UK, refused to take
products from them. The reason of this lower sales was increasing in online sales and increased
competition.
2.0 Identify and evaluate the impact of economy on business organisations.
2.1 Supply and demand of goods.
Principle of supply and demand:
Principle of supply- The supply can be defined as amount of goods and services are
available to customers. It is based on a principle which is that keeping other factors
constant, a raise in prices may lead to increase in supplied quantity. In the aspect of above
mother care plc, if price of their products will raise then supply of products will also
increase vice versa.
Paraphrase This Document
Need a fresh take? Get an instant paraphrase of this document with our AI Paraphraser
Principle of demand- In the economics, demand can be defined as quantity of goods and services
which consumers like and able to buy at different prices during a particular time frame. Principle
of demand states that if prices of goods and services will increase then demand will decrease,
vice versa. In the aspect of above company, if they will decrease prices of products then demand
will raise.
Elasticity of demand and supply-
Elasticity of demand- It is defined as a variation in price of a product which affects the
demand. This is computed by % change in quantity demanded by % change in a variable
on that demand depends.
Elasticity of supply- This is defined as % change in prices to % change in quantity
supplied of a particular commodity.
2.2 Micro factors.
The micro factors have a significant impact on companies financial performance. In the
aspect Mother care company, these factors can affect in such manner:
Impact of immigration- In the case when there is no immigration then labour rate will be
higher and if there will be immigration then labour rate will fall down. In the aspect of
above company, they can be affected from this factor if rate of labour will fluctuate due
to higher immigration.
Number of job increases- In addition, if number of jobs increases at the time of
immigration then labour force will be agree to do job at lower rate (Sahlins, 2017). In the
Mother care company, they can fulfil their vacant posts in the case when there is
immigration.
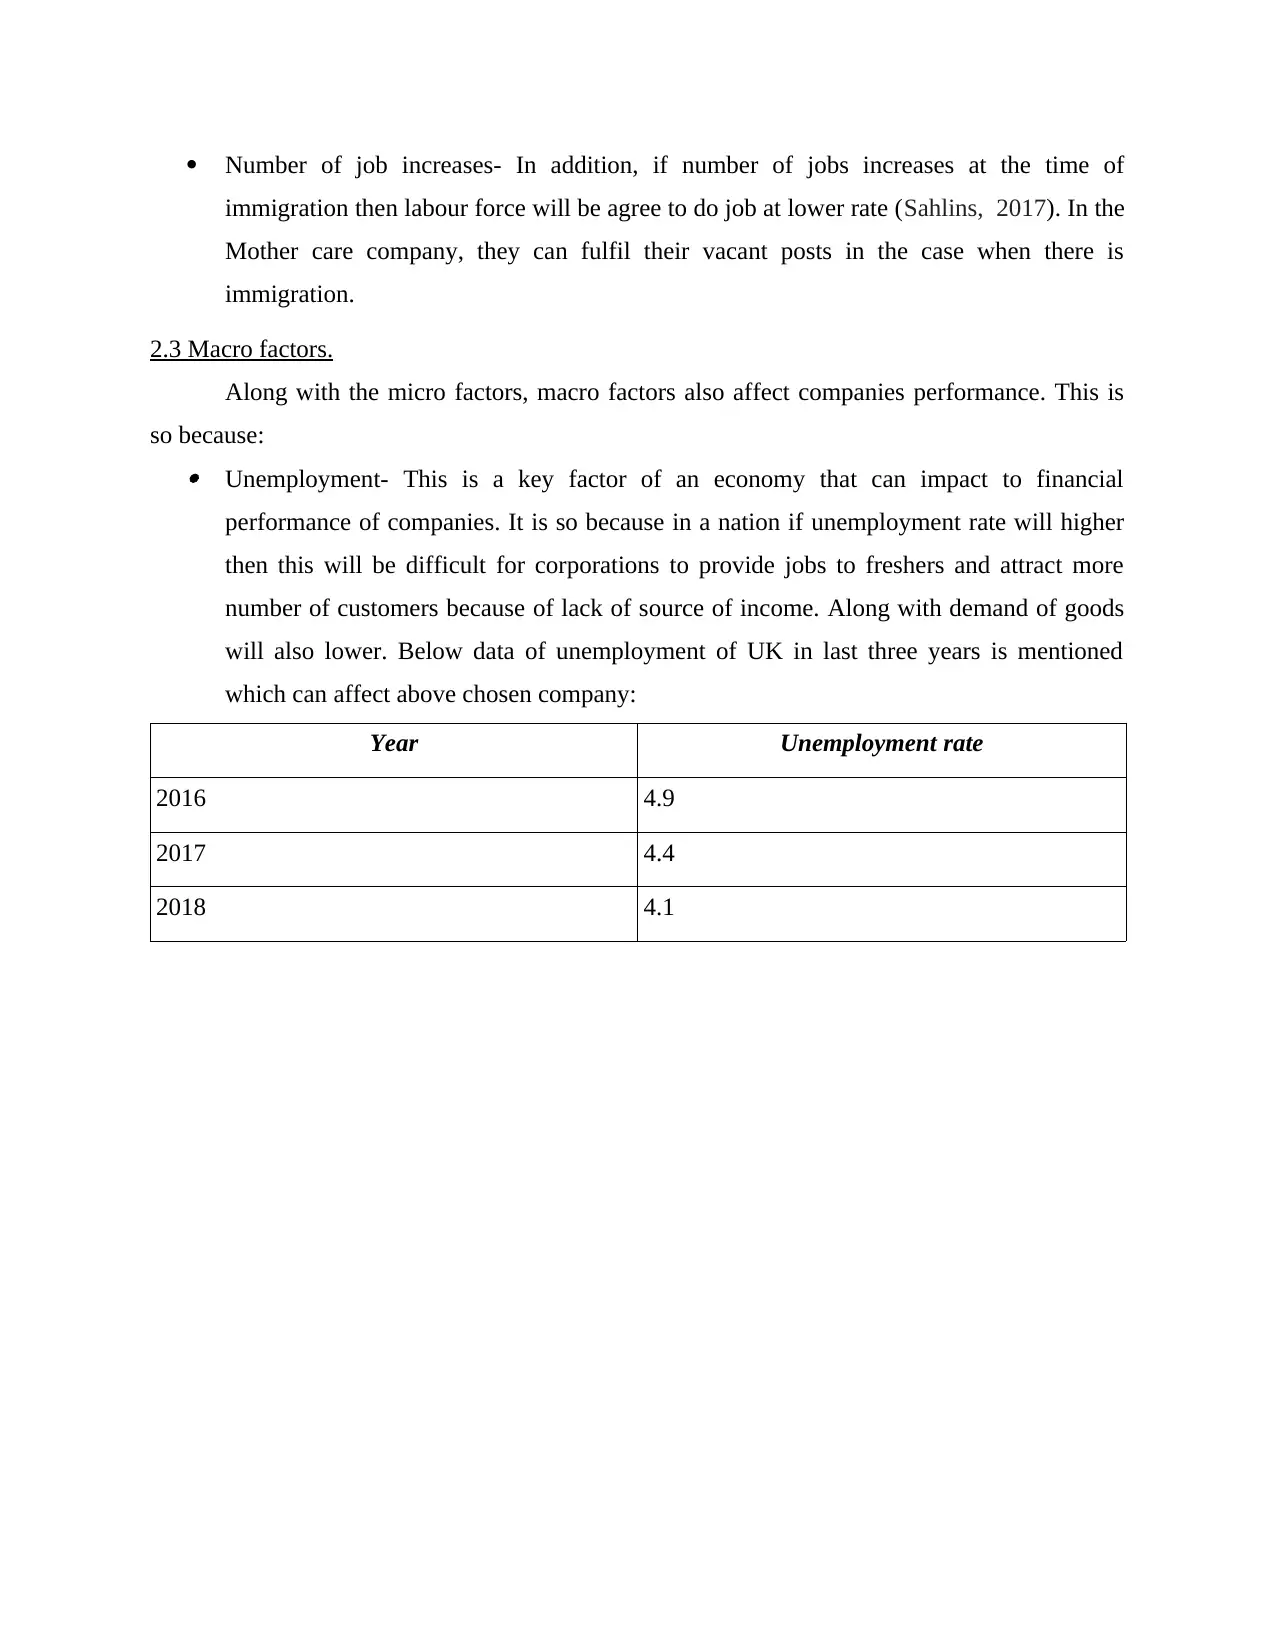
2.3 Macro factors.
Along with the micro factors, macro factors also affect companies performance. This is
so because: Unemployment- This is a key factor of an economy that can impact to financial
performance of companies. It is so because in a nation if unemployment rate will higher
then this will be difficult for corporations to provide jobs to freshers and attract more
number of customers because of lack of source of income. Along with demand of goods
will also lower. Below data of unemployment of UK in last three years is mentioned
which can affect above chosen company:
Year Unemployment rate
2016 4.9
2017 4.4
2018 4.1
immigration then labour force will be agree to do job at lower rate (Sahlins, 2017). In the
Mother care company, they can fulfil their vacant posts in the case when there is
immigration.
2.3 Macro factors.
Along with the micro factors, macro factors also affect companies performance. This is
so because: Unemployment- This is a key factor of an economy that can impact to financial
performance of companies. It is so because in a nation if unemployment rate will higher
then this will be difficult for corporations to provide jobs to freshers and attract more
number of customers because of lack of source of income. Along with demand of goods
will also lower. Below data of unemployment of UK in last three years is mentioned
which can affect above chosen company:
Year Unemployment rate
2016 4.9
2017 4.4
2018 4.1
⊘ This is a preview!⊘
Do you want full access?
Subscribe today to unlock all pages.
Trusted by 1+ million students worldwide
2016 2017 2018
3.6
3.8
4
4.2
4.4
4.6
4.8
5 4.9
4.4
4.1
Unemployment rate
This chart shows that unemployment rate is decreasing and it will make a positive impact on
Mother-care company's performance. It is so because if people will have jobs then they will
demand for more products.
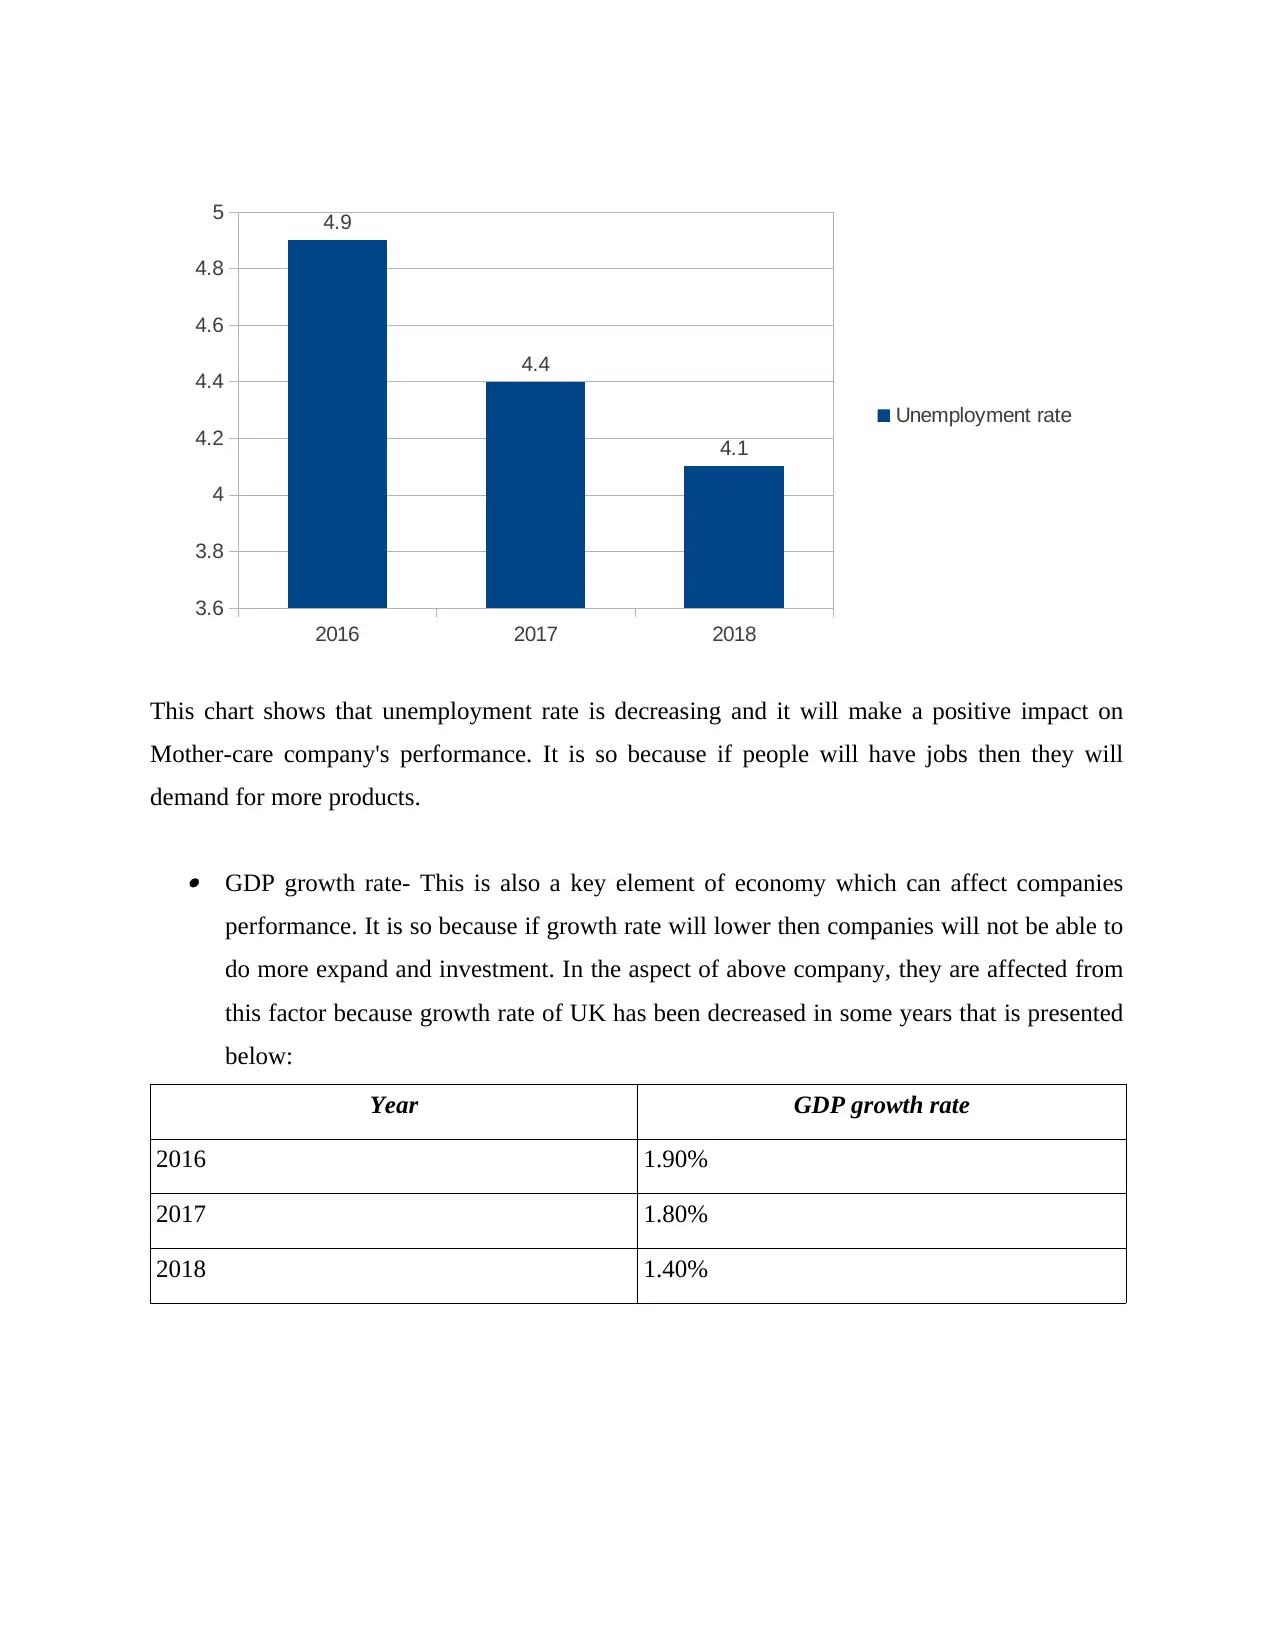
GDP growth rate- This is also a key element of economy which can affect companies
performance. It is so because if growth rate will lower then companies will not be able to
do more expand and investment. In the aspect of above company, they are affected from
this factor because growth rate of UK has been decreased in some years that is presented
below:
Year GDP growth rate
2016 1.90%
2017 1.80%
2018 1.40%
3.6
3.8
4
4.2
4.4
4.6
4.8
5 4.9
4.4
4.1
Unemployment rate
This chart shows that unemployment rate is decreasing and it will make a positive impact on
Mother-care company's performance. It is so because if people will have jobs then they will
demand for more products.
GDP growth rate- This is also a key element of economy which can affect companies
performance. It is so because if growth rate will lower then companies will not be able to
do more expand and investment. In the aspect of above company, they are affected from
this factor because growth rate of UK has been decreased in some years that is presented
below:
Year GDP growth rate
2016 1.90%
2017 1.80%
2018 1.40%
Paraphrase This Document
Need a fresh take? Get an instant paraphrase of this document with our AI Paraphraser
2016 2017 2018
0
0
0
0.01
0.01
0.01
0.01
0.01
0.02
0.02
0.02 1.90% 1.80%
1.40%
GDP growth rate
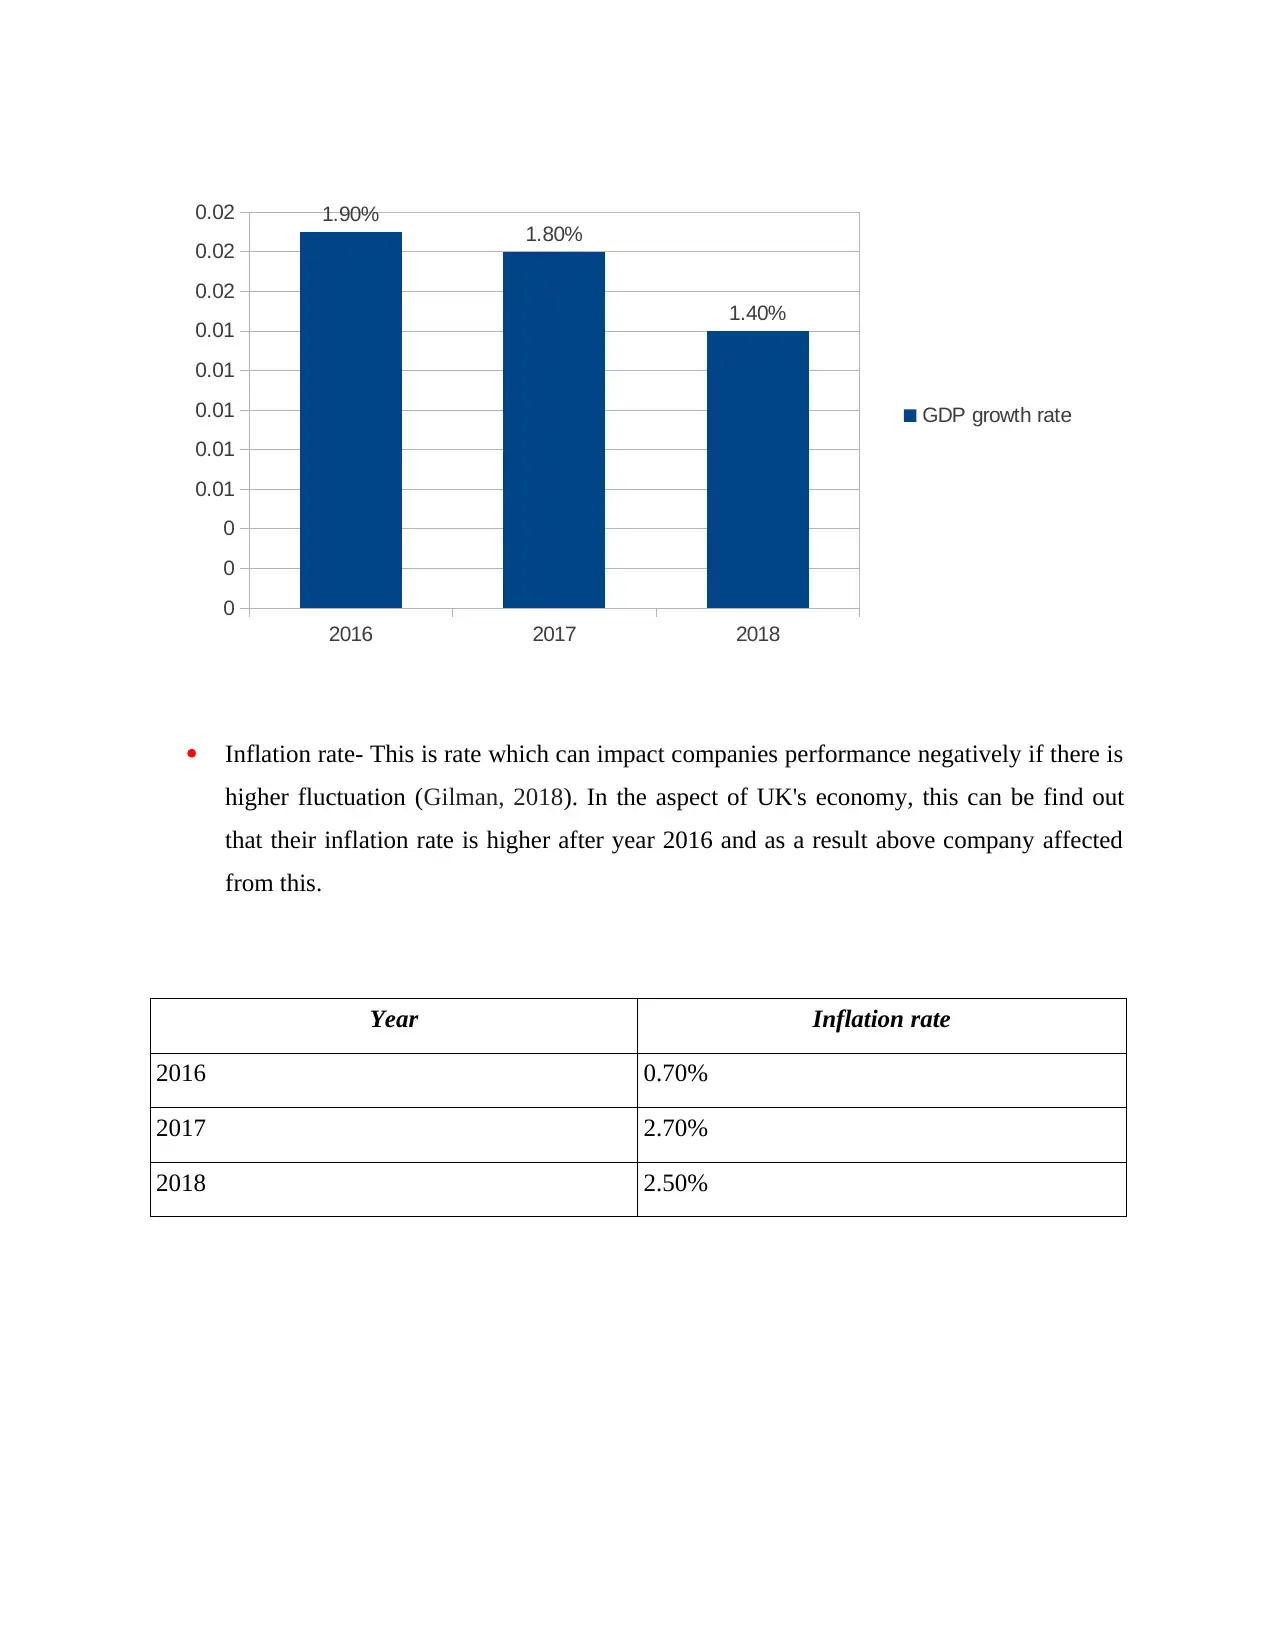
Inflation rate- This is rate which can impact companies performance negatively if there is
higher fluctuation (Gilman, 2018). In the aspect of UK's economy, this can be find out
that their inflation rate is higher after year 2016 and as a result above company affected
from this.
Year Inflation rate
2016 0.70%
2017 2.70%
2018 2.50%
0
0
0
0.01
0.01
0.01
0.01
0.01
0.02
0.02
0.02 1.90% 1.80%
1.40%
GDP growth rate
Inflation rate- This is rate which can impact companies performance negatively if there is
higher fluctuation (Gilman, 2018). In the aspect of UK's economy, this can be find out
that their inflation rate is higher after year 2016 and as a result above company affected
from this.
Year Inflation rate
2016 0.70%
2017 2.70%
2018 2.50%
2016 2017 2018
0
0.01
0.01
0.02
0.02
0.03
0.03
Inflation rate
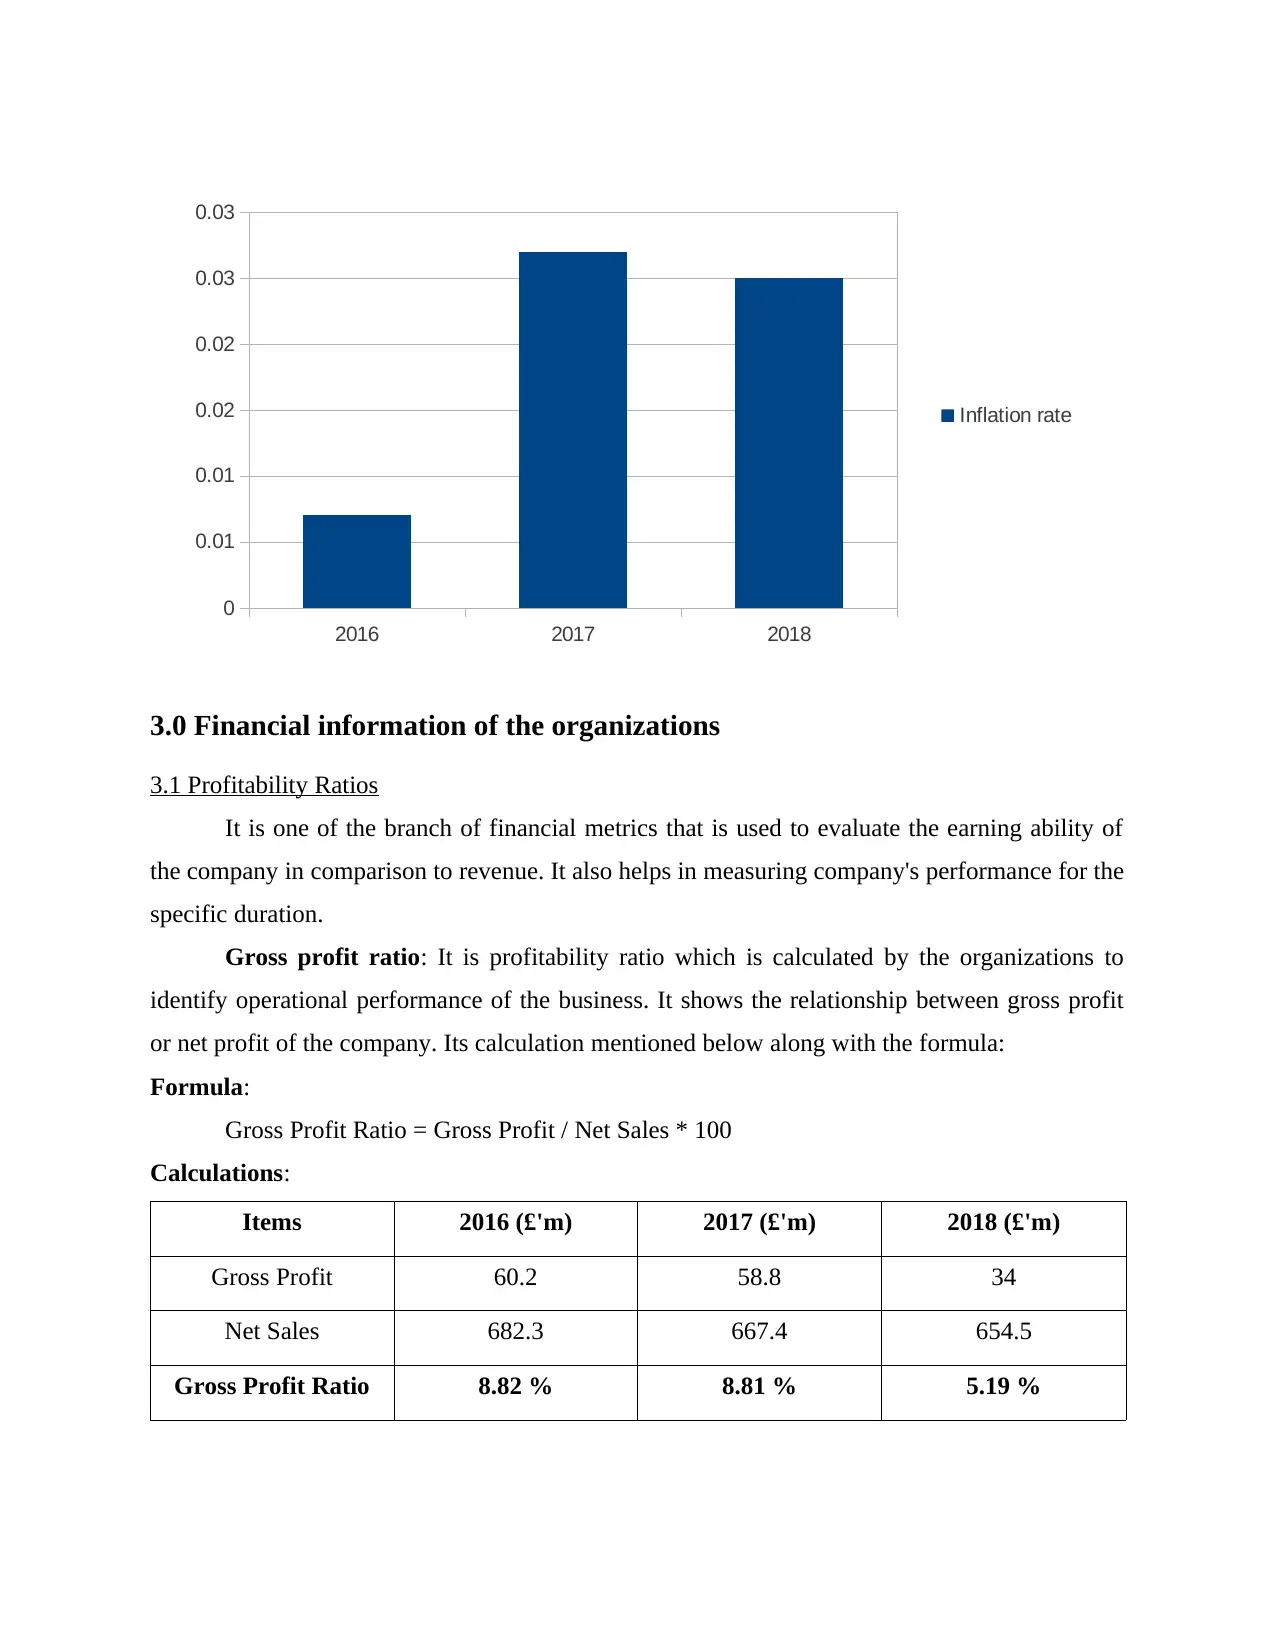
3.0 Financial information of the organizations
3.1 Profitability Ratios
It is one of the branch of financial metrics that is used to evaluate the earning ability of
the company in comparison to revenue. It also helps in measuring company's performance for the
specific duration.
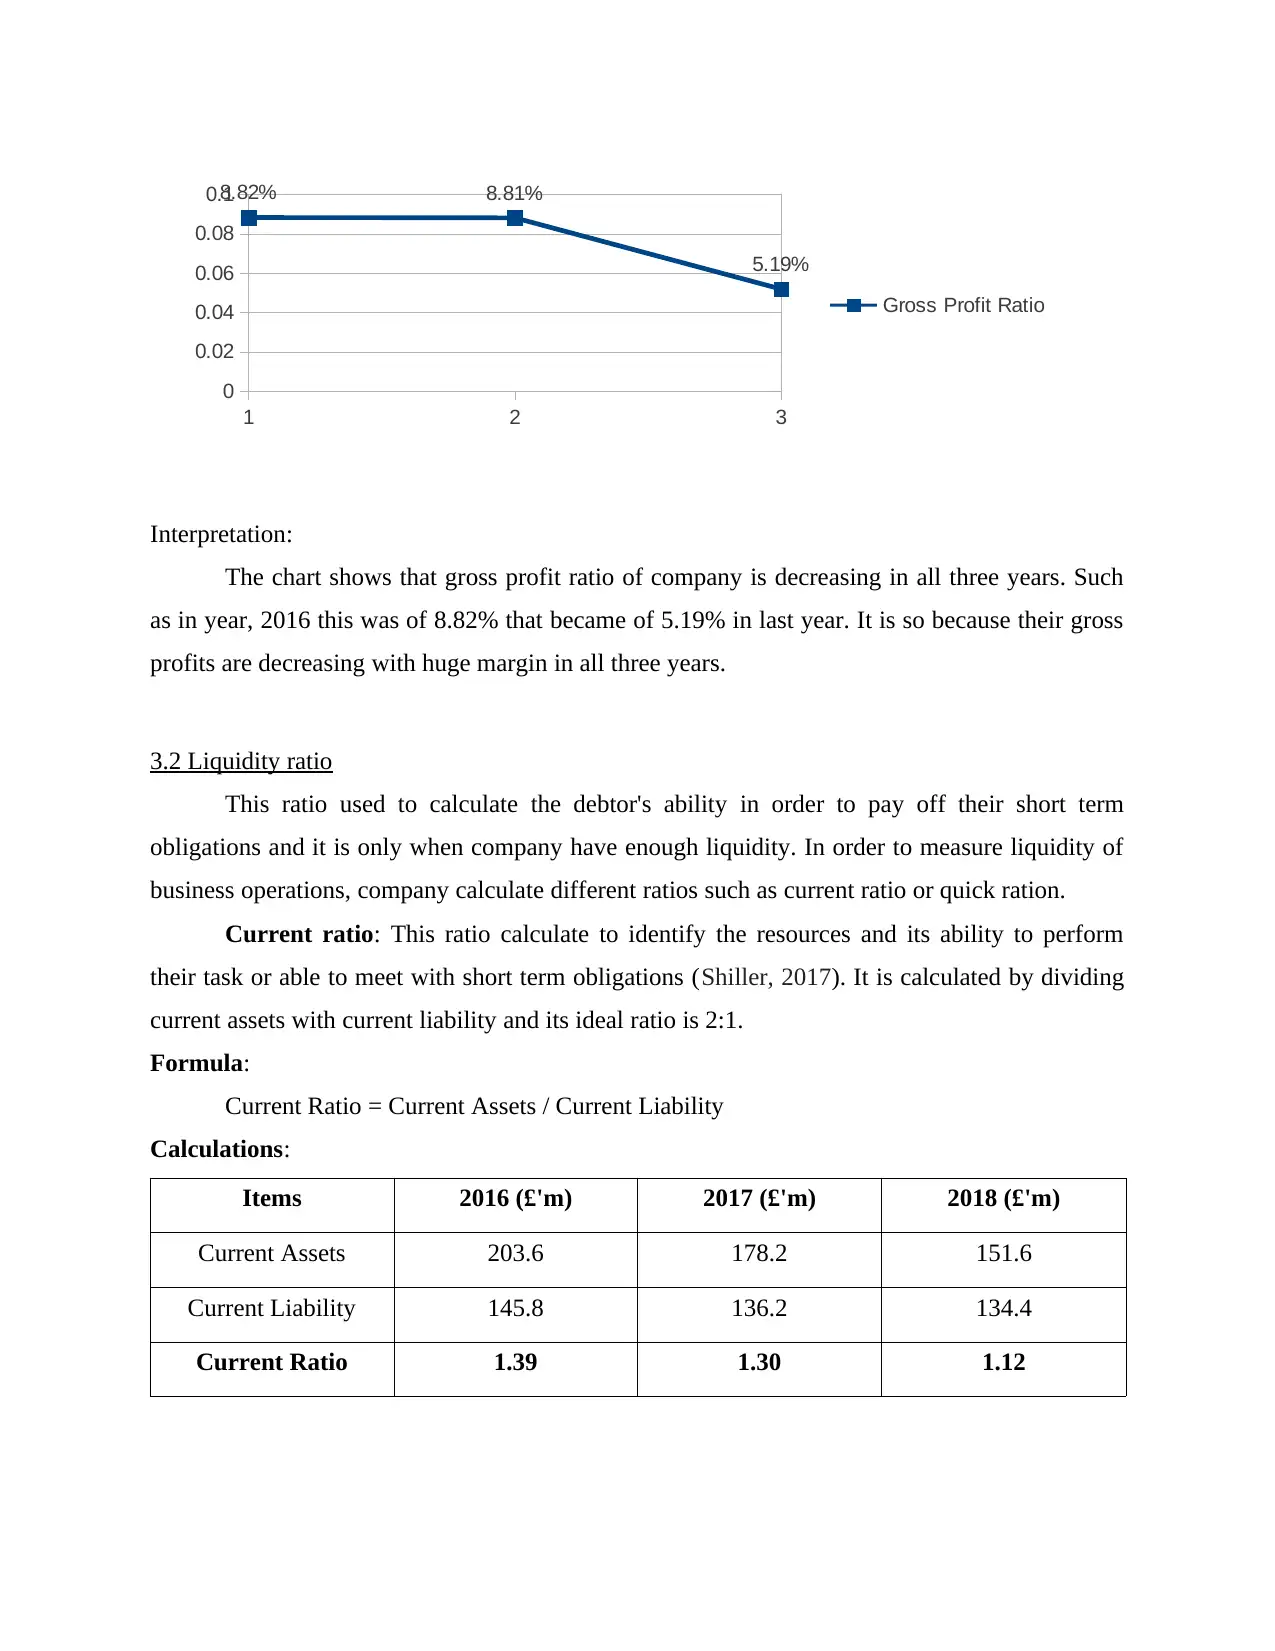
Gross profit ratio: It is profitability ratio which is calculated by the organizations to
identify operational performance of the business. It shows the relationship between gross profit
or net profit of the company. Its calculation mentioned below along with the formula:
Formula:
Gross Profit Ratio = Gross Profit / Net Sales * 100
Calculations:
Items 2016 (£'m) 2017 (£'m) 2018 (£'m)
Gross Profit 60.2 58.8 34
Net Sales 682.3 667.4 654.5
Gross Profit Ratio 8.82 % 8.81 % 5.19 %
0
0.01
0.01
0.02
0.02
0.03
0.03
Inflation rate
3.0 Financial information of the organizations
3.1 Profitability Ratios
It is one of the branch of financial metrics that is used to evaluate the earning ability of
the company in comparison to revenue. It also helps in measuring company's performance for the
specific duration.
Gross profit ratio: It is profitability ratio which is calculated by the organizations to
identify operational performance of the business. It shows the relationship between gross profit
or net profit of the company. Its calculation mentioned below along with the formula:
Formula:
Gross Profit Ratio = Gross Profit / Net Sales * 100
Calculations:
Items 2016 (£'m) 2017 (£'m) 2018 (£'m)
Gross Profit 60.2 58.8 34
Net Sales 682.3 667.4 654.5
Gross Profit Ratio 8.82 % 8.81 % 5.19 %
⊘ This is a preview!⊘
Do you want full access?
Subscribe today to unlock all pages.
Trusted by 1+ million students worldwide
1 2 3
0
0.02
0.04
0.06
0.08
0.18.82% 8.81%
5.19%
Gross Profit Ratio
Interpretation:
The chart shows that gross profit ratio of company is decreasing in all three years. Such
as in year, 2016 this was of 8.82% that became of 5.19% in last year. It is so because their gross
profits are decreasing with huge margin in all three years.
3.2 Liquidity ratio
This ratio used to calculate the debtor's ability in order to pay off their short term
obligations and it is only when company have enough liquidity. In order to measure liquidity of
business operations, company calculate different ratios such as current ratio or quick ration.
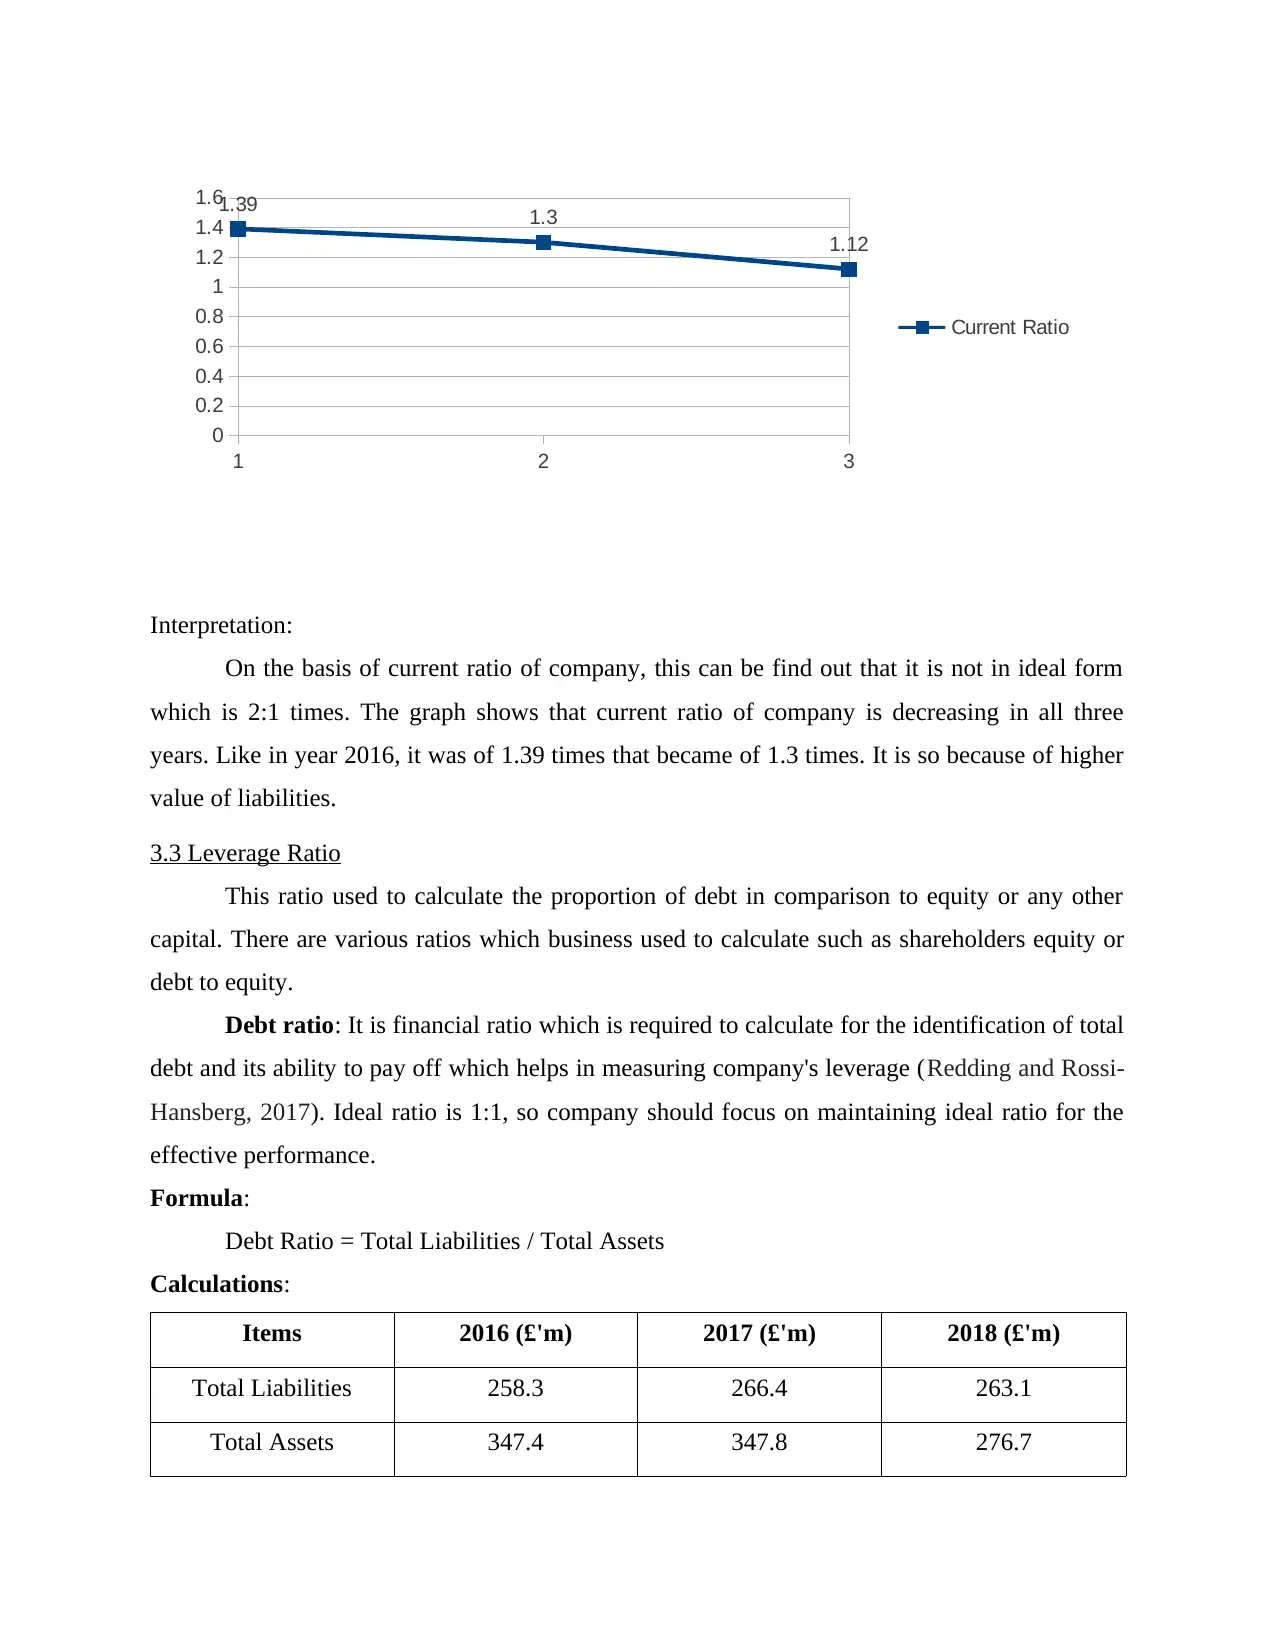
Current ratio: This ratio calculate to identify the resources and its ability to perform
their task or able to meet with short term obligations (Shiller, 2017). It is calculated by dividing
current assets with current liability and its ideal ratio is 2:1.
Formula:
Current Ratio = Current Assets / Current Liability
Calculations:
Items 2016 (£'m) 2017 (£'m) 2018 (£'m)
Current Assets 203.6 178.2 151.6
Current Liability 145.8 136.2 134.4
Current Ratio 1.39 1.30 1.12
0
0.02
0.04
0.06
0.08
0.18.82% 8.81%
5.19%
Gross Profit Ratio
Interpretation:
The chart shows that gross profit ratio of company is decreasing in all three years. Such
as in year, 2016 this was of 8.82% that became of 5.19% in last year. It is so because their gross
profits are decreasing with huge margin in all three years.
3.2 Liquidity ratio
This ratio used to calculate the debtor's ability in order to pay off their short term
obligations and it is only when company have enough liquidity. In order to measure liquidity of
business operations, company calculate different ratios such as current ratio or quick ration.
Current ratio: This ratio calculate to identify the resources and its ability to perform
their task or able to meet with short term obligations (Shiller, 2017). It is calculated by dividing
current assets with current liability and its ideal ratio is 2:1.
Formula:
Current Ratio = Current Assets / Current Liability
Calculations:
Items 2016 (£'m) 2017 (£'m) 2018 (£'m)
Current Assets 203.6 178.2 151.6
Current Liability 145.8 136.2 134.4
Current Ratio 1.39 1.30 1.12
Paraphrase This Document
Need a fresh take? Get an instant paraphrase of this document with our AI Paraphraser
1 2 3
0
0.2
0.4
0.6
0.8
1
1.2
1.4
1.61.39 1.3
1.12
Current Ratio
Interpretation:
On the basis of current ratio of company, this can be find out that it is not in ideal form
which is 2:1 times. The graph shows that current ratio of company is decreasing in all three
years. Like in year 2016, it was of 1.39 times that became of 1.3 times. It is so because of higher
value of liabilities.
3.3 Leverage Ratio
This ratio used to calculate the proportion of debt in comparison to equity or any other
capital. There are various ratios which business used to calculate such as shareholders equity or
debt to equity.
Debt ratio: It is financial ratio which is required to calculate for the identification of total
debt and its ability to pay off which helps in measuring company's leverage (Redding and Rossi-
Hansberg, 2017). Ideal ratio is 1:1, so company should focus on maintaining ideal ratio for the
effective performance.
Formula:
Debt Ratio = Total Liabilities / Total Assets
Calculations:
Items 2016 (£'m) 2017 (£'m) 2018 (£'m)
Total Liabilities 258.3 266.4 263.1
Total Assets 347.4 347.8 276.7
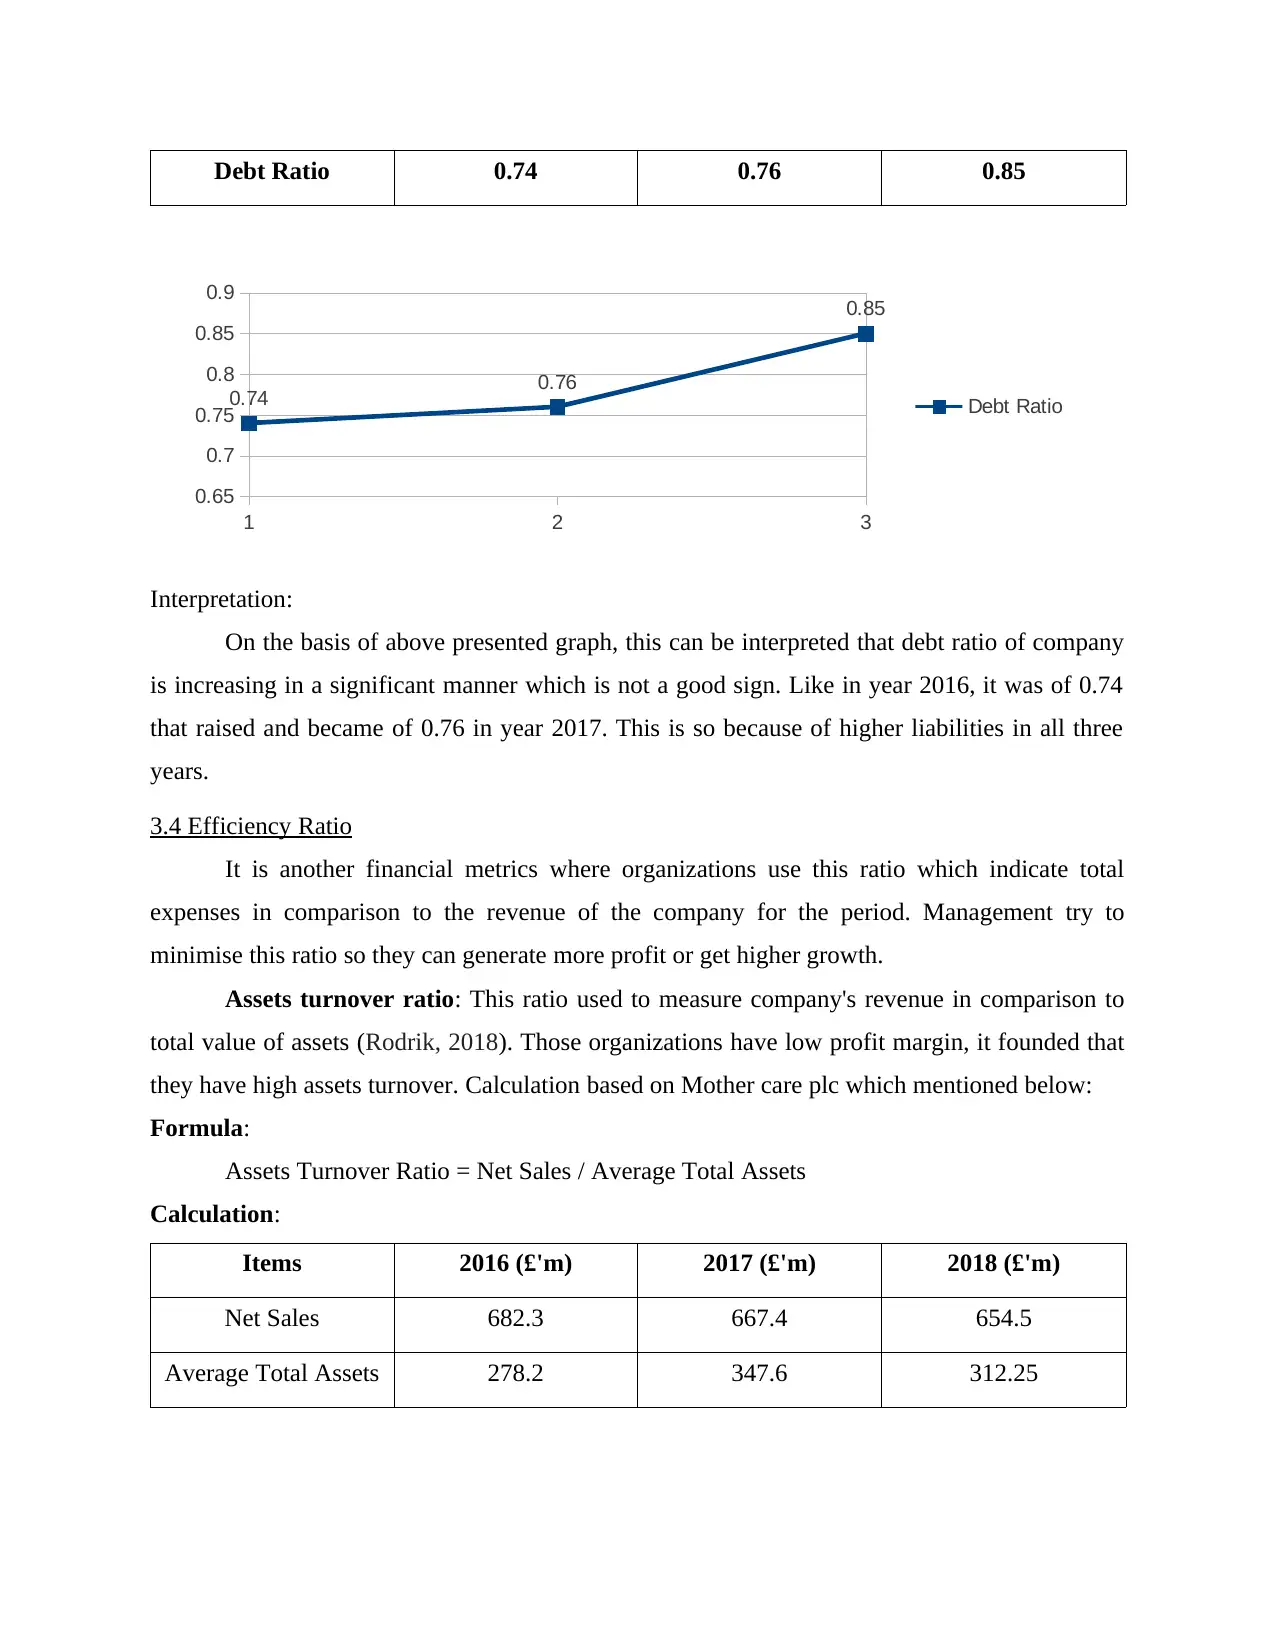
Debt Ratio 0.74 0.76 0.85
1 2 3
0.65
0.7
0.75
0.8
0.85
0.9
0.74 0.76
0.85
Debt Ratio
Interpretation:
On the basis of above presented graph, this can be interpreted that debt ratio of company
is increasing in a significant manner which is not a good sign. Like in year 2016, it was of 0.74
that raised and became of 0.76 in year 2017. This is so because of higher liabilities in all three
years.
3.4 Efficiency Ratio
It is another financial metrics where organizations use this ratio which indicate total
expenses in comparison to the revenue of the company for the period. Management try to
minimise this ratio so they can generate more profit or get higher growth.
Assets turnover ratio: This ratio used to measure company's revenue in comparison to
total value of assets (Rodrik, 2018). Those organizations have low profit margin, it founded that
they have high assets turnover. Calculation based on Mother care plc which mentioned below:
Formula:
Assets Turnover Ratio = Net Sales / Average Total Assets
Calculation:
Items 2016 (£'m) 2017 (£'m) 2018 (£'m)
Net Sales 682.3 667.4 654.5
Average Total Assets 278.2 347.6 312.25
⊘ This is a preview!⊘
Do you want full access?
Subscribe today to unlock all pages.
Trusted by 1+ million students worldwide
1 out of 21
Related Documents


Your All-in-One AI-Powered Toolkit for Academic Success.
+13062052269
info@desklib.com
Available 24*7 on WhatsApp / Email
![[object Object]](/_next/static/media/star-bottom.7253800d.svg)
Unlock your academic potential
Copyright © 2020–2026 A2Z Services. All Rights Reserved. Developed and managed by ZUCOL.