UGB223 Business Finance: Evaluating Investments and Financial Health
VerifiedAdded on  2023/06/18
|15
|1257
|177
Homework Assignment
AI Summary
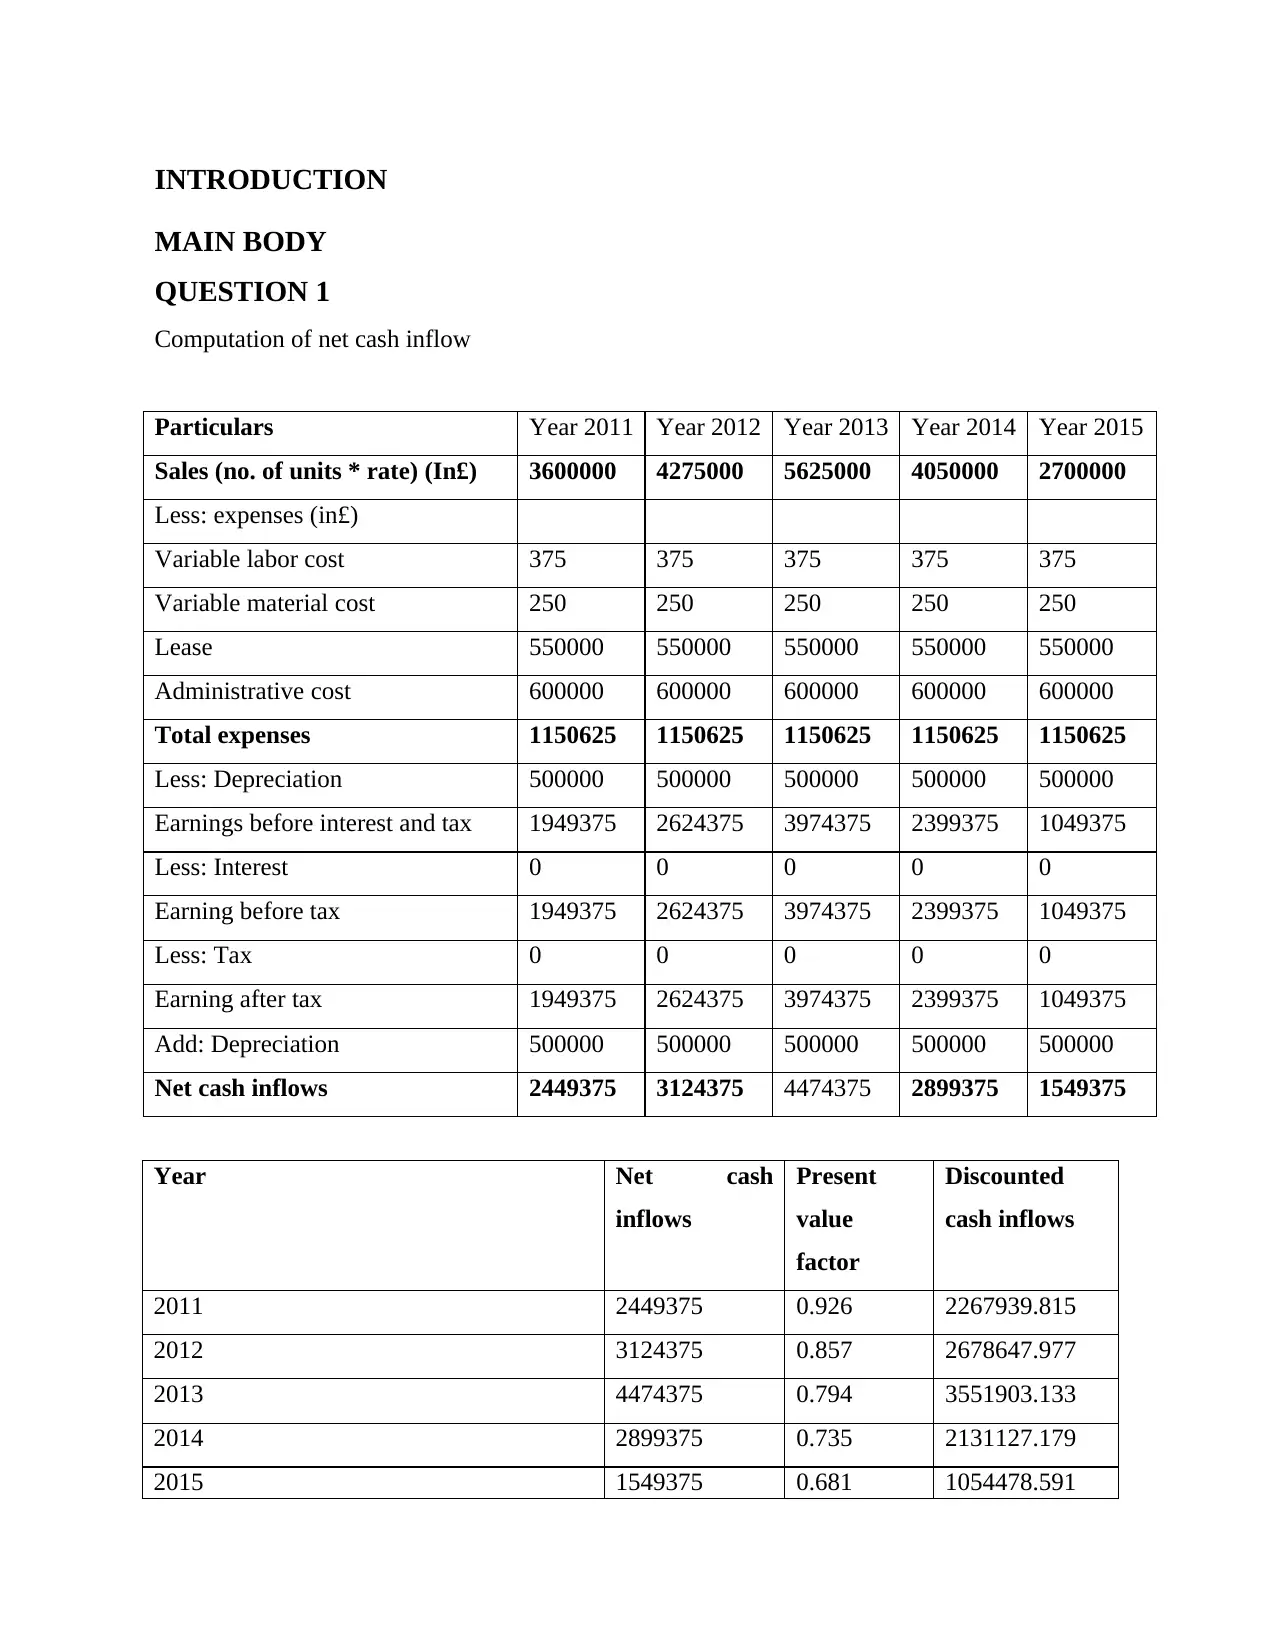
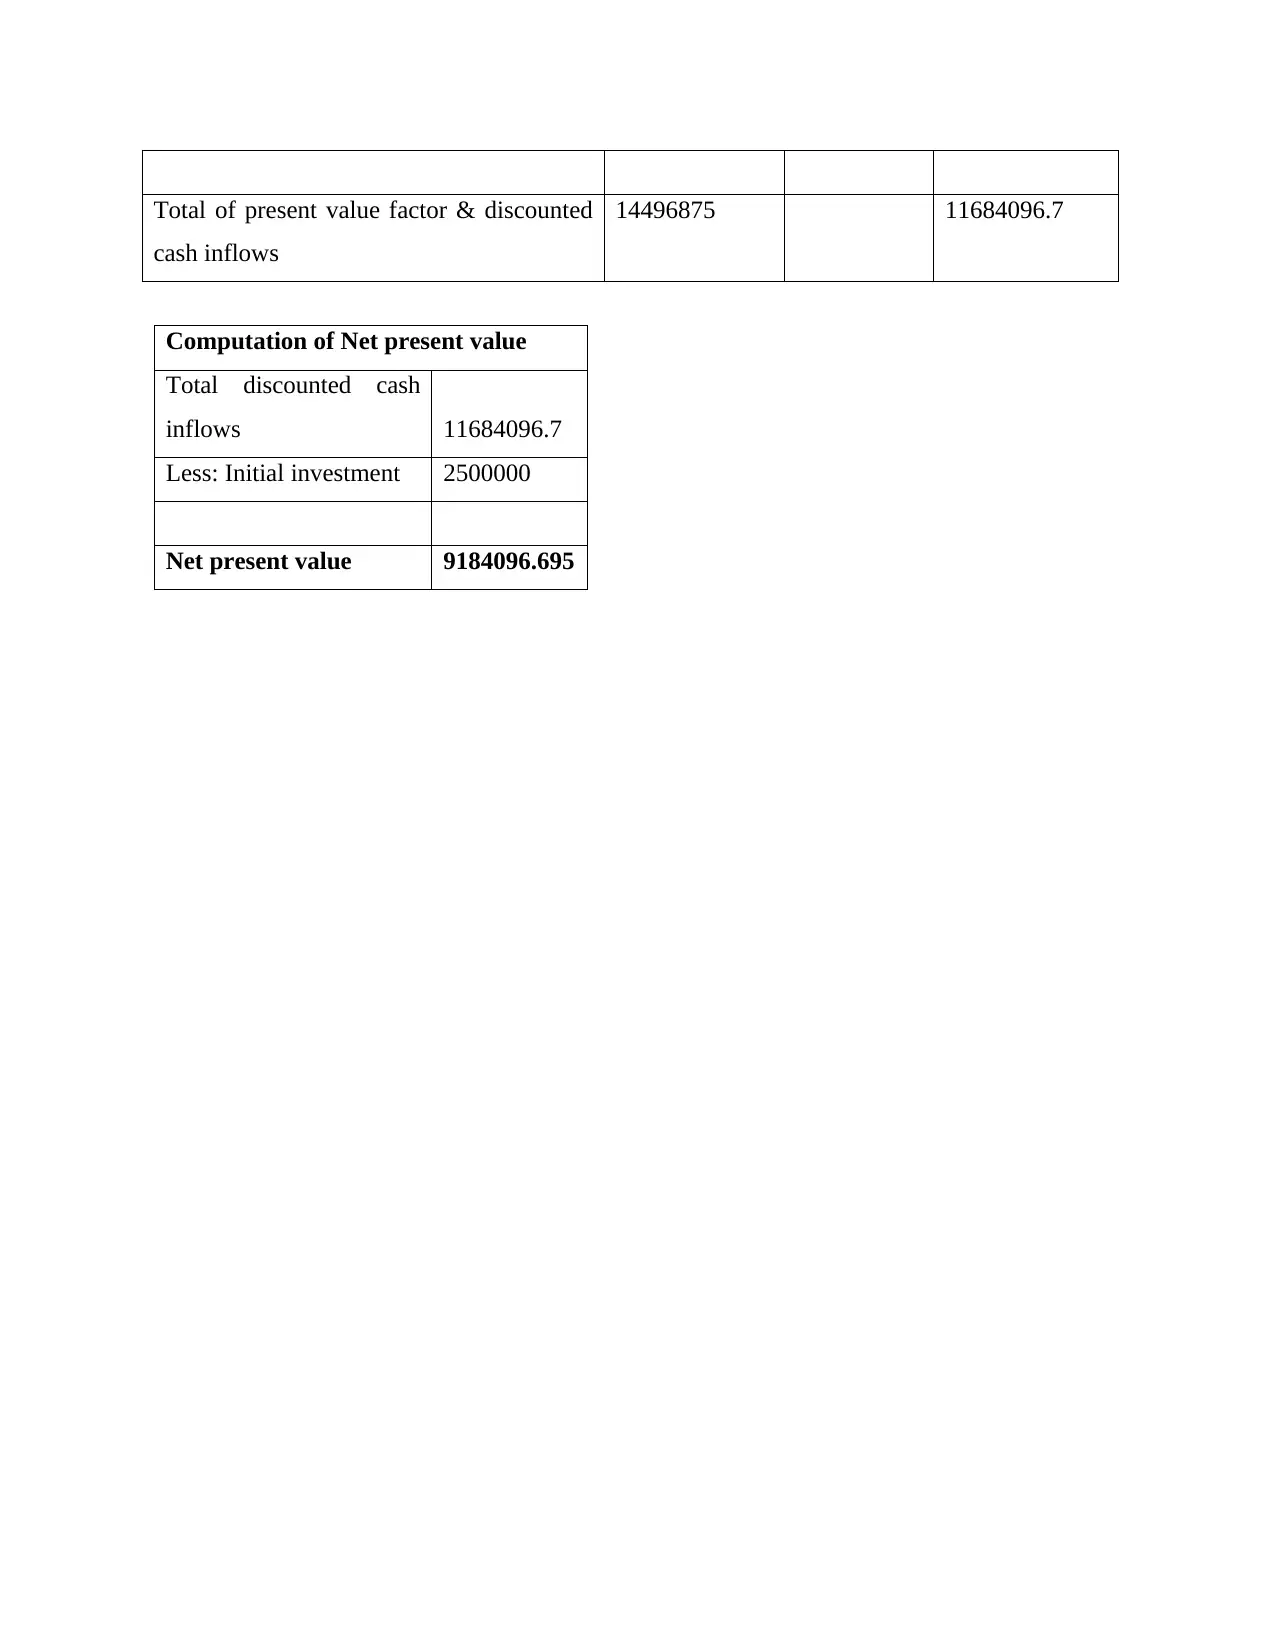
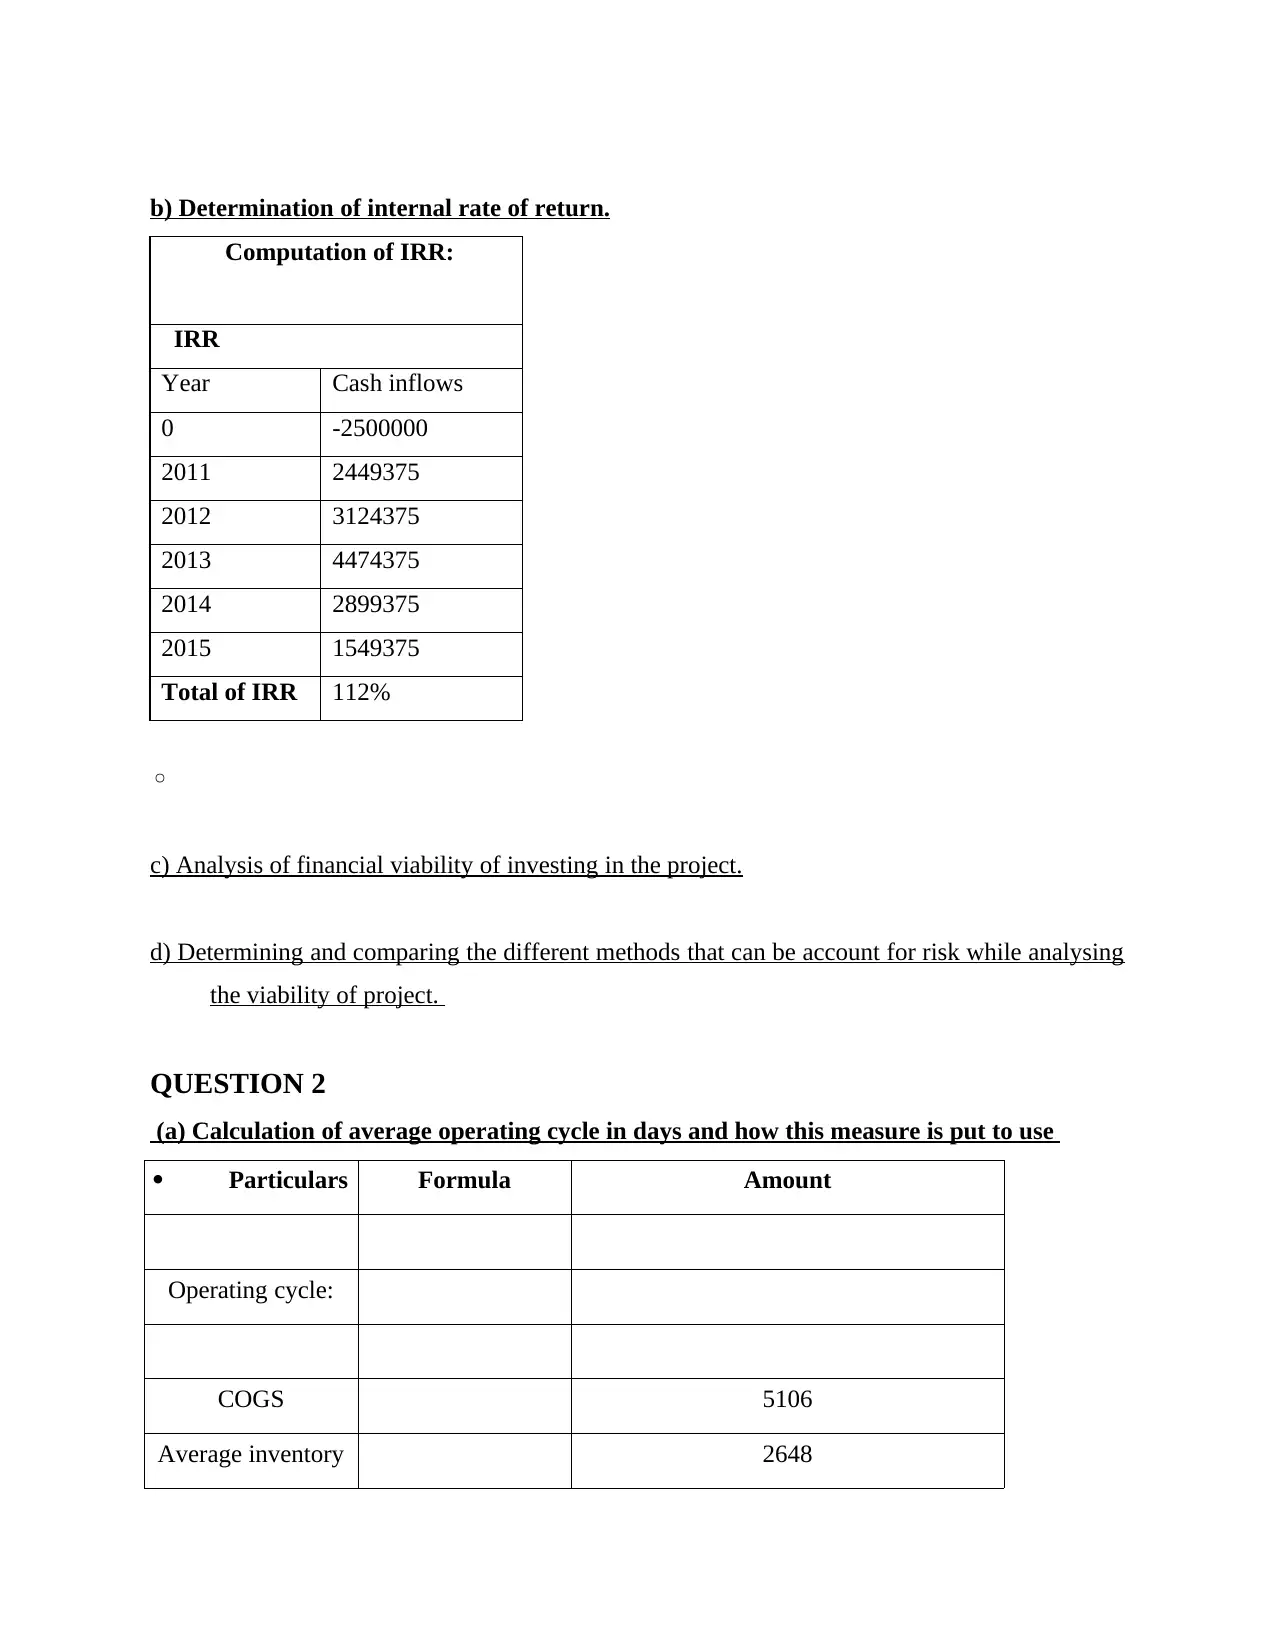
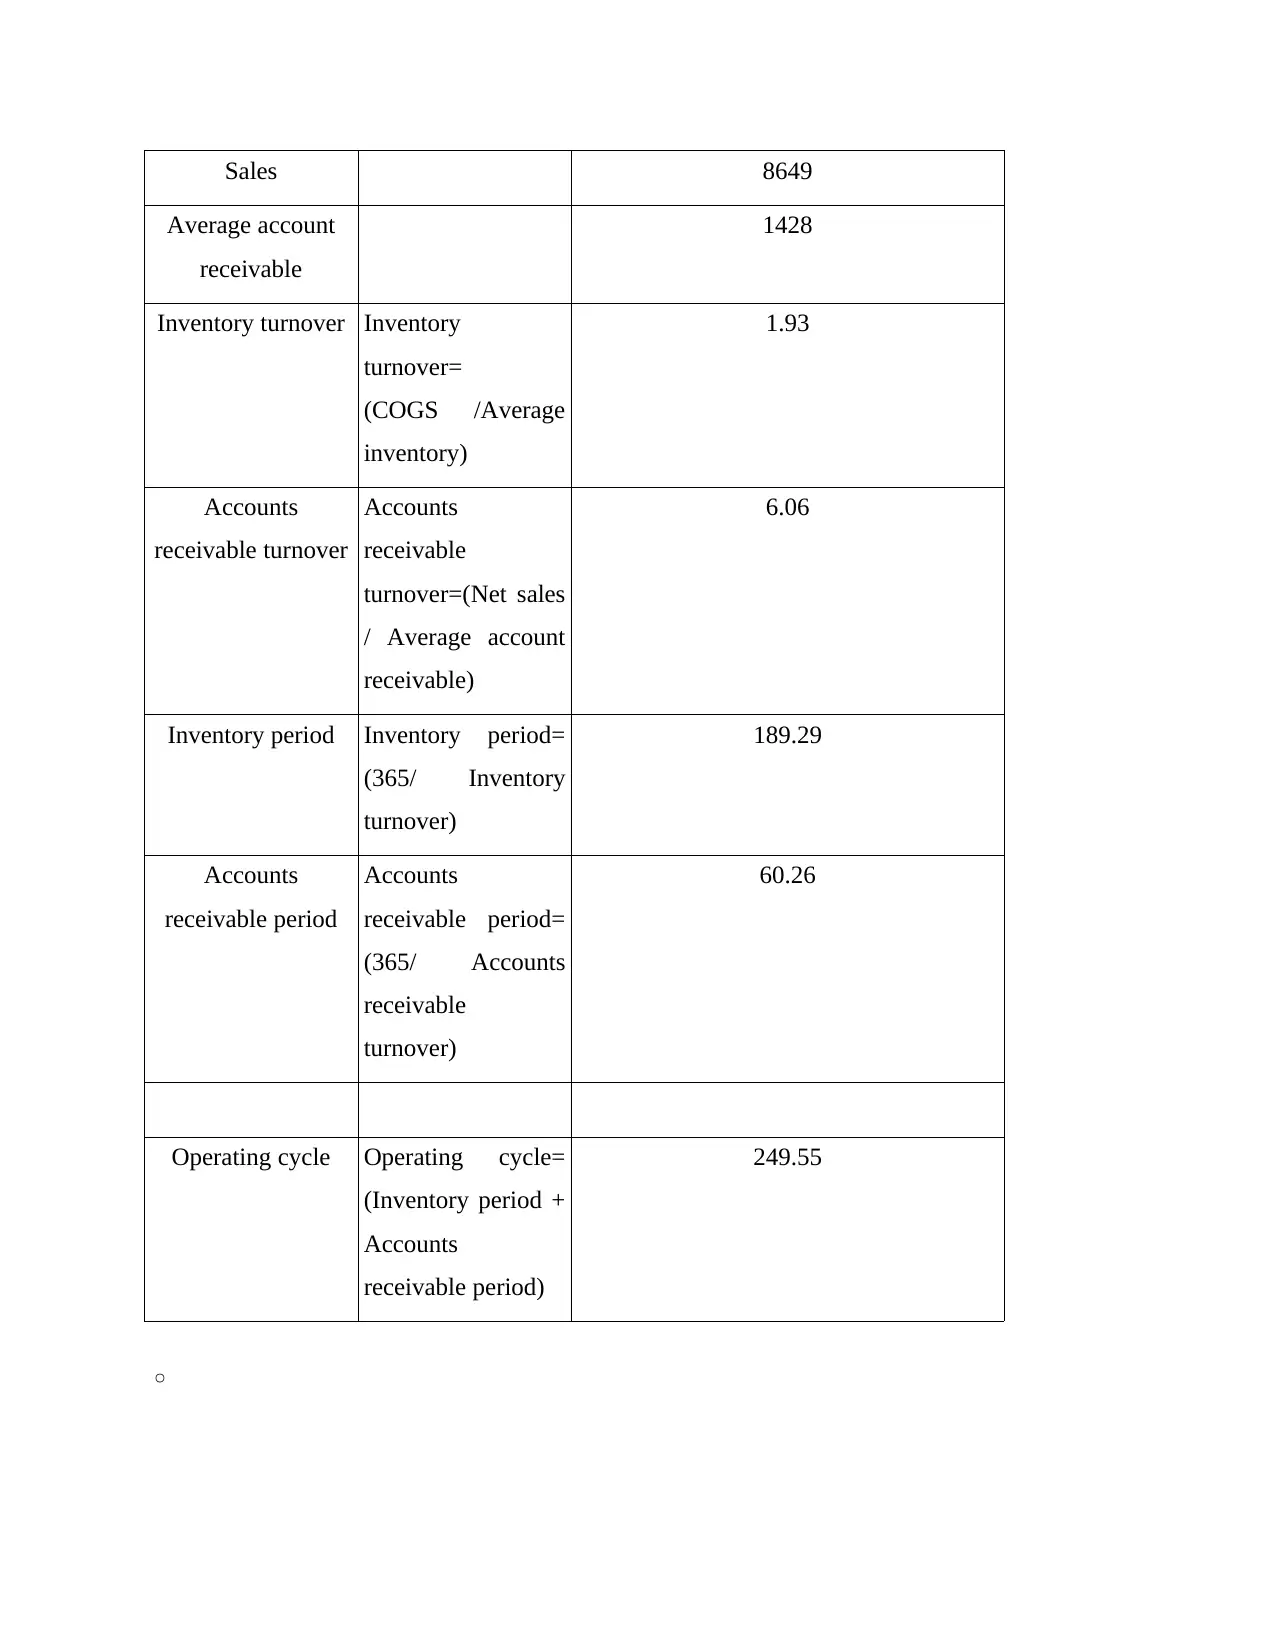
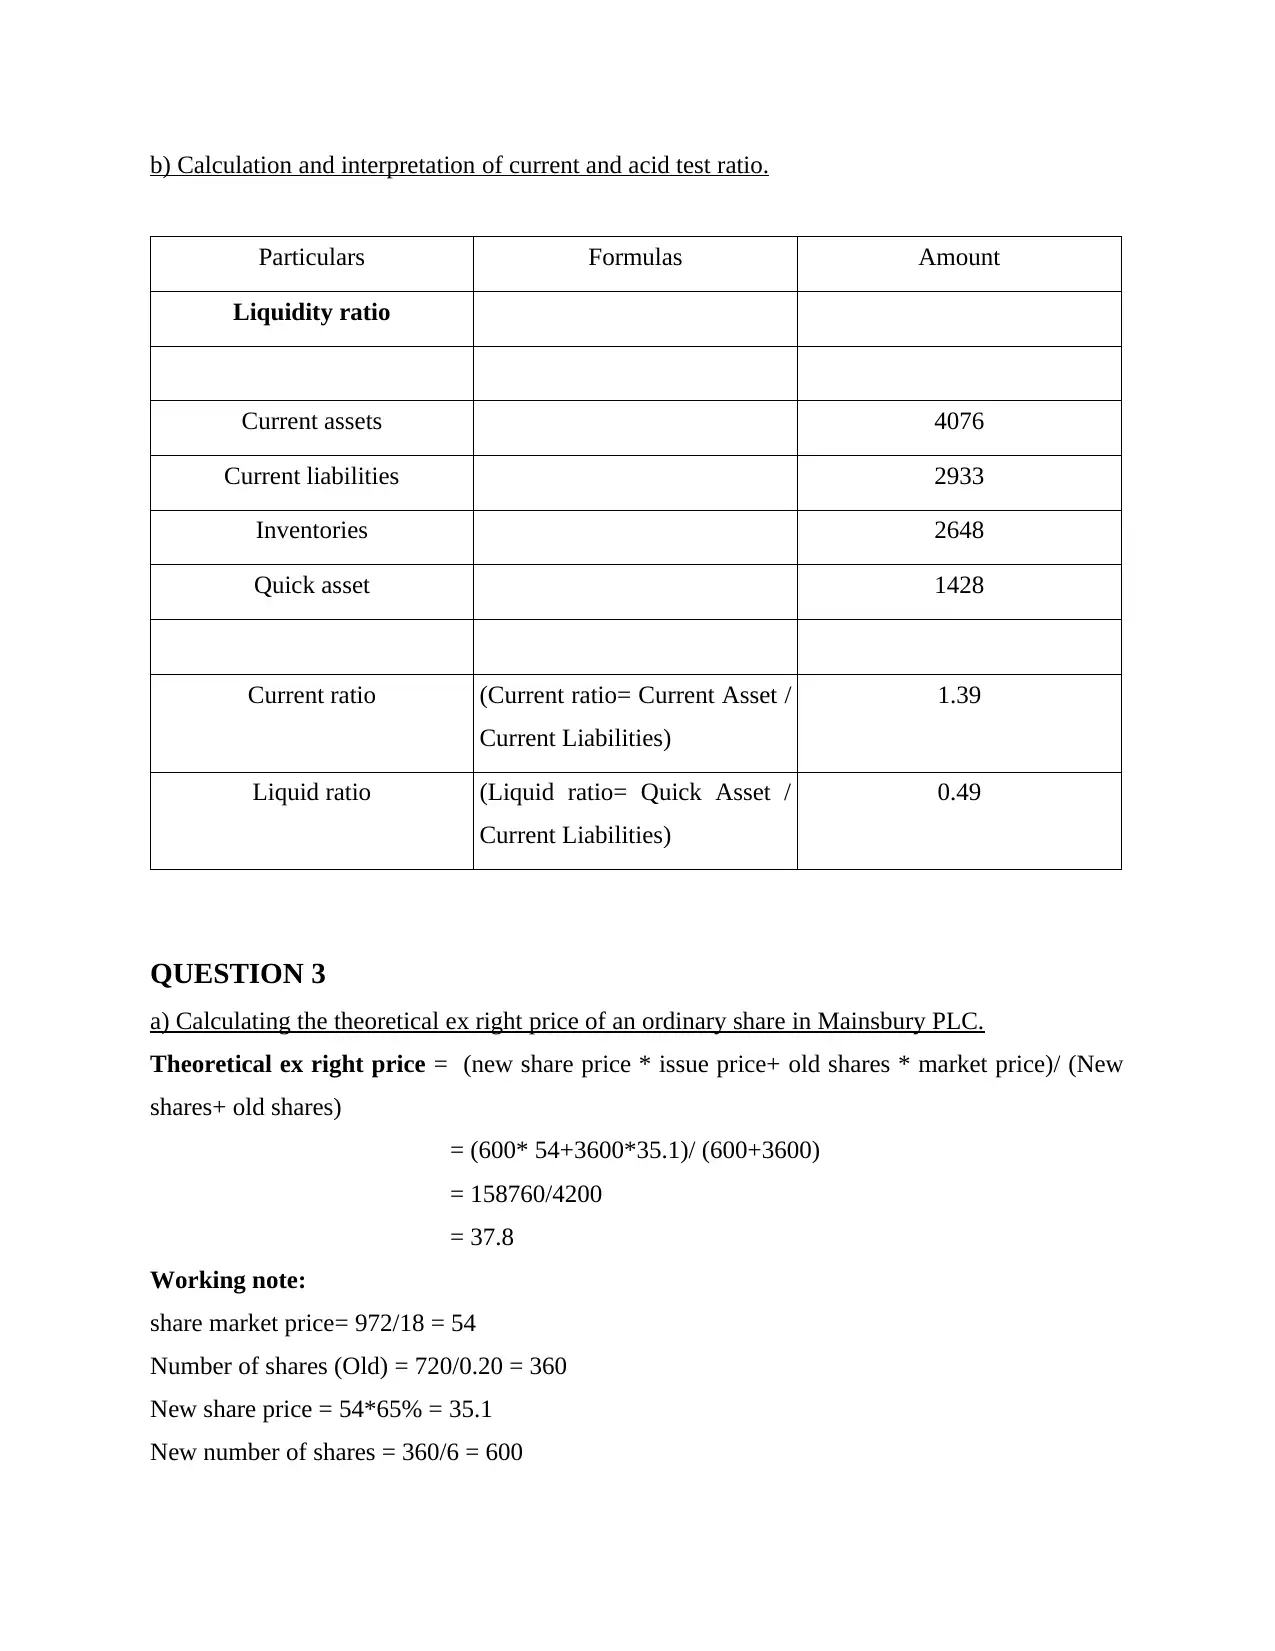
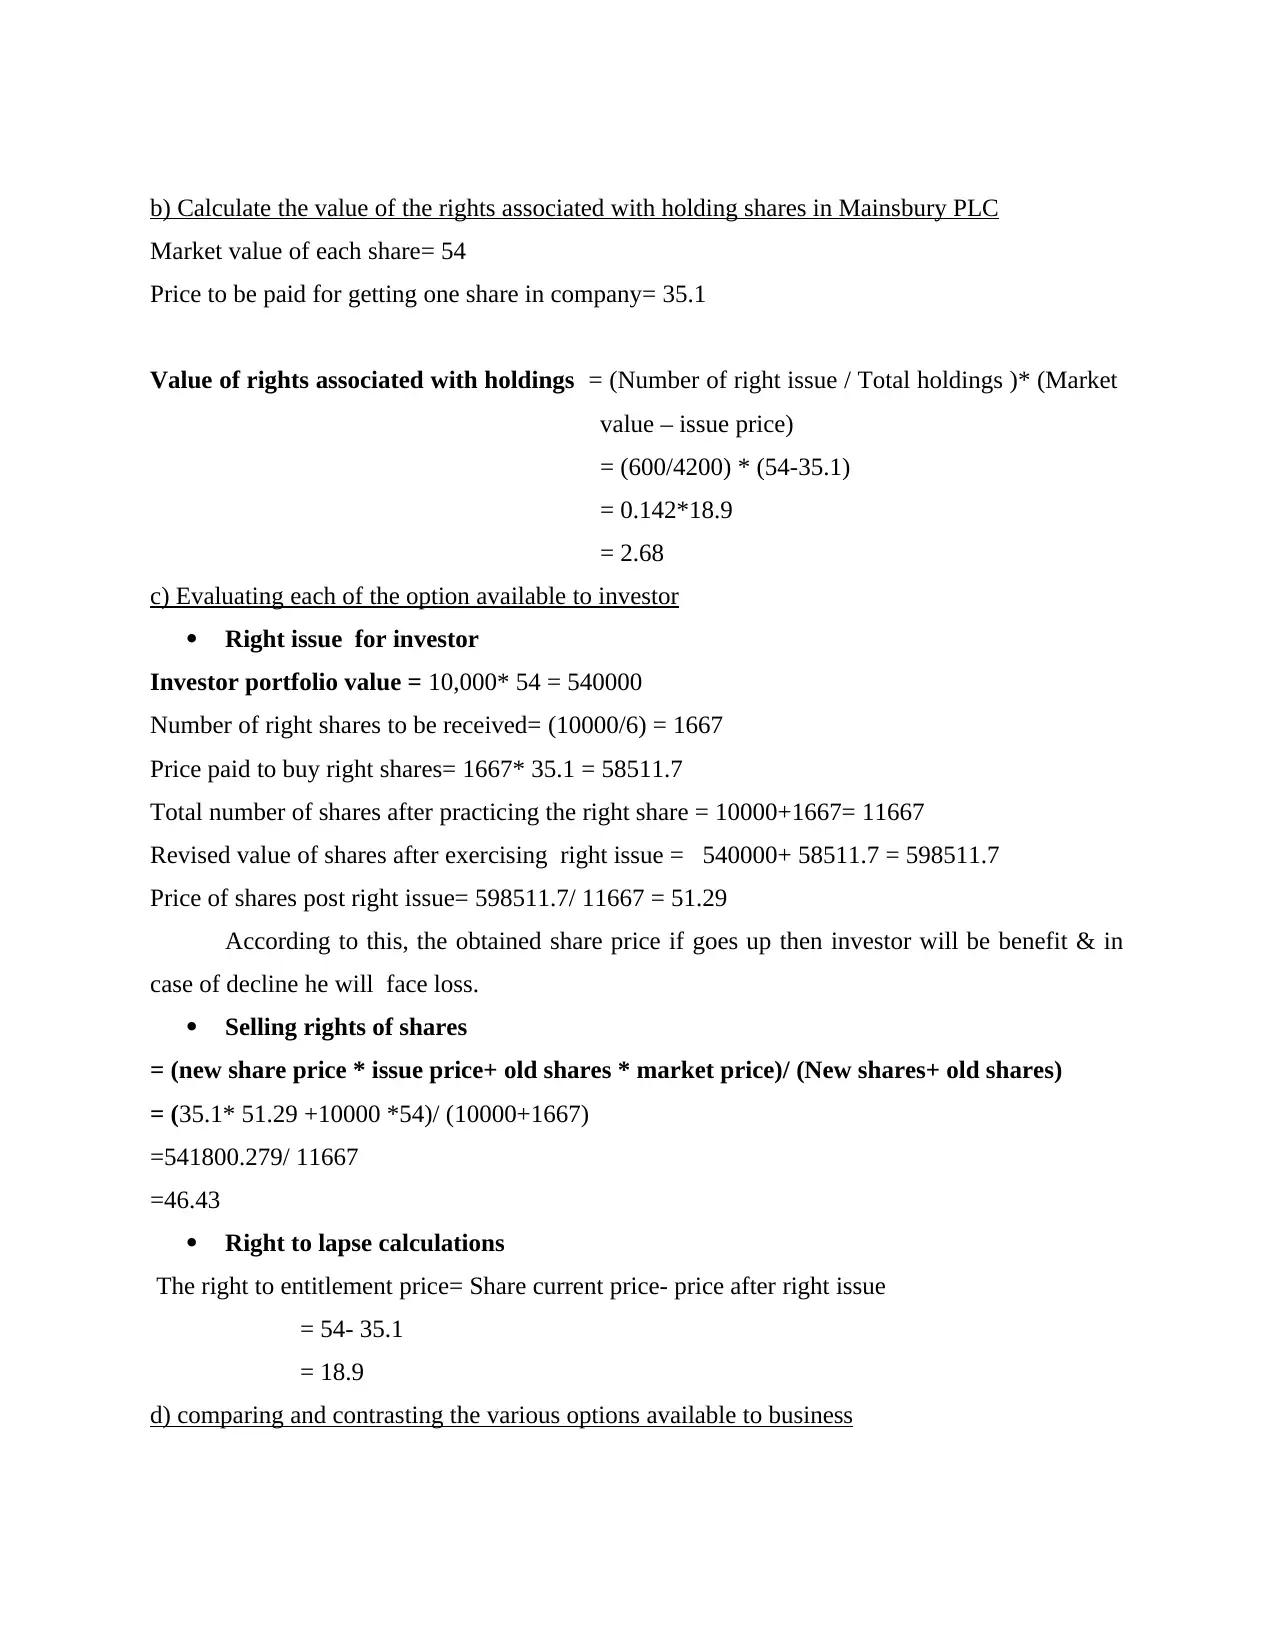
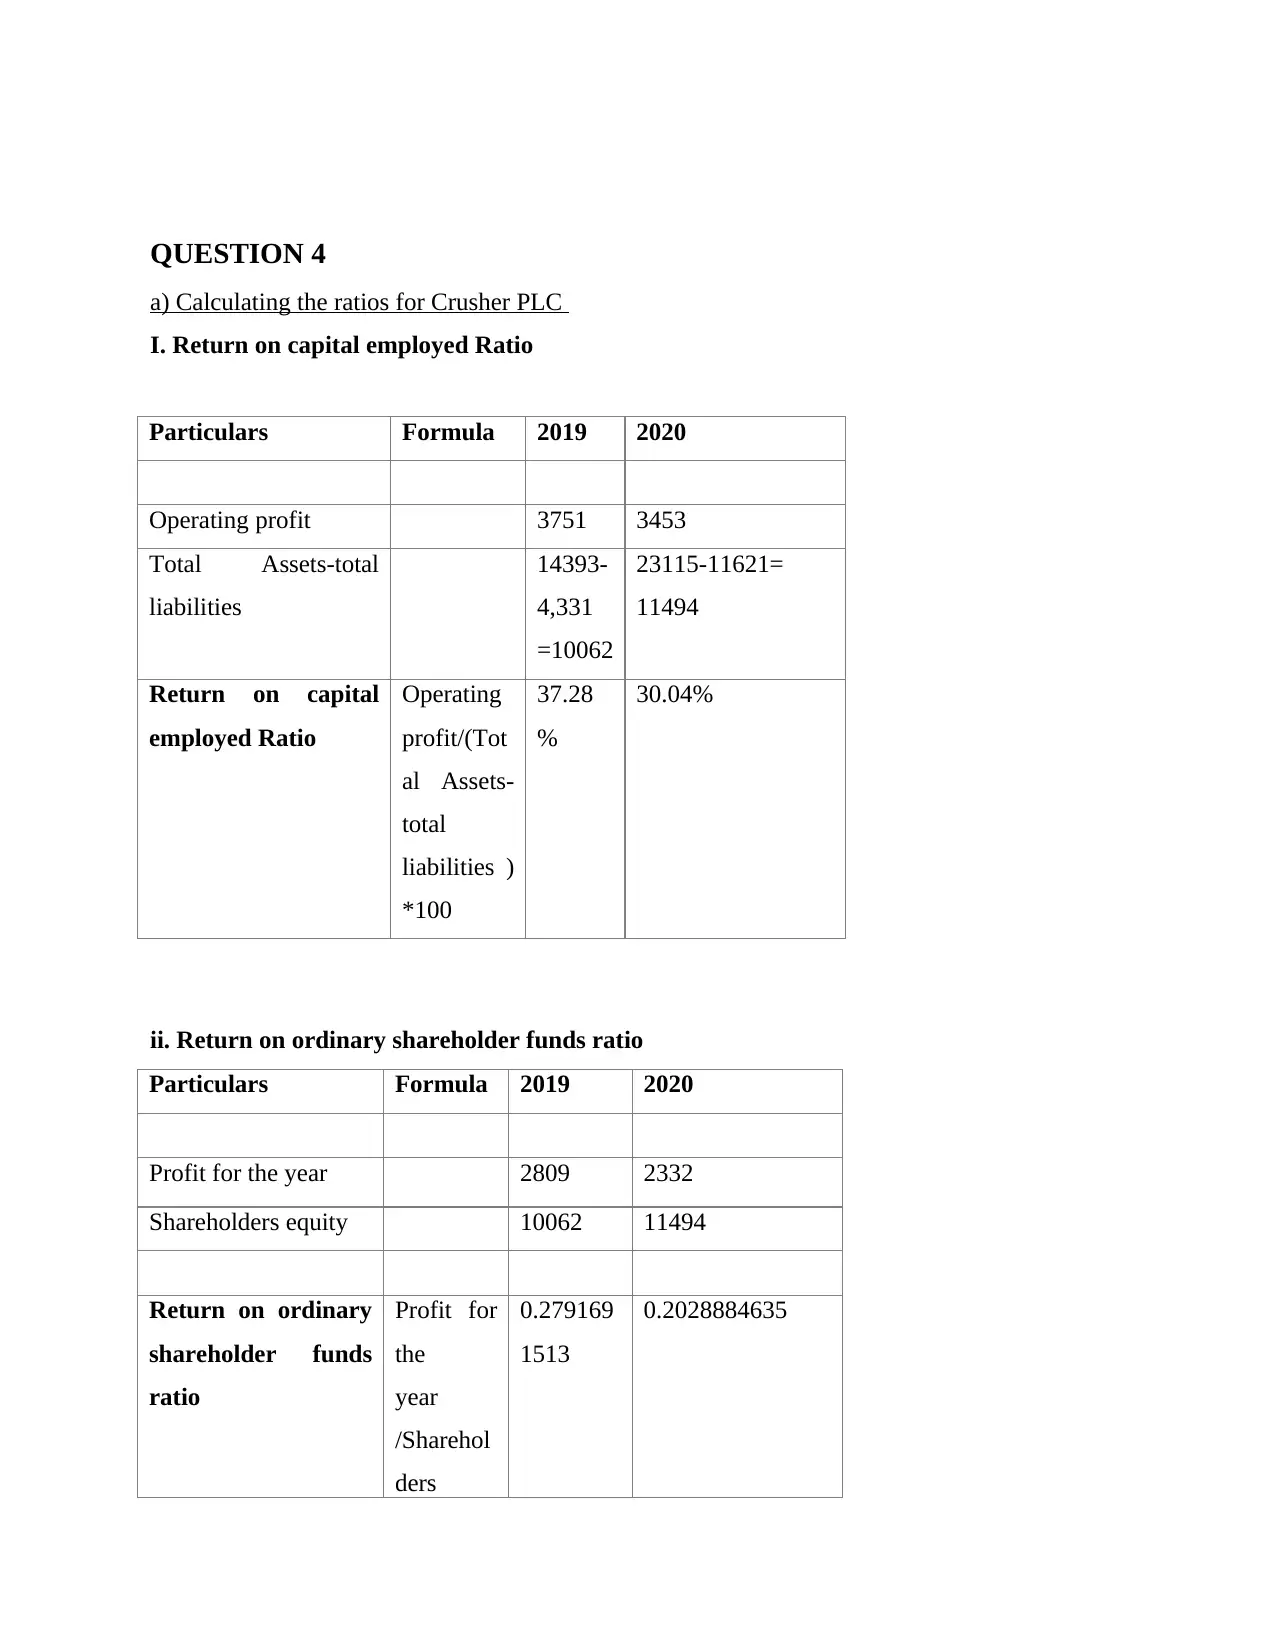
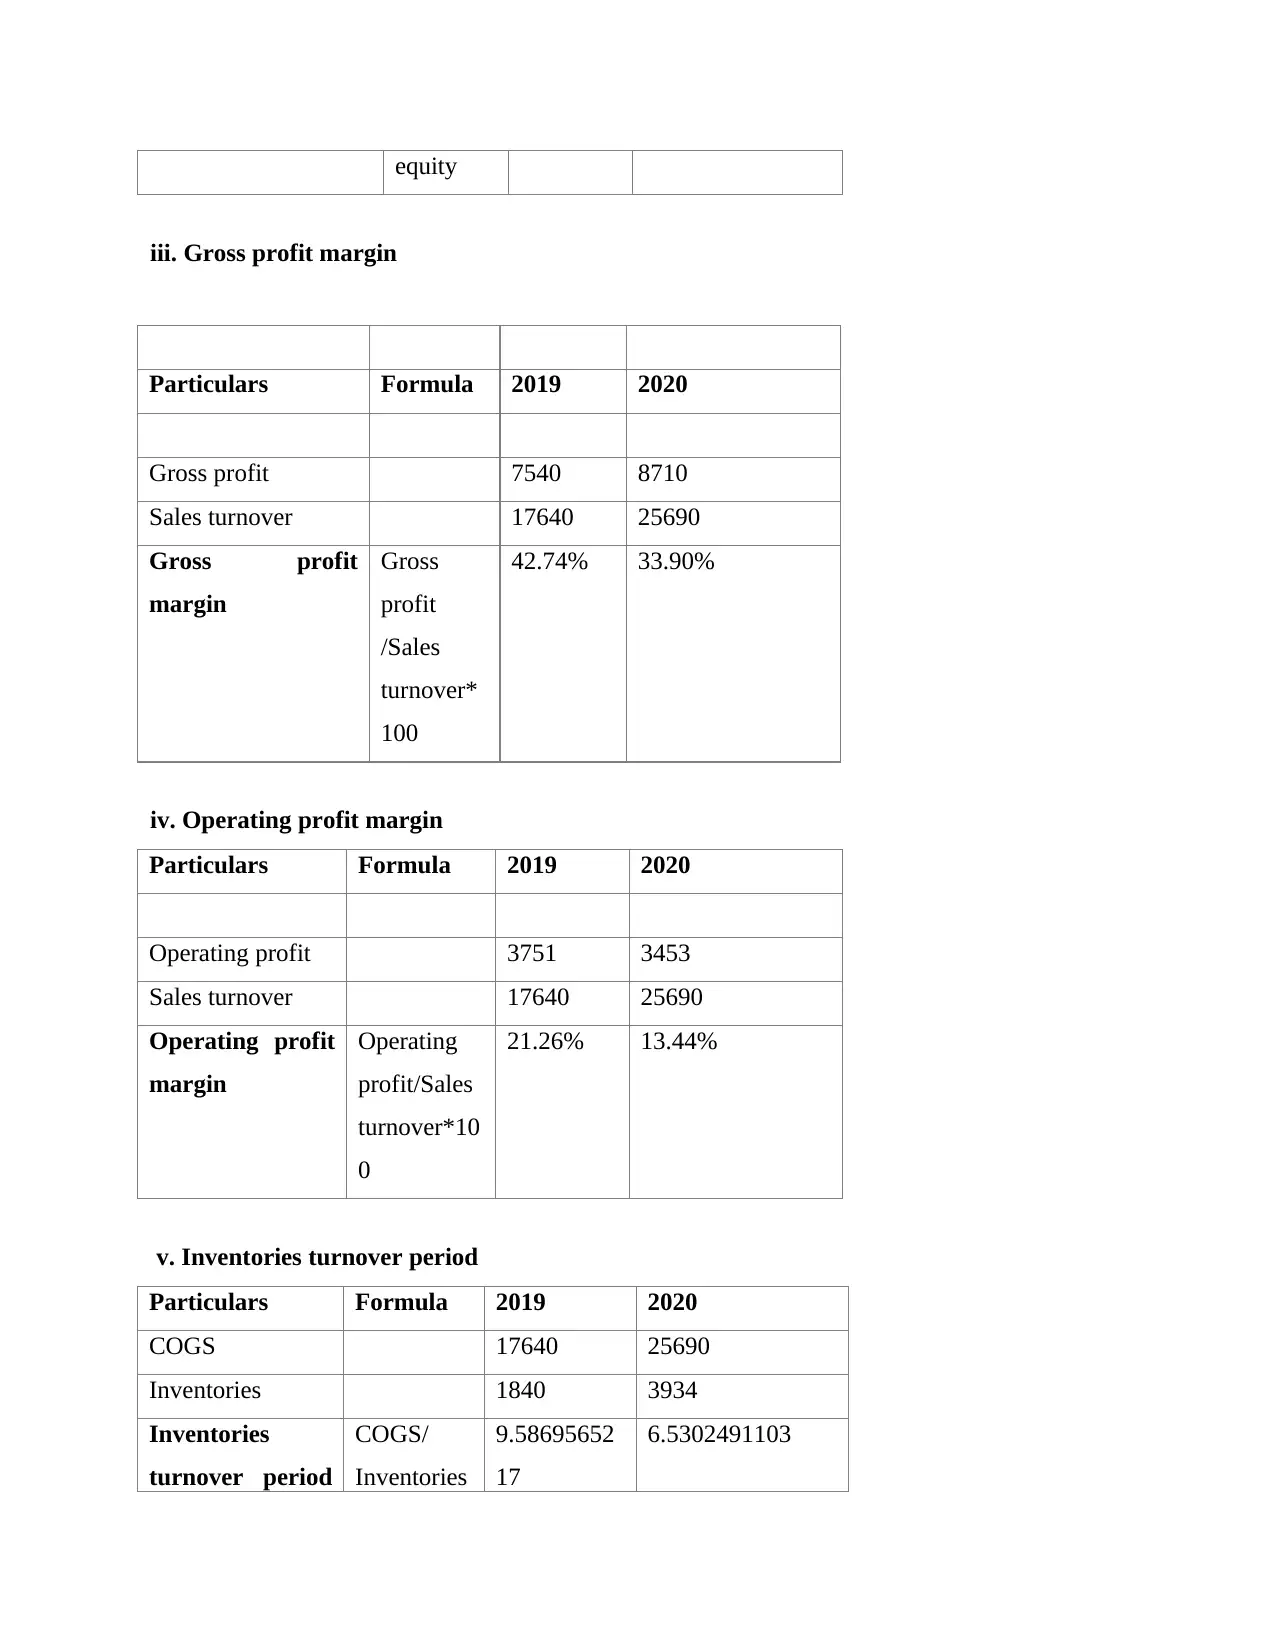
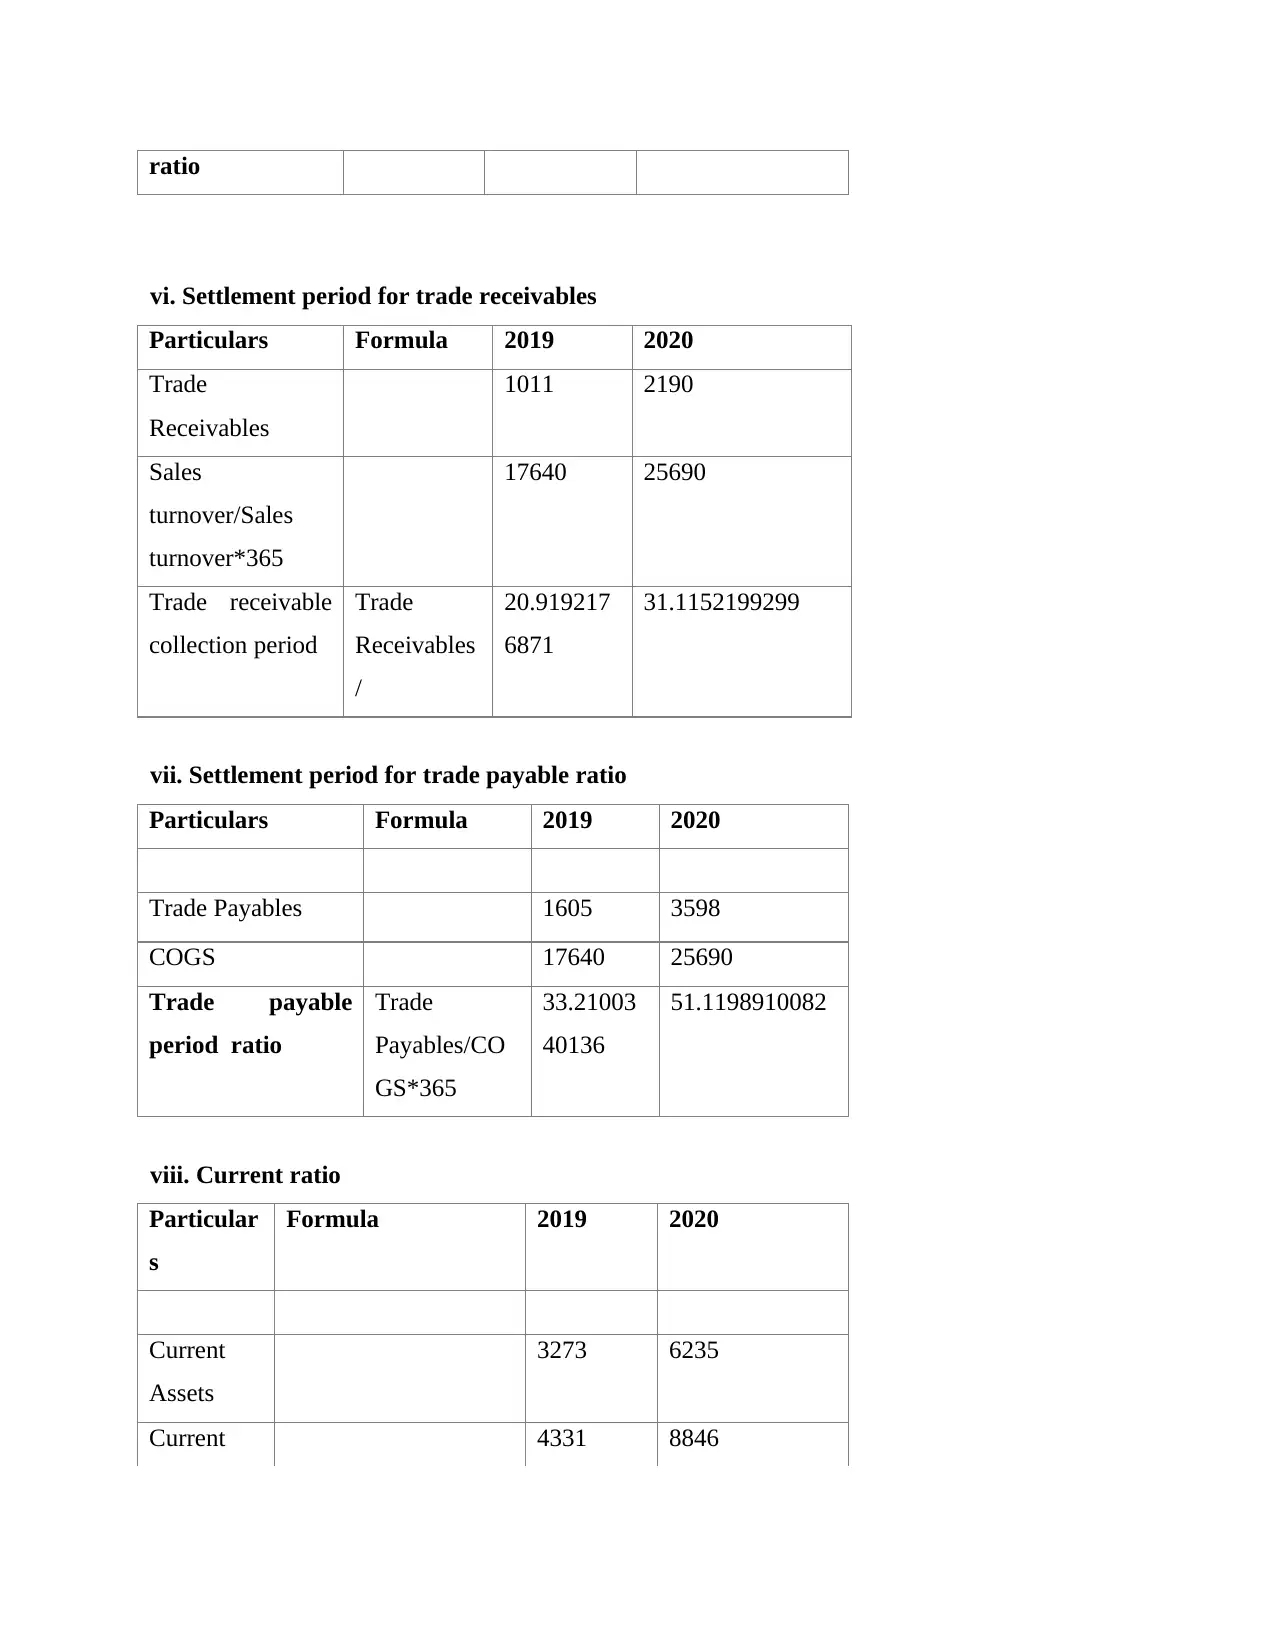
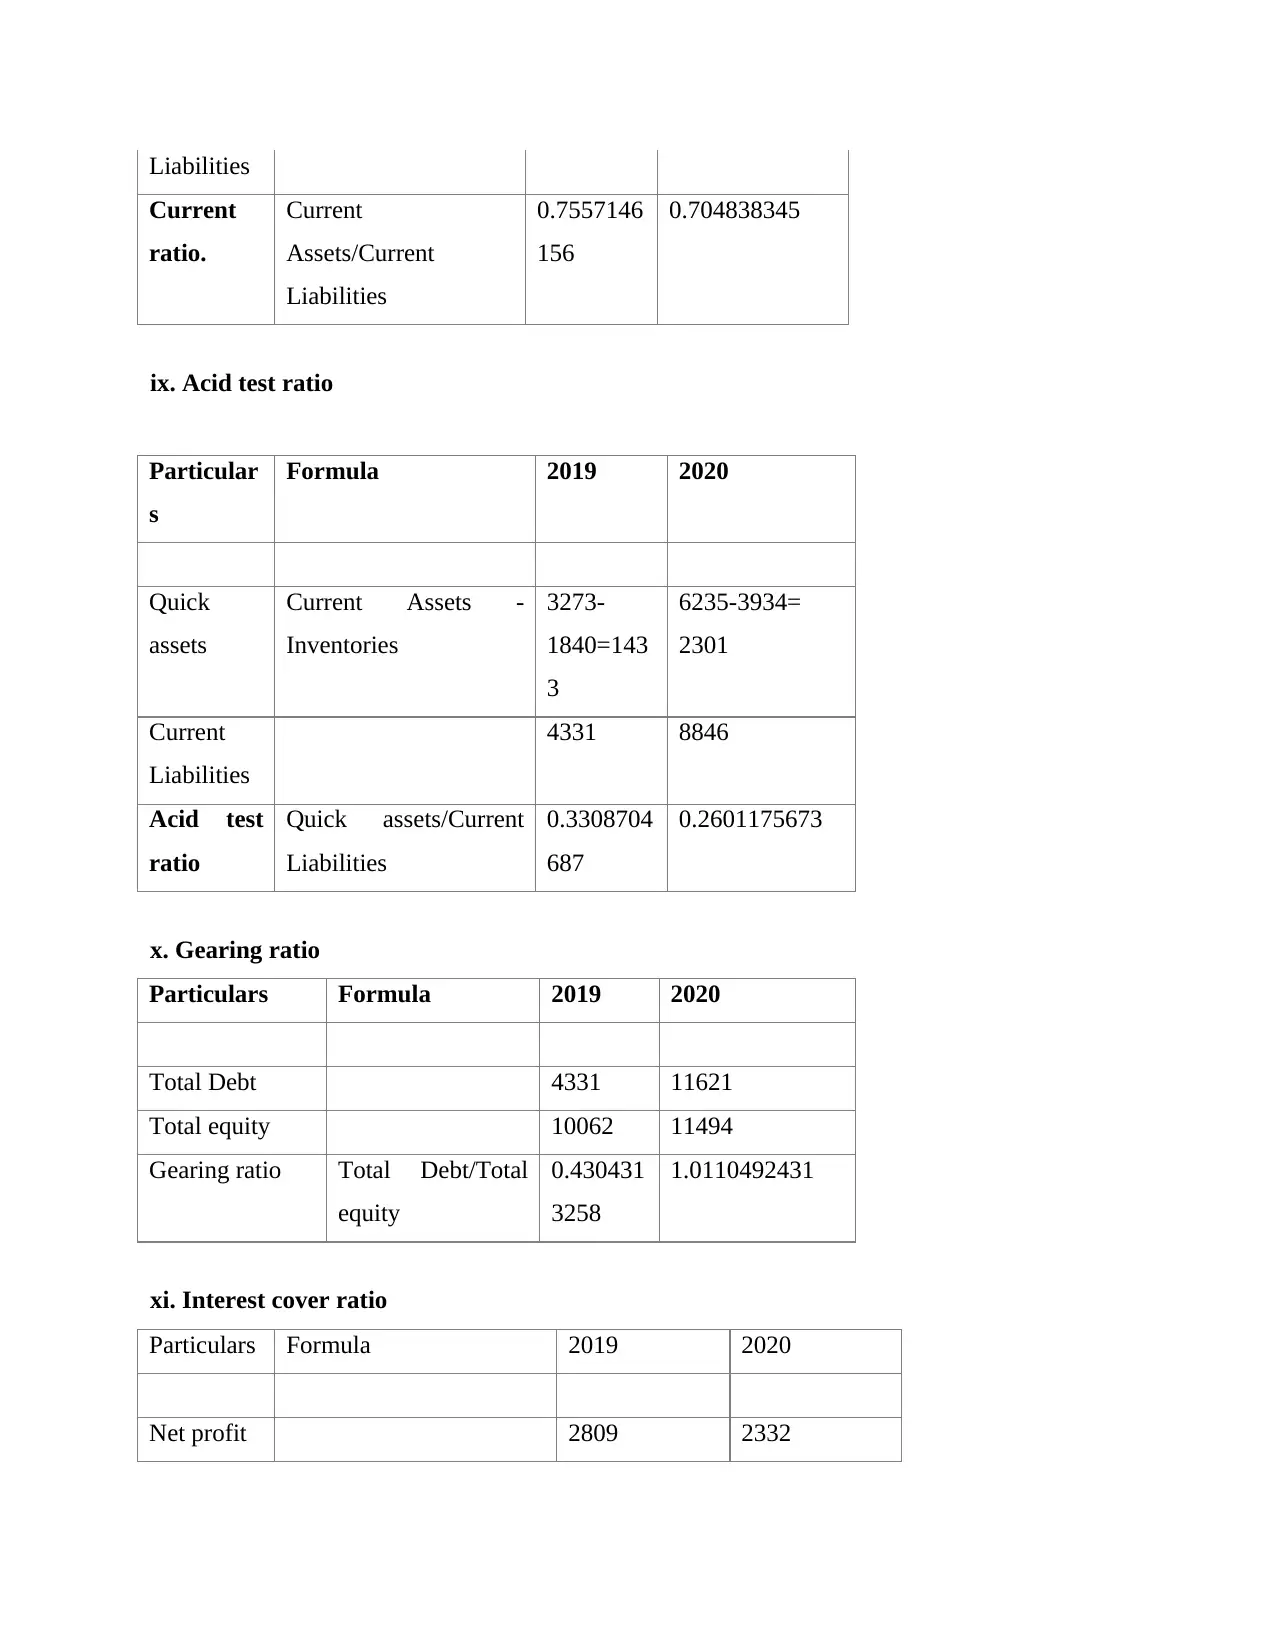
This assignment solution covers key concepts in business finance, including investment appraisal techniques and financial ratio analysis. It begins with the computation of net cash inflows, net present value (NPV), and internal rate of return (IRR) for a project, followed by an analysis of its financial viability and a comparison of different methods for accounting for risk. The solution then calculates and interprets the average operating cycle, current ratio, and acid test ratio. Furthermore, it calculates the theoretical ex-right price of an ordinary share and evaluates various investment options related to rights issues. Finally, the assignment calculates and analyzes several financial ratios for Crusher PLC, including return on capital employed, return on ordinary shareholder funds, gross profit margin, operating profit margin, inventory turnover period, settlement periods for trade receivables and payables, current ratio, acid test ratio, gearing ratio, interest cover ratio, earnings per share, and dividend cover ratio, providing a comprehensive assessment of the company's financial position. Desklib provides a platform for students to access similar solved assignments and past papers.

Business Finance
Paraphrase This Document
Need a fresh take? Get an instant paraphrase of this document with our AI Paraphraser

TABLE OF CONTENTS
INTRODUCTION...........................................................................................................................3
MAIN BODY..................................................................................................................................3
CONCLUSION...............................................................................................................................3
REFERENCES................................................................................................................................4

INTRODUCTION
MAIN BODY
QUESTION 1
Computation of net cash inflow
Particulars Year 2011 Year 2012 Year 2013 Year 2014 Year 2015
Sales (no. of units * rate) (In£) 3600000 4275000 5625000 4050000 2700000
Less: expenses (in£)
Variable labor cost 375 375 375 375 375
Variable material cost 250 250 250 250 250
Lease 550000 550000 550000 550000 550000
Administrative cost 600000 600000 600000 600000 600000
Total expenses 1150625 1150625 1150625 1150625 1150625
Less: Depreciation 500000 500000 500000 500000 500000
Earnings before interest and tax 1949375 2624375 3974375 2399375 1049375
Less: Interest 0 0 0 0 0
Earning before tax 1949375 2624375 3974375 2399375 1049375
Less: Tax 0 0 0 0 0
Earning after tax 1949375 2624375 3974375 2399375 1049375
Add: Depreciation 500000 500000 500000 500000 500000
Net cash inflows 2449375 3124375 4474375 2899375 1549375
Year Net cash
inflows
Present
value
factor
Discounted
cash inflows
2011 2449375 0.926 2267939.815
2012 3124375 0.857 2678647.977
2013 4474375 0.794 3551903.133
2014 2899375 0.735 2131127.179
2015 1549375 0.681 1054478.591
⊘ This is a preview!⊘
Do you want full access?
Subscribe today to unlock all pages.

Trusted by 1+ million students worldwide

Total of present value factor & discounted
cash inflows
14496875 11684096.7
Computation of Net present value
Total discounted cash
inflows 11684096.7
Less: Initial investment 2500000
Net present value 9184096.695
cash inflows
14496875 11684096.7
Computation of Net present value
Total discounted cash
inflows 11684096.7
Less: Initial investment 2500000
Net present value 9184096.695
Paraphrase This Document
Need a fresh take? Get an instant paraphrase of this document with our AI Paraphraser

b) Determination of internal rate of return.
Computation of IRR:
IRR
Year Cash inflows
0 -2500000
2011 2449375
2012 3124375
2013 4474375
2014 2899375
2015 1549375
Total of IRR 112%
â—¦
c) Analysis of financial viability of investing in the project.
d) Determining and comparing the different methods that can be account for risk while analysing
the viability of project.
QUESTION 2
(a) Calculation of average operating cycle in days and how this measure is put to use
ï‚· Particulars Formula Amount
Operating cycle:
COGS 5106
Average inventory 2648

Sales 8649
Average account
receivable
1428
Inventory turnover Inventory
turnover=
(COGS /Average
inventory)
1.93
Accounts
receivable turnover
Accounts
receivable
turnover=(Net sales
/ Average account
receivable)
6.06
Inventory period Inventory period=
(365/ Inventory
turnover)
189.29
Accounts
receivable period
Accounts
receivable period=
(365/ Accounts
receivable
turnover)
60.26
Operating cycle Operating cycle=
(Inventory period +
Accounts
receivable period)
249.55
â—¦
⊘ This is a preview!⊘
Do you want full access?
Subscribe today to unlock all pages.

Trusted by 1+ million students worldwide

b) Calculation and interpretation of current and acid test ratio.
Particulars Formulas Amount
Liquidity ratio
Current assets 4076
Current liabilities 2933
Inventories 2648
Quick asset 1428
Current ratio (Current ratio= Current Asset /
Current Liabilities)
1.39
Liquid ratio (Liquid ratio= Quick Asset /
Current Liabilities)
0.49
QUESTION 3
a) Calculating the theoretical ex right price of an ordinary share in Mainsbury PLC.
Theoretical ex right price = (new share price * issue price+ old shares * market price)/ (New
shares+ old shares)
= (600* 54+3600*35.1)/ (600+3600)
= 158760/4200
= 37.8
Working note:
share market price= 972/18 = 54
Number of shares (Old) = 720/0.20 = 360
New share price = 54*65% = 35.1
New number of shares = 360/6 = 600
Paraphrase This Document
Need a fresh take? Get an instant paraphrase of this document with our AI Paraphraser

b) Calculate the value of the rights associated with holding shares in Mainsbury PLC
Market value of each share= 54
Price to be paid for getting one share in company= 35.1
Value of rights associated with holdings = (Number of right issue / Total holdings )* (Market
value – issue price)
= (600/4200) * (54-35.1)
= 0.142*18.9
= 2.68
c) Evaluating each of the option available to investor
ï‚· Right issue for investor
Investor portfolio value = 10,000* 54 = 540000
Number of right shares to be received= (10000/6) = 1667
Price paid to buy right shares= 1667* 35.1 = 58511.7
Total number of shares after practicing the right share = 10000+1667= 11667
Revised value of shares after exercising right issue = 540000+ 58511.7 = 598511.7
Price of shares post right issue= 598511.7/ 11667 = 51.29
According to this, the obtained share price if goes up then investor will be benefit & in
case of decline he will face loss.
ï‚· Selling rights of shares
= (new share price * issue price+ old shares * market price)/ (New shares+ old shares)
= (35.1* 51.29 +10000 *54)/ (10000+1667)
=541800.279/ 11667
=46.43
ï‚· Right to lapse calculations
The right to entitlement price= Share current price- price after right issue
= 54- 35.1
= 18.9
d) comparing and contrasting the various options available to business

QUESTION 4
a) Calculating the ratios for Crusher PLC
I. Return on capital employed Ratio
Particulars Formula 2019 2020
Operating profit 3751 3453
Total Assets-total
liabilities
14393-
4,331
=10062
23115-11621=
11494
Return on capital
employed Ratio
Operating
profit/(Tot
al Assets-
total
liabilities )
*100
37.28
%
30.04%
ii. Return on ordinary shareholder funds ratio
Particulars Formula 2019 2020
Profit for the year 2809 2332
Shareholders equity 10062 11494
Return on ordinary
shareholder funds
ratio
Profit for
the
year
/Sharehol
ders
0.279169
1513
0.2028884635
⊘ This is a preview!⊘
Do you want full access?
Subscribe today to unlock all pages.

Trusted by 1+ million students worldwide

equity
iii. Gross profit margin
Particulars Formula 2019 2020
Gross profit 7540 8710
Sales turnover 17640 25690
Gross profit
margin
Gross
profit
/Sales
turnover*
100
42.74% 33.90%
iv. Operating profit margin
Particulars Formula 2019 2020
Operating profit 3751 3453
Sales turnover 17640 25690
Operating profit
margin
Operating
profit/Sales
turnover*10
0
21.26% 13.44%
v. Inventories turnover period
Particulars Formula 2019 2020
COGS 17640 25690
Inventories 1840 3934
Inventories
turnover period
COGS/
Inventories
9.58695652
17
6.5302491103
Paraphrase This Document
Need a fresh take? Get an instant paraphrase of this document with our AI Paraphraser

ratio
vi. Settlement period for trade receivables
Particulars Formula 2019 2020
Trade
Receivables
1011 2190
Sales
turnover/Sales
turnover*365
17640 25690
Trade receivable
collection period
Trade
Receivables
/
20.919217
6871
31.1152199299
vii. Settlement period for trade payable ratio
Particulars Formula 2019 2020
Trade Payables 1605 3598
COGS 17640 25690
Trade payable
period ratio
Trade
Payables/CO
GS*365
33.21003
40136
51.1198910082
viii. Current ratio
Particular
s
Formula 2019 2020
Current
Assets
3273 6235
Current 4331 8846

Liabilities
Current
ratio.
Current
Assets/Current
Liabilities
0.7557146
156
0.704838345
ix. Acid test ratio
Particular
s
Formula 2019 2020
Quick
assets
Current Assets -
Inventories
3273-
1840=143
3
6235-3934=
2301
Current
Liabilities
4331 8846
Acid test
ratio
Quick assets/Current
Liabilities
0.3308704
687
0.2601175673
x. Gearing ratio
Particulars Formula 2019 2020
Total Debt 4331 11621
Total equity 10062 11494
Gearing ratio Total Debt/Total
equity
0.430431
3258
1.0110492431
xi. Interest cover ratio
Particulars Formula 2019 2020
Net profit 2809 2332
Current
ratio.
Current
Assets/Current
Liabilities
0.7557146
156
0.704838345
ix. Acid test ratio
Particular
s
Formula 2019 2020
Quick
assets
Current Assets -
Inventories
3273-
1840=143
3
6235-3934=
2301
Current
Liabilities
4331 8846
Acid test
ratio
Quick assets/Current
Liabilities
0.3308704
687
0.2601175673
x. Gearing ratio
Particulars Formula 2019 2020
Total Debt 4331 11621
Total equity 10062 11494
Gearing ratio Total Debt/Total
equity
0.430431
3258
1.0110492431
xi. Interest cover ratio
Particulars Formula 2019 2020
Net profit 2809 2332
⊘ This is a preview!⊘
Do you want full access?
Subscribe today to unlock all pages.

Trusted by 1+ million students worldwide
1 out of 15
Related Documents

Your All-in-One AI-Powered Toolkit for Academic Success.
 +13062052269
info@desklib.com
Available 24*7 on WhatsApp / Email
Unlock your academic potential
© 2024  |  Zucol Services PVT LTD  |  All rights reserved.