Investment Appraisal, Cost Behavior & Budgeting for Benetton Plc
VerifiedAdded on 2023/04/21
|14
|3050
|368
Report
AI Summary
This report provides a comprehensive analysis of investment appraisal methods, including Net Present Value (NPV), Payback Period, and Internal Rate of Return (IRR), to evaluate the suitability of a project for Benetton Plc. It recommends accepting the project based on the positive outcomes of these methods. The report also discusses the strengths and weaknesses of each appraisal technique. Furthermore, it examines the impact of cost and cost behavior on budget preparation, categorizing costs into fixed, variable, and mixed costs, and explains how managers use cost behavior analysis for effective cost control. Lastly, it highlights how break-even analysis supports management in budget preparation by providing insights into sales levels needed to avoid losses and make informed decisions about selling costs and prices.

Running head: MANAGEMENT ACCOUNTING
Management Accounting
Name of the Student:
Name of the University:
Author’s Note:
Course ID:
Management Accounting
Name of the Student:
Name of the University:
Author’s Note:
Course ID:
Paraphrase This Document
Need a fresh take? Get an instant paraphrase of this document with our AI Paraphraser
1MANAGEMENT ACCOUNTING
Table of Contents
Part A:..............................................................................................................................................2
Requirement a:.............................................................................................................................2
Requirement b:.............................................................................................................................3
Requirement c:.............................................................................................................................3
Requirement d:.............................................................................................................................3
Requirement e:.............................................................................................................................5
Part B:..............................................................................................................................................8
Requirement a:.............................................................................................................................8
Requirement b:...........................................................................................................................10
References:....................................................................................................................................12
2MANAGEMENT ACCOUNTING
Part A:
Requirement a:
Part A:
Requirement a:
⊘ This is a preview!⊘
Do you want full access?
Subscribe today to unlock all pages.
Trusted by 1+ million students worldwide
3MANAGEMENT ACCOUNTING
Requirement b:
Requirement c:
Requirement d:
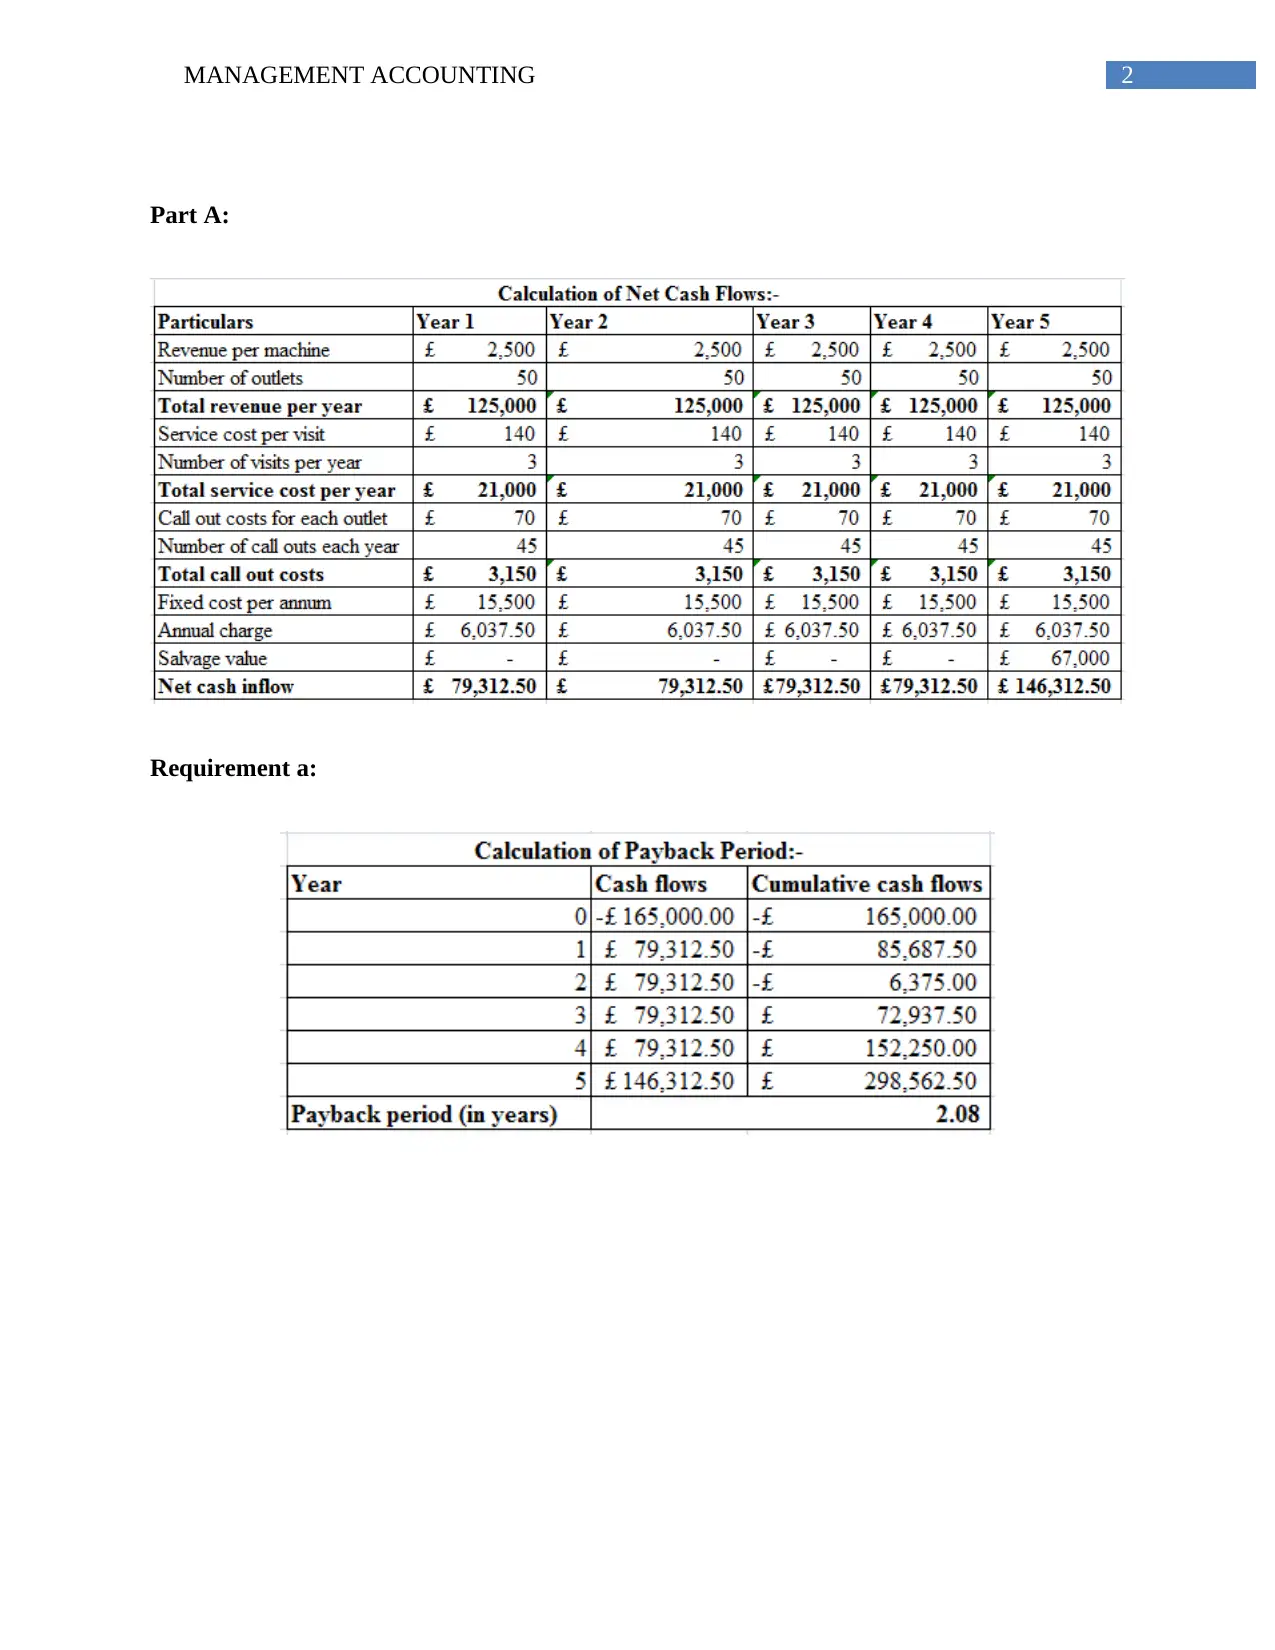
For analysing the suitability of the project in the context of Benetton Plc, the methods of
investment appraisal include net present value, payback period and internal rate of return. In this
case, payback period is calculated as 2.08 years and the economic life of the project is five years.
However, it is noteworthy to mention that payback period is not effective for evaluating two
projects having unequal economic lives. Hence, it becomes difficult to undertake investment
decisions based on the payback period of the project only. However, as the concerned
organisation has to evaluate one project only, this method could be applied and it is evident that
Requirement b:
Requirement c:
Requirement d:
For analysing the suitability of the project in the context of Benetton Plc, the methods of
investment appraisal include net present value, payback period and internal rate of return. In this
case, payback period is calculated as 2.08 years and the economic life of the project is five years.
However, it is noteworthy to mention that payback period is not effective for evaluating two
projects having unequal economic lives. Hence, it becomes difficult to undertake investment
decisions based on the payback period of the project only. However, as the concerned
organisation has to evaluate one project only, this method could be applied and it is evident that
Paraphrase This Document
Need a fresh take? Get an instant paraphrase of this document with our AI Paraphraser
4MANAGEMENT ACCOUNTING
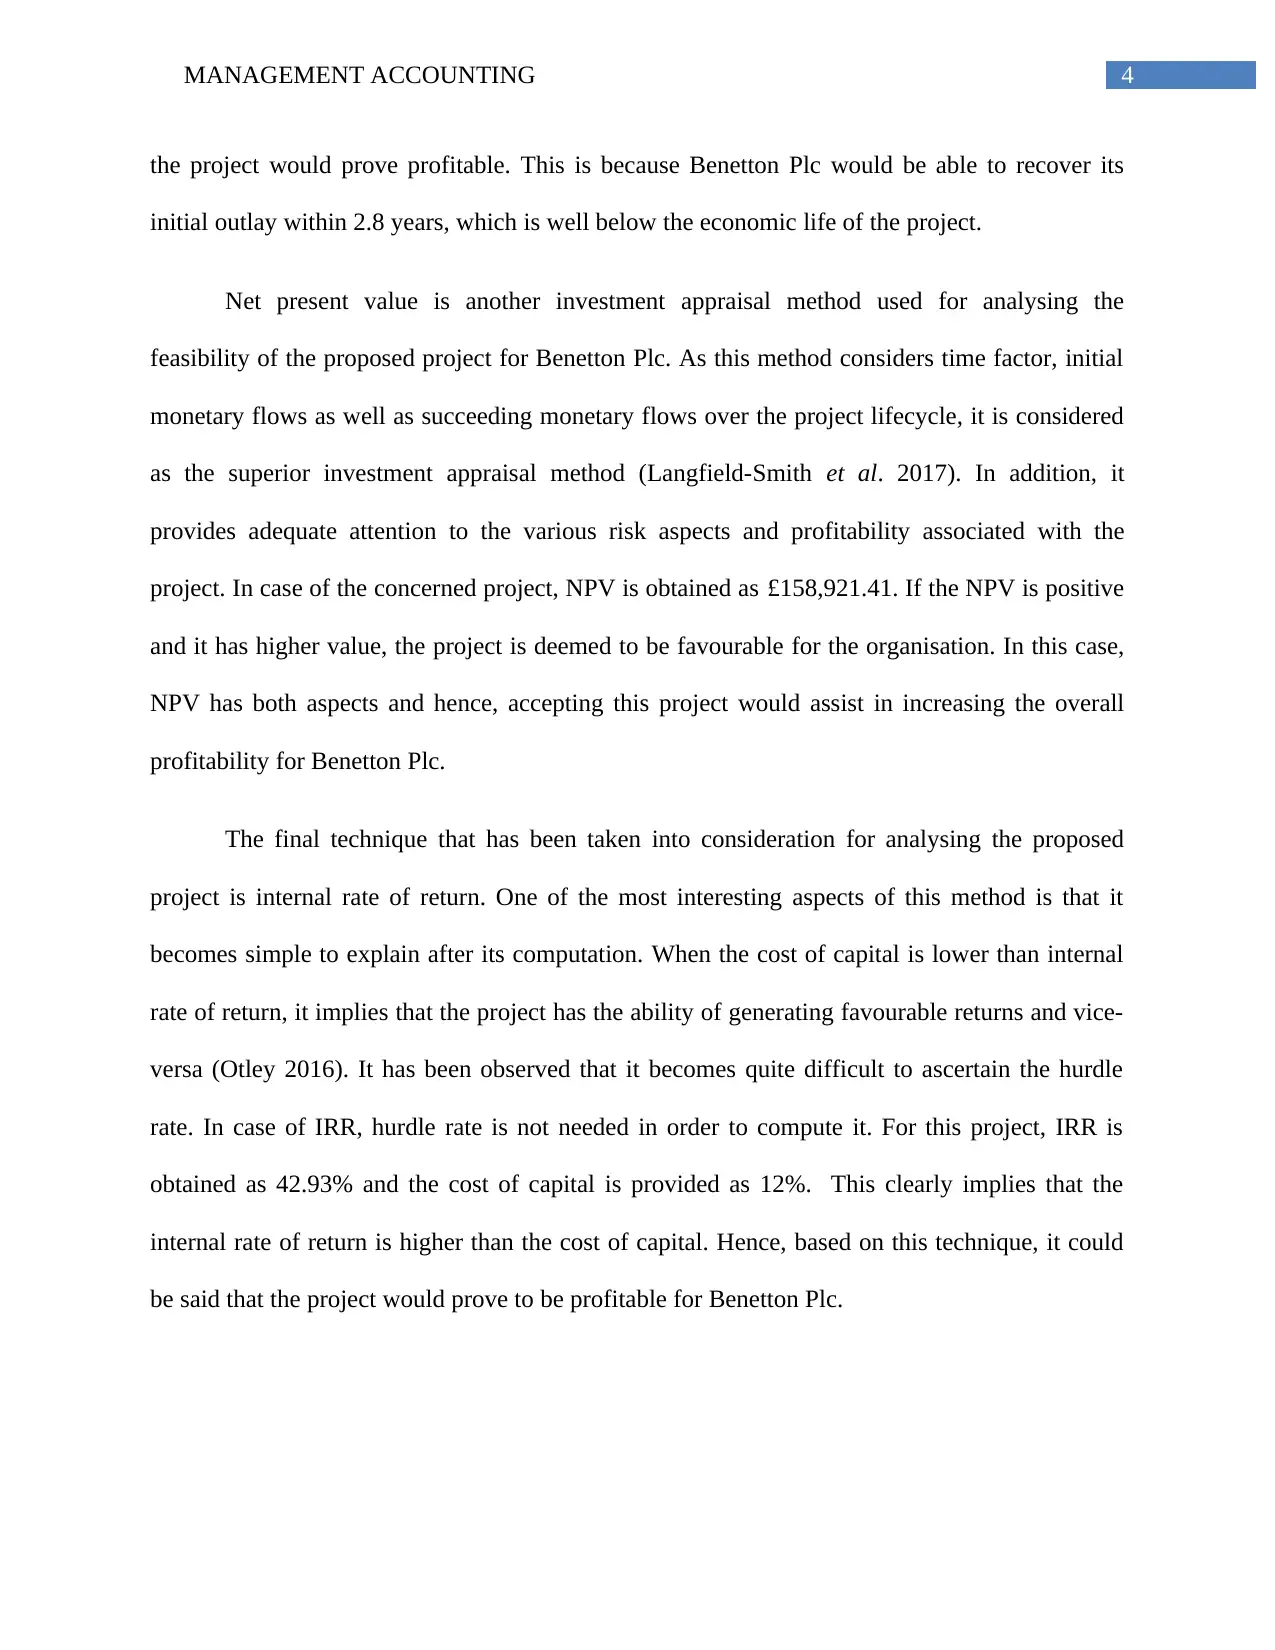
the project would prove profitable. This is because Benetton Plc would be able to recover its
initial outlay within 2.8 years, which is well below the economic life of the project.
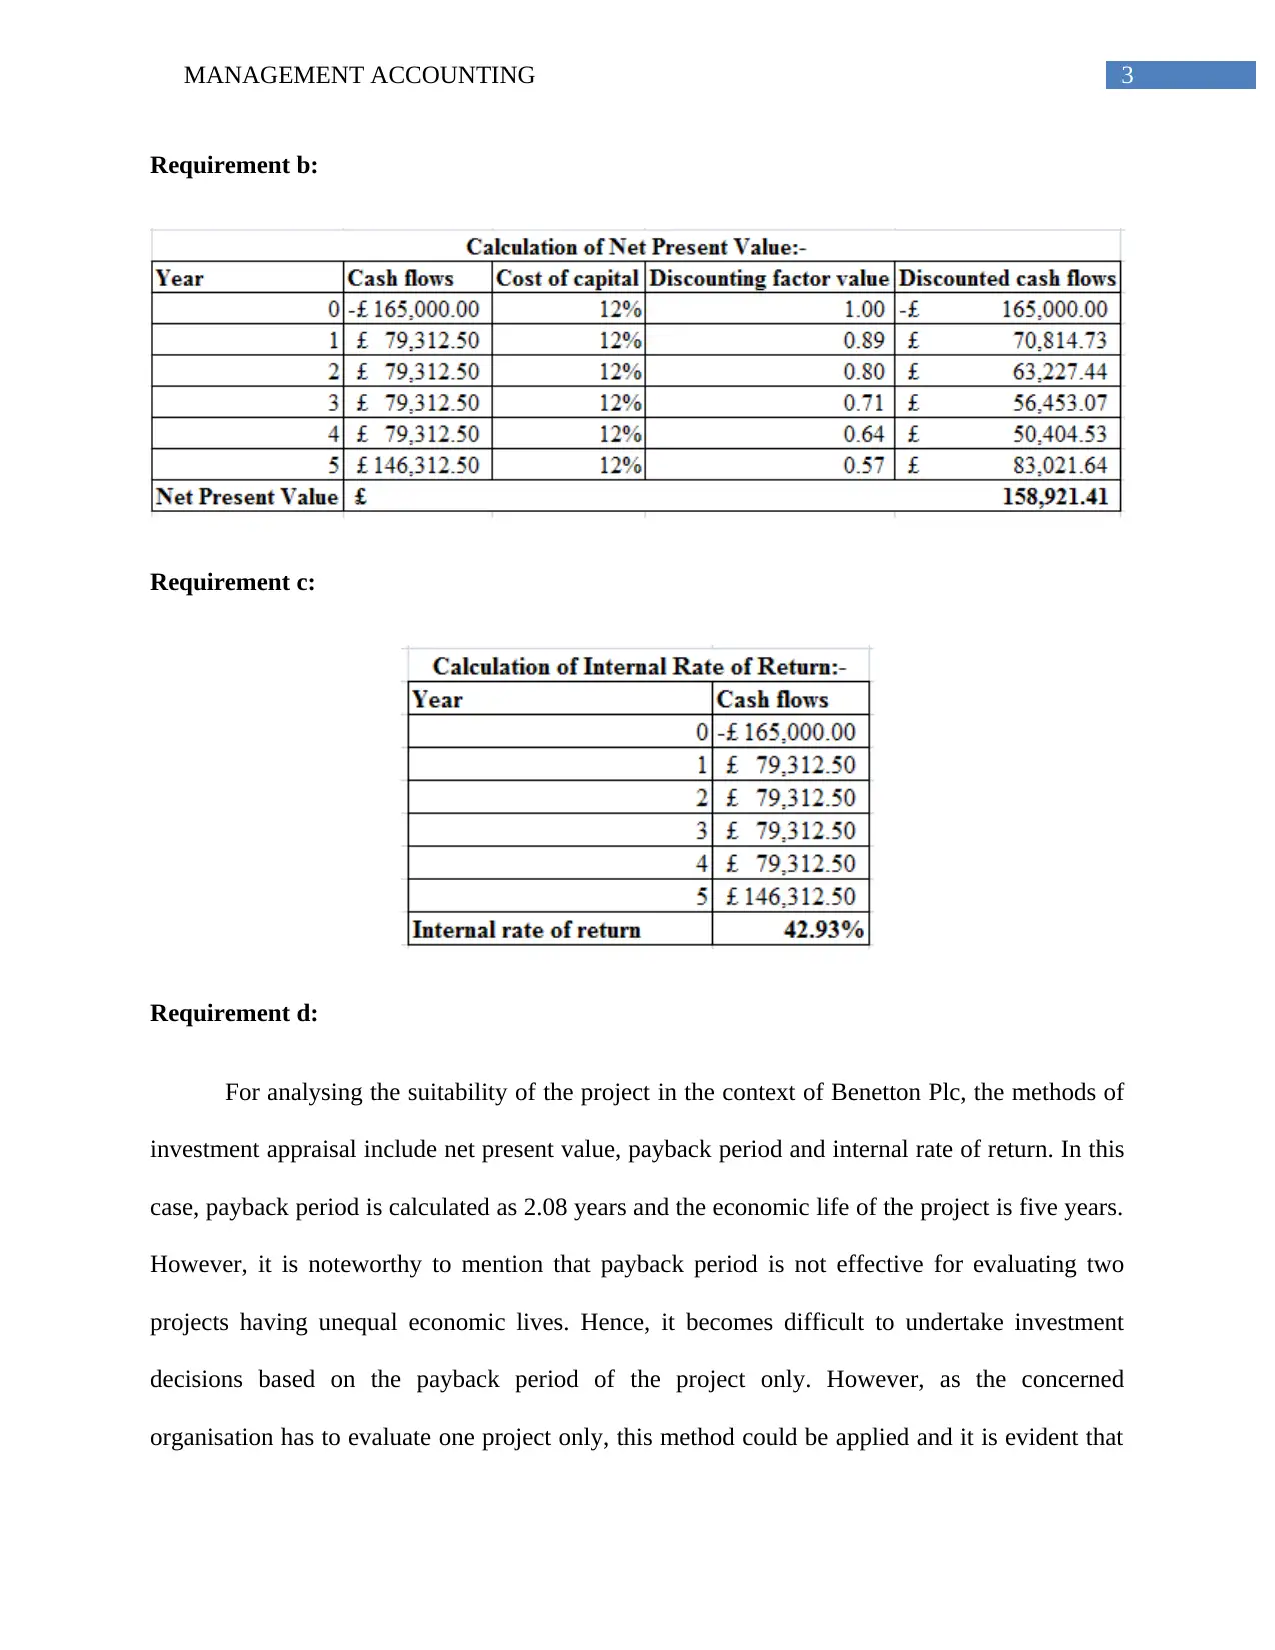
Net present value is another investment appraisal method used for analysing the
feasibility of the proposed project for Benetton Plc. As this method considers time factor, initial
monetary flows as well as succeeding monetary flows over the project lifecycle, it is considered
as the superior investment appraisal method (Langfield-Smith et al. 2017). In addition, it
provides adequate attention to the various risk aspects and profitability associated with the
project. In case of the concerned project, NPV is obtained as £158,921.41. If the NPV is positive
and it has higher value, the project is deemed to be favourable for the organisation. In this case,
NPV has both aspects and hence, accepting this project would assist in increasing the overall
profitability for Benetton Plc.
The final technique that has been taken into consideration for analysing the proposed
project is internal rate of return. One of the most interesting aspects of this method is that it
becomes simple to explain after its computation. When the cost of capital is lower than internal
rate of return, it implies that the project has the ability of generating favourable returns and vice-
versa (Otley 2016). It has been observed that it becomes quite difficult to ascertain the hurdle
rate. In case of IRR, hurdle rate is not needed in order to compute it. For this project, IRR is
obtained as 42.93% and the cost of capital is provided as 12%. This clearly implies that the
internal rate of return is higher than the cost of capital. Hence, based on this technique, it could
be said that the project would prove to be profitable for Benetton Plc.
the project would prove profitable. This is because Benetton Plc would be able to recover its
initial outlay within 2.8 years, which is well below the economic life of the project.
Net present value is another investment appraisal method used for analysing the
feasibility of the proposed project for Benetton Plc. As this method considers time factor, initial
monetary flows as well as succeeding monetary flows over the project lifecycle, it is considered
as the superior investment appraisal method (Langfield-Smith et al. 2017). In addition, it
provides adequate attention to the various risk aspects and profitability associated with the
project. In case of the concerned project, NPV is obtained as £158,921.41. If the NPV is positive
and it has higher value, the project is deemed to be favourable for the organisation. In this case,
NPV has both aspects and hence, accepting this project would assist in increasing the overall
profitability for Benetton Plc.
The final technique that has been taken into consideration for analysing the proposed
project is internal rate of return. One of the most interesting aspects of this method is that it
becomes simple to explain after its computation. When the cost of capital is lower than internal
rate of return, it implies that the project has the ability of generating favourable returns and vice-
versa (Otley 2016). It has been observed that it becomes quite difficult to ascertain the hurdle
rate. In case of IRR, hurdle rate is not needed in order to compute it. For this project, IRR is
obtained as 42.93% and the cost of capital is provided as 12%. This clearly implies that the
internal rate of return is higher than the cost of capital. Hence, based on this technique, it could
be said that the project would prove to be profitable for Benetton Plc.
5MANAGEMENT ACCOUNTING
By considering the outcomes of all the three chosen methods of investment appraisal,
Benetton Plc is recommended to accept the project, as it would help in maximising its
profitability level through which further expansion opportunities could arise in future.
Requirement e:
The strengths and weaknesses of "payback period" are discussed below-
Strengths:
A significant proportion of companies provide employment to newcomers who come from
various backgrounds for examining their financial projects, which are not only prejudicial but
also very difficult to understand (Risinger et al. 2015). Moreover, payback discusses the ('n' of
years), it also allows the newcomers to understand this method with ease.
Authenticating which projects could generate quicker earnings is vital to those organisations,
which do not have adequate resources. The managers utilise the method to produce quicker
analysis regarding to the projects with minimum investment and a restricted payback period
(Carvalho, Meier and Wang 2016).
Weaknesses:
The most noteworthy drawback of this process is the ignorance of time factor while
analysing the suitability of a project. The cash flows generated from the initial years of a project
are generally more than those generated in the later years (Eberhardt, Bruine De Bruin and
Strough 2017). The payback period could be identical for many projects; however, two projects
could generate more cash flows in the initial years and later years respectively. Therefore, using
⊘ This is a preview!⊘
Do you want full access?
Subscribe today to unlock all pages.
Trusted by 1+ million students worldwide
6MANAGEMENT ACCOUNTING
only the payback period for project selection or investment decision might not be a feasible
option.
For specific projects, the highest cash flows would not take place after the completion of
payback time. Such projects would fetch better return on investment and they would be suitable
to projects having restricted payback periods (Goetsch and Davis 2014).
The strengths and weaknesses of "net present value" (NPV) are discussed below-
Strengths:
NPV puts emphasis on time value of money.
During the calculation of NPV, preliminary cash flows and following cash flows over the
duration of the project is taken into account (Hirshleifer, Jian and Zhang 2016).
Proper focus is given to the benefit and risk elements associated with the project.
The value of the company rises owing to the implementation of this method.
Weaknesses:
Implementation of this method is not always possible.
NPV declines to give accurate decision if the total of the investment of conflicting
projects are not similar (Ingram et al. 2015).
Calculation of authentic discount rate is not always possible.
This method declines to provide feasible decisions when the duration of the projects are
not identical.
The strengths and weaknesses of "internal rate of return" (IRR) are discussed below-
Strengths:
Paraphrase This Document
Need a fresh take? Get an instant paraphrase of this document with our AI Paraphraser
7MANAGEMENT ACCOUNTING
The most interesting fact about this method is that it is well defined after the (IRR) has been
calculated. If IRR surpasses cost of capital, then the project would be accepted (Levin, James and
Nolan 2014). It could be very easily understood by the managers and that is why it is accepted
till the period they arrive at a specific point when the projects are conflicting and so on.
The (hurdle rate) is a very difficult and one sided element to regulate. In "IRR", this rate or
the (required rate of return) is not required for computing the "IRR". It is not based on this rate
and hence, the danger of an inappropriate calculation of (hurdle rate) could take place (Williams
et al. 2015). Calculation of (NPV), (Profitability) rate require (hurdle rate).
Weaknesses:
Generally, finance managers arrive at positions when the project under examination produces
a compulsion of investing in various projects. For example, if a person invests in an expensive
car, they would need to arrange a place for parking also. These projects are defined as dependent
upon or unpredicted projects, which need to be taken into account by the manager (Chambers,
Echenique and Saito 2016). IRR could approve of purchasing the vehicle, furthermore, if the
total anticipated benefits are excluded in arranging the parking space, there is no point investing.
Periodically the investors would encounter conflicting projects, which implies that if one is
accepted, then the other cannot be accepted. Constructing a hotel or commercial penthouses on a
particular piece of land is an example of conflicting projects. In such a situation, predicting
whether it would be good for investing would not be enough (Frydman and Camerer 2016). The
problem is to know which one is the best. IRR would give a proportional explanation value
which would not be enough.
8MANAGEMENT ACCOUNTING
Part B:
Requirement a:
The "impact of cost and cost behaviour on the preparation of budget" is depicted below:
Cost behaviour analysis discusses the ways through which certain costs behave in a
particular business environment. Thus, the managers are required to understand cost behaviour
for ensuring effective cost control. In this relation, a brief discussion of cost behaviour and the
different types of costs a manager needs to examine is depicted here.
Firstly, analysing costs requires understanding and examining main operations of the
company. The operating levels are explained in financial location and they might be in the form
of miles driven, sales dollars and others. The operation level would be incorporated with changes
in costs. The operational indicators identify the operation, which leads to variation in cost
behaviour. Hence, the managers undertake decisions so that costs could further be controlled.
Costs could be categorised into fixed cost, variable cost and mixed cost.
They are discussed briefly as follows:
Variable cost:
Variable costs are prices of a company that would vary in aggregate directly and
additionally with the changes in a functional level. For example, with the increase in functional
level by 20%, there would be rise in variable costs by the same percentage. The proportion
would be the same with the downfall in functional level. Variable costs mainly include direct
materials and direct labour. For instance, if an organisation uses its vehicles more, it would have
to bear additional fuel expenses. Thus, if the functional level driving increases by 25%, the costs
⊘ This is a preview!⊘
Do you want full access?
Subscribe today to unlock all pages.
Trusted by 1+ million students worldwide
9MANAGEMENT ACCOUNTING
for fuel and other driving expenses would increase by 25% as well (Lu, Won and Cheng 2016).
In order to compute variable costs, least square regression method is deemed to be suitable.
Computer spreadsheet program is needed like calculator or MS Excel, as it uses all points of data
instead of two points such as high-low method.
Fixed cost:
Fixed costs are prices that have identical aggregate despite the functional level
modifications. Examples include rent, salary, property taxes, insurance and so on (Shahid,
Ahmad and Badar 2017). As fixed costs would not change with functional level and quantity
increases, there would be decline in cost per unit. For instance, it is assumed that an organisation
incur $10,000 as rent per month. Even though the rent expense is fixed irrespective of
production, the unit price of per commodity produced would decline in cost with rise in quantity.
When there is production of additional 10% each month, the aggregate cost per commodity
manufactured would decline by 10%.
Mixed cost:
Mixed costs include those costs, which have both variable costs and fixed costs. A truck
rental is sound example of mixed cost (Shepherd, Williams and Patzelt 2015). For instance,
leasing a truck might bear variable cost of $0.50 per kilometre and $100 as fixed cost. The
managers of business organisations use high-low method for categorising and evaluating mixed
costs. This method is involved in utilising the aggregate prices incurred at both low and high
levels of functions for mixed cost classification into fixed factor and variable factor. The cost
difference between low and high levels provides variable costs, as only the variable cost could
Paraphrase This Document
Need a fresh take? Get an instant paraphrase of this document with our AI Paraphraser
10MANAGEMENT ACCOUNTING
change with the variation in functional levels. Steps in computing fixed and variable prices
utilising high-low method are discussed as follows:
Helps in controlling variable costs each unit.
Helps in authenticating the fixed prices by decreasing the total variable costs at either the
high or low functional level from the aggregate costs at that functional level.
Requirement b:
The support management gains from "break-even analysis" while preparing budget is
discussed below:
Break-even analysis is used in giving answers to question such as "what is the basic level
of sales that ensures the company would not sustain loss" or "how much care sales be decreased
and the company would still keep on earning revenues". Break-even analysis is very crucial
before initiating a new business or launching a new commodity, as it gives answers to essential
questions such as- "how exquisite is the revenue to the company, to either decrease its sales or
increase the costs". This analysis could be also extended to initial level of business in order to
check how accurate the first prediction was and monitor whether the company is on the correct
track or not. Even global companies require to take into account their current break-even point
along with finding quick-fix to reduce that standard in order to increase revenue (Rick et al.
2018).
Entrepreneurs and managers constantly face with issues related to decisions regarding
selling costs and controlling prices. Break- even analysis is the examination of the level of sales
at which a company or a project would make no profit. This method controls the sales needed for
break-even. Break-even analysis could be very useful in the following practical conditions:
11MANAGEMENT ACCOUNTING
1. Setting a new function.
2. While preparing new commodities into manufacturing, such a situation could authenticate the
yield for the new commodity.
3. When expanding basic level of functions of the company.
4. When developing projects in fixed assets and so on.
A company could use break-even analysis to answer the above questions from a pure cost
and from the point of view of profit and when marketing departments are developing strategies,
which involve approving discounts or carrying out promotional campaigns (Diabat et al. 2016).
⊘ This is a preview!⊘
Do you want full access?
Subscribe today to unlock all pages.
Trusted by 1+ million students worldwide
1 out of 14
Related Documents


Your All-in-One AI-Powered Toolkit for Academic Success.
+13062052269
info@desklib.com
Available 24*7 on WhatsApp / Email
![[object Object]](/_next/static/media/star-bottom.7253800d.svg)
Unlock your academic potential
Copyright © 2020–2026 A2Z Services. All Rights Reserved. Developed and managed by ZUCOL.