Investment Appraisal, Long-Term Finance, and CVP Analysis for S Plc
VerifiedAdded on 2023/06/18
|17
|4210
|490
Report
AI Summary
This business report provides a detailed analysis of investment appraisal techniques, cost-volume-profit (CVP) analysis, long-term finance options, and strategic sourcing for S Plc, a computer game company. It assesses the importance of capital investment appraisal, prepares a cash flow analysis, defines the payback period, determines the net present value (NPV), and calculates the internal rate of return (IRR) for a new product line. The report critically contrasts bank loans with equity issues for long-term financing, computes break-even point (BEP), revenue at desired profit, and margin of safety. It also differentiates strategic, preferred, and transactional suppliers, compares single and multiple sourcing benefits, and explains cross-sourcing with examples. The analysis uses financial data to provide recommendations for S Plc's financial and operational strategies, offering a comprehensive overview of key business decisions. Desklib provides access to solved assignments and resources for students.

Business Report
Paraphrase This Document
Need a fresh take? Get an instant paraphrase of this document with our AI Paraphraser
TABLE OF CONTENTS
INTRODUCTION...........................................................................................................................4
TASK...............................................................................................................................................4
A......................................................................................................................................................4
1. Assessing the importance of capital investment appraisal in the context of S plc..................4
2. Preparing a cash flow analysis statement for the concerned investment proposal..................4
3. Defining payback period for the new investment....................................................................5
4. Determining the net present value for the new investment.....................................................6
5. Describing net present value approach and its association with cost of capital......................7
6. Calculating internal rate of return and assessing how cost of capital affect IRR....................7
8. Stating why NPV method is better over IRR...........................................................................8
B.......................................................................................................................................................8
Critically contrast bank loan with equity issue in the context of meeting long-term finance
requirements................................................................................................................................8
C.......................................................................................................................................................9
1) Computing BEP, revenue at desired profit and margin of safety............................................9
2) Assessing the consequences when price increase or decrease by 10%.................................10
3. Critically explaining the assumptions of Cost-volume-profit analysis..................................11
D....................................................................................................................................................12
1) Differentiating strategic, preferred and transactional suppliers...........................................12
2) Comparing the benefits of single and multiple sourcing with regards to procurement........13

3) Explaining cross-sourcing along with its benefits the buyer ad example.............................14
CONCLUSION..............................................................................................................................14
REFERENCES..............................................................................................................................16
CONCLUSION..............................................................................................................................14
REFERENCES..............................................................................................................................16
⊘ This is a preview!⊘
Do you want full access?
Subscribe today to unlock all pages.
Trusted by 1+ million students worldwide
INTRODUCTION
Financial decision making may be defined as a process of selecting best alternative out of
various options available to business unit. In modern era, it is an accountability of manager of
take appropriate decision about financial, investment and operating aspects by evaluating all the
related factors. Moreover, financial growth and success highly depends on the extent to which
firm makes optimum use of monetary resources. The present is report based on case scenario of
S Plc which deals in computer game. Now, for increasing revenue and profit business unit is
planning to add new line of product in the existing range. In this, report will provide deeper
insight about the manner in which investment appraisal techniques can be used for decision
making. Along with this, report will develop understanding about the concept of CVP and its
contribution in business decisions. Further, it entails sources of finance which S Plc can use for
meeting long term financial requirements. Report also highlights different types of suppliers and
sources which used by organization for procurement purpose.
TASK
A
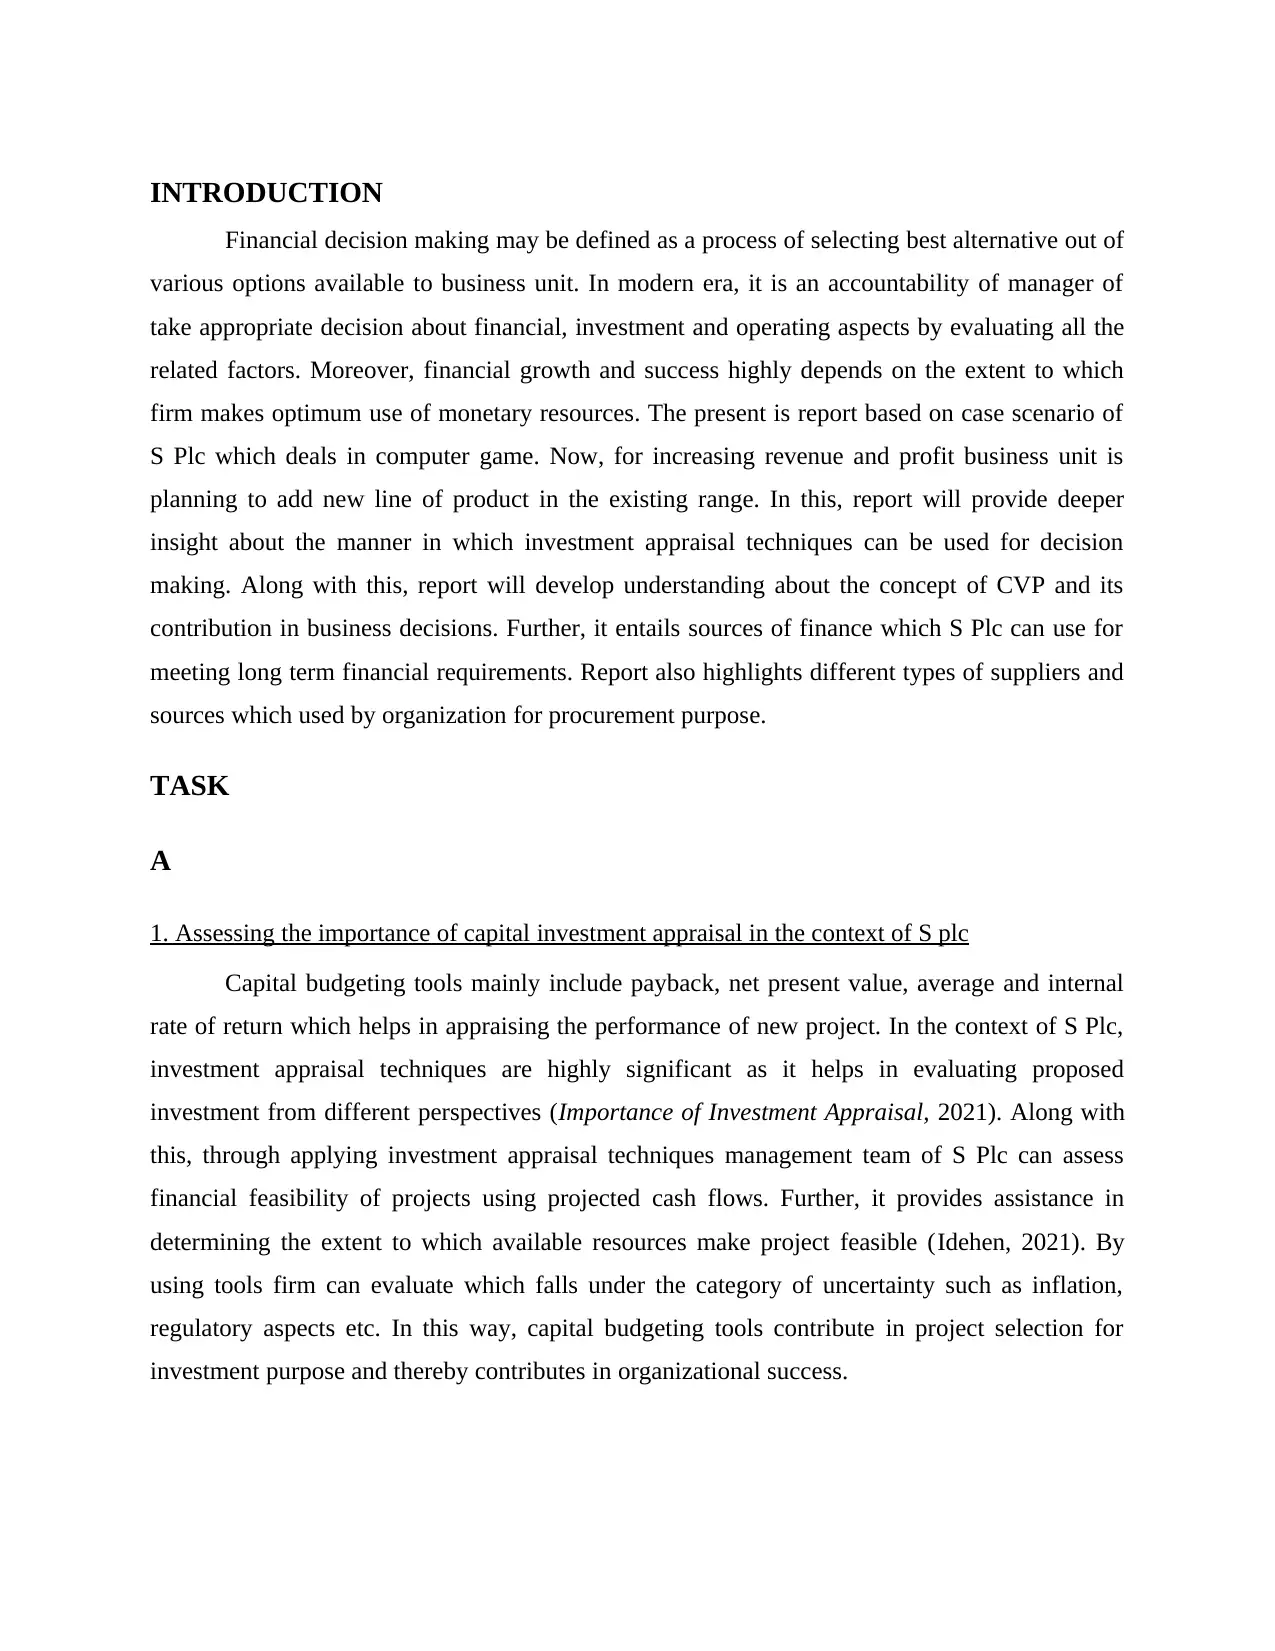
1. Assessing the importance of capital investment appraisal in the context of S plc
Capital budgeting tools mainly include payback, net present value, average and internal
rate of return which helps in appraising the performance of new project. In the context of S Plc,
investment appraisal techniques are highly significant as it helps in evaluating proposed
investment from different perspectives (Importance of Investment Appraisal, 2021). Along with
this, through applying investment appraisal techniques management team of S Plc can assess
financial feasibility of projects using projected cash flows. Further, it provides assistance in
determining the extent to which available resources make project feasible (Idehen, 2021). By
using tools firm can evaluate which falls under the category of uncertainty such as inflation,
regulatory aspects etc. In this way, capital budgeting tools contribute in project selection for
investment purpose and thereby contributes in organizational success.
Financial decision making may be defined as a process of selecting best alternative out of
various options available to business unit. In modern era, it is an accountability of manager of
take appropriate decision about financial, investment and operating aspects by evaluating all the
related factors. Moreover, financial growth and success highly depends on the extent to which
firm makes optimum use of monetary resources. The present is report based on case scenario of
S Plc which deals in computer game. Now, for increasing revenue and profit business unit is
planning to add new line of product in the existing range. In this, report will provide deeper
insight about the manner in which investment appraisal techniques can be used for decision
making. Along with this, report will develop understanding about the concept of CVP and its
contribution in business decisions. Further, it entails sources of finance which S Plc can use for
meeting long term financial requirements. Report also highlights different types of suppliers and
sources which used by organization for procurement purpose.
TASK
A
1. Assessing the importance of capital investment appraisal in the context of S plc
Capital budgeting tools mainly include payback, net present value, average and internal
rate of return which helps in appraising the performance of new project. In the context of S Plc,
investment appraisal techniques are highly significant as it helps in evaluating proposed
investment from different perspectives (Importance of Investment Appraisal, 2021). Along with
this, through applying investment appraisal techniques management team of S Plc can assess
financial feasibility of projects using projected cash flows. Further, it provides assistance in
determining the extent to which available resources make project feasible (Idehen, 2021). By
using tools firm can evaluate which falls under the category of uncertainty such as inflation,
regulatory aspects etc. In this way, capital budgeting tools contribute in project selection for
investment purpose and thereby contributes in organizational success.
Paraphrase This Document
Need a fresh take? Get an instant paraphrase of this document with our AI Paraphraser
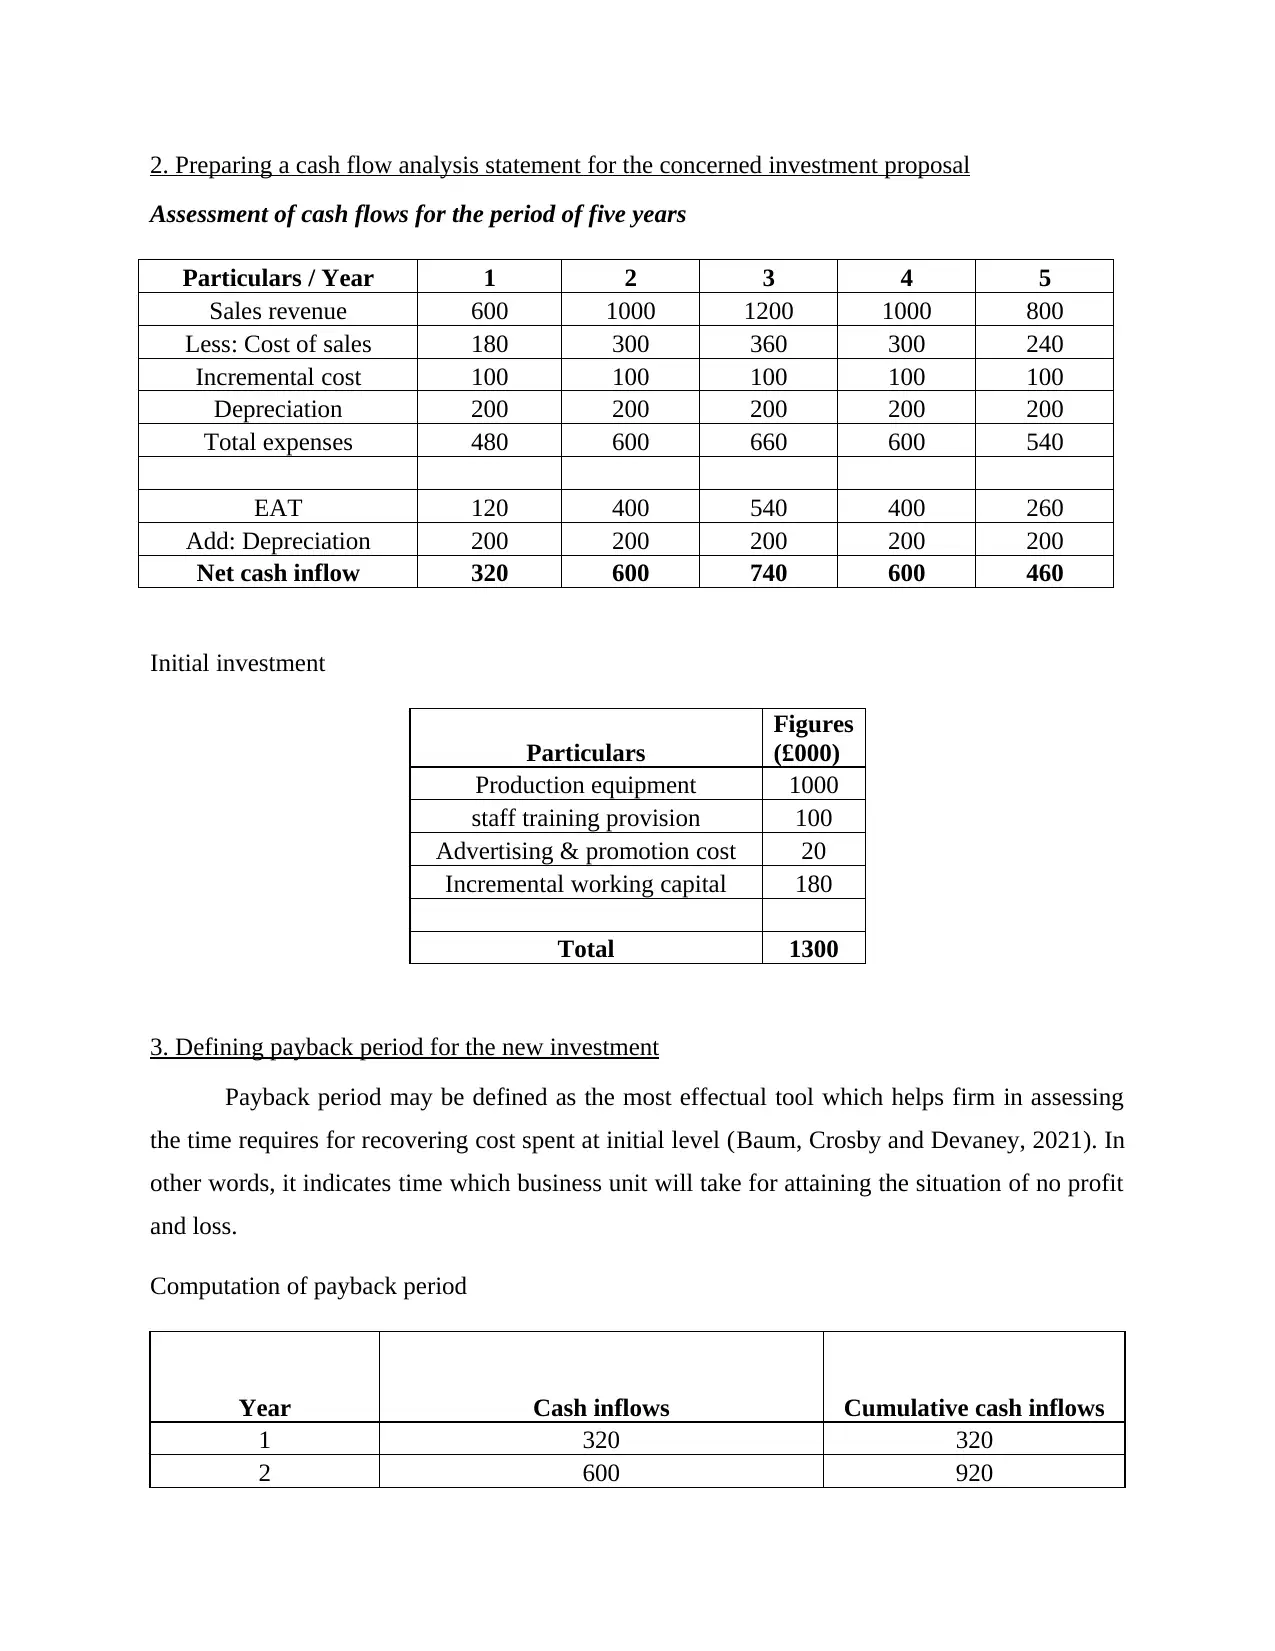
2. Preparing a cash flow analysis statement for the concerned investment proposal
Assessment of cash flows for the period of five years
Particulars / Year 1 2 3 4 5
Sales revenue 600 1000 1200 1000 800
Less: Cost of sales 180 300 360 300 240
Incremental cost 100 100 100 100 100
Depreciation 200 200 200 200 200
Total expenses 480 600 660 600 540
EAT 120 400 540 400 260
Add: Depreciation 200 200 200 200 200
Net cash inflow 320 600 740 600 460
Initial investment
Particulars
Figures
(£000)
Production equipment 1000
staff training provision 100
Advertising & promotion cost 20
Incremental working capital 180
Total 1300
3. Defining payback period for the new investment
Payback period may be defined as the most effectual tool which helps firm in assessing
the time requires for recovering cost spent at initial level (Baum, Crosby and Devaney, 2021). In
other words, it indicates time which business unit will take for attaining the situation of no profit
and loss.
Computation of payback period
Year Cash inflows Cumulative cash inflows
1 320 320
2 600 920
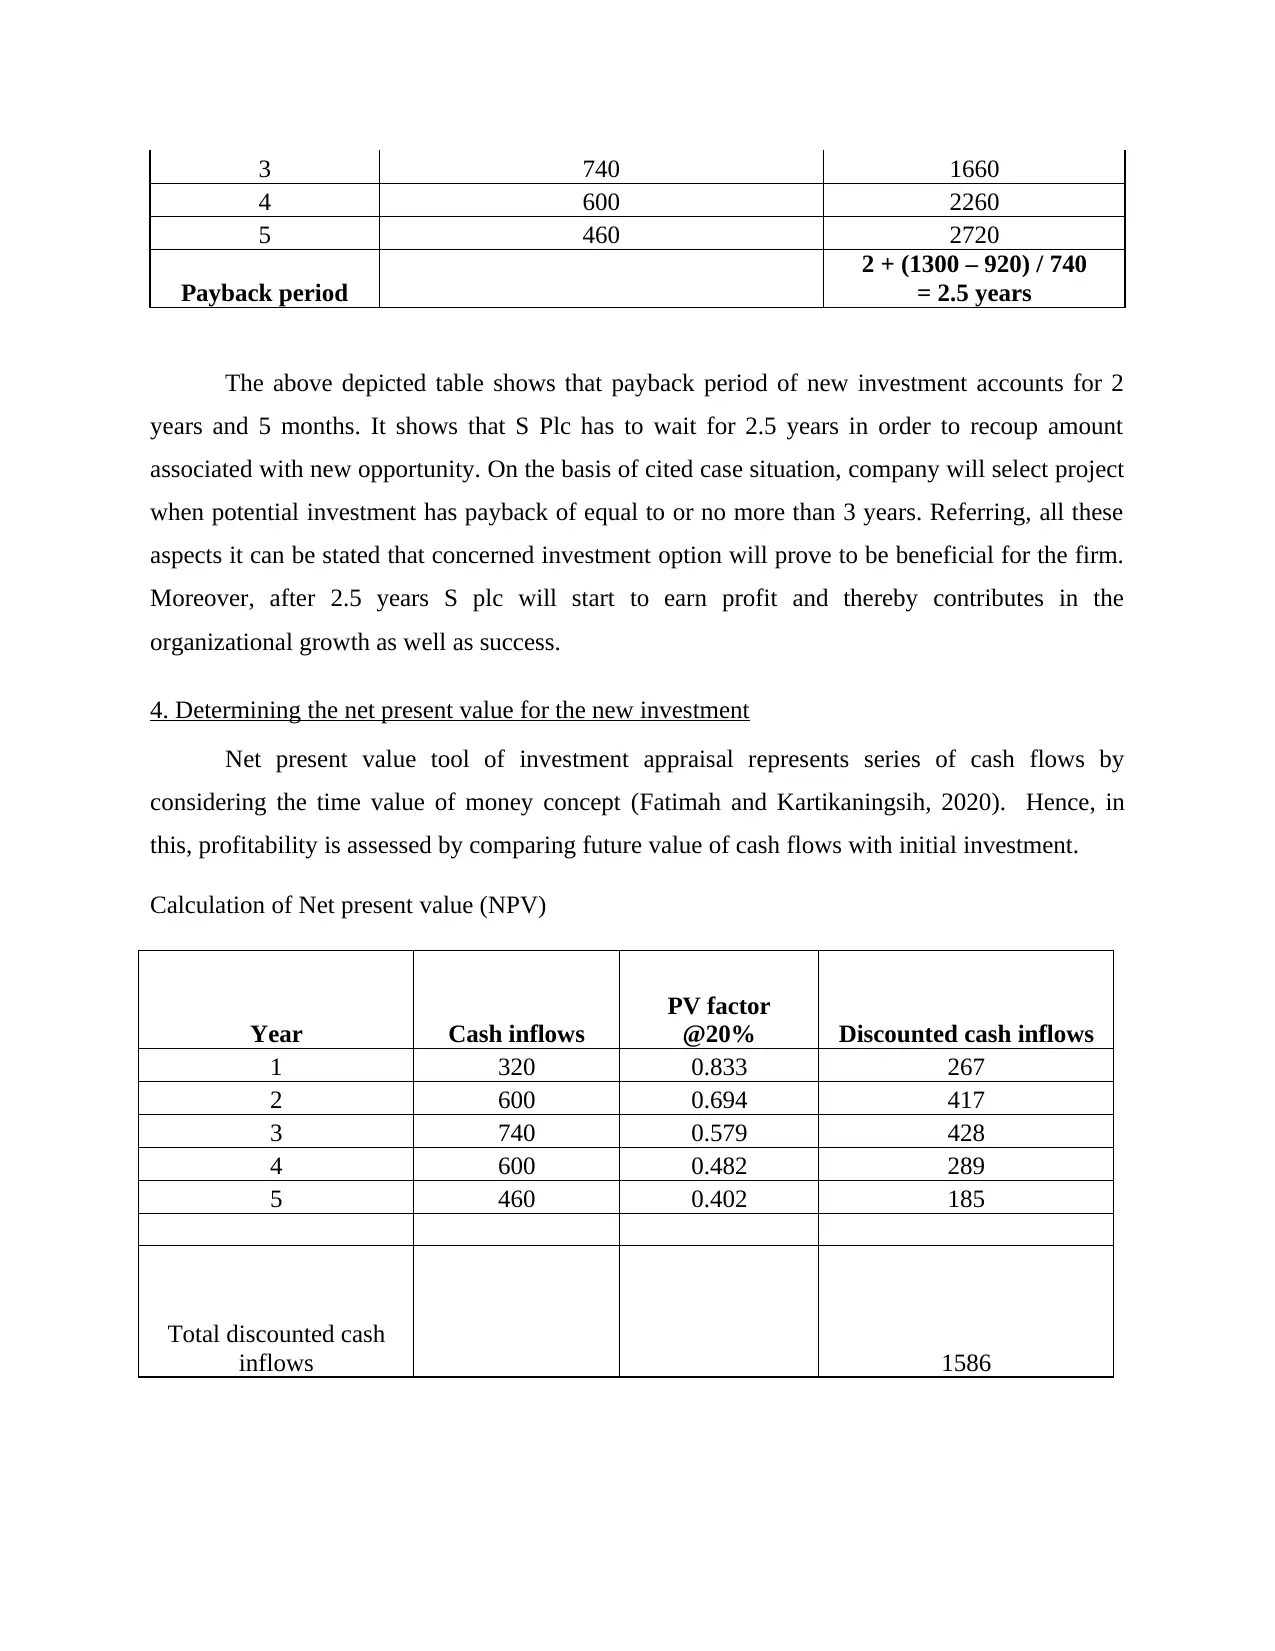
3 740 1660
4 600 2260
5 460 2720
Payback period
2 + (1300 – 920) / 740
= 2.5 years
The above depicted table shows that payback period of new investment accounts for 2
years and 5 months. It shows that S Plc has to wait for 2.5 years in order to recoup amount
associated with new opportunity. On the basis of cited case situation, company will select project
when potential investment has payback of equal to or no more than 3 years. Referring, all these
aspects it can be stated that concerned investment option will prove to be beneficial for the firm.
Moreover, after 2.5 years S plc will start to earn profit and thereby contributes in the
organizational growth as well as success.
4. Determining the net present value for the new investment
Net present value tool of investment appraisal represents series of cash flows by
considering the time value of money concept (Fatimah and Kartikaningsih, 2020). Hence, in
this, profitability is assessed by comparing future value of cash flows with initial investment.
Calculation of Net present value (NPV)
Year Cash inflows
PV factor
@20% Discounted cash inflows
1 320 0.833 267
2 600 0.694 417
3 740 0.579 428
4 600 0.482 289
5 460 0.402 185
Total discounted cash
inflows 1586
⊘ This is a preview!⊘
Do you want full access?
Subscribe today to unlock all pages.
Trusted by 1+ million students worldwide
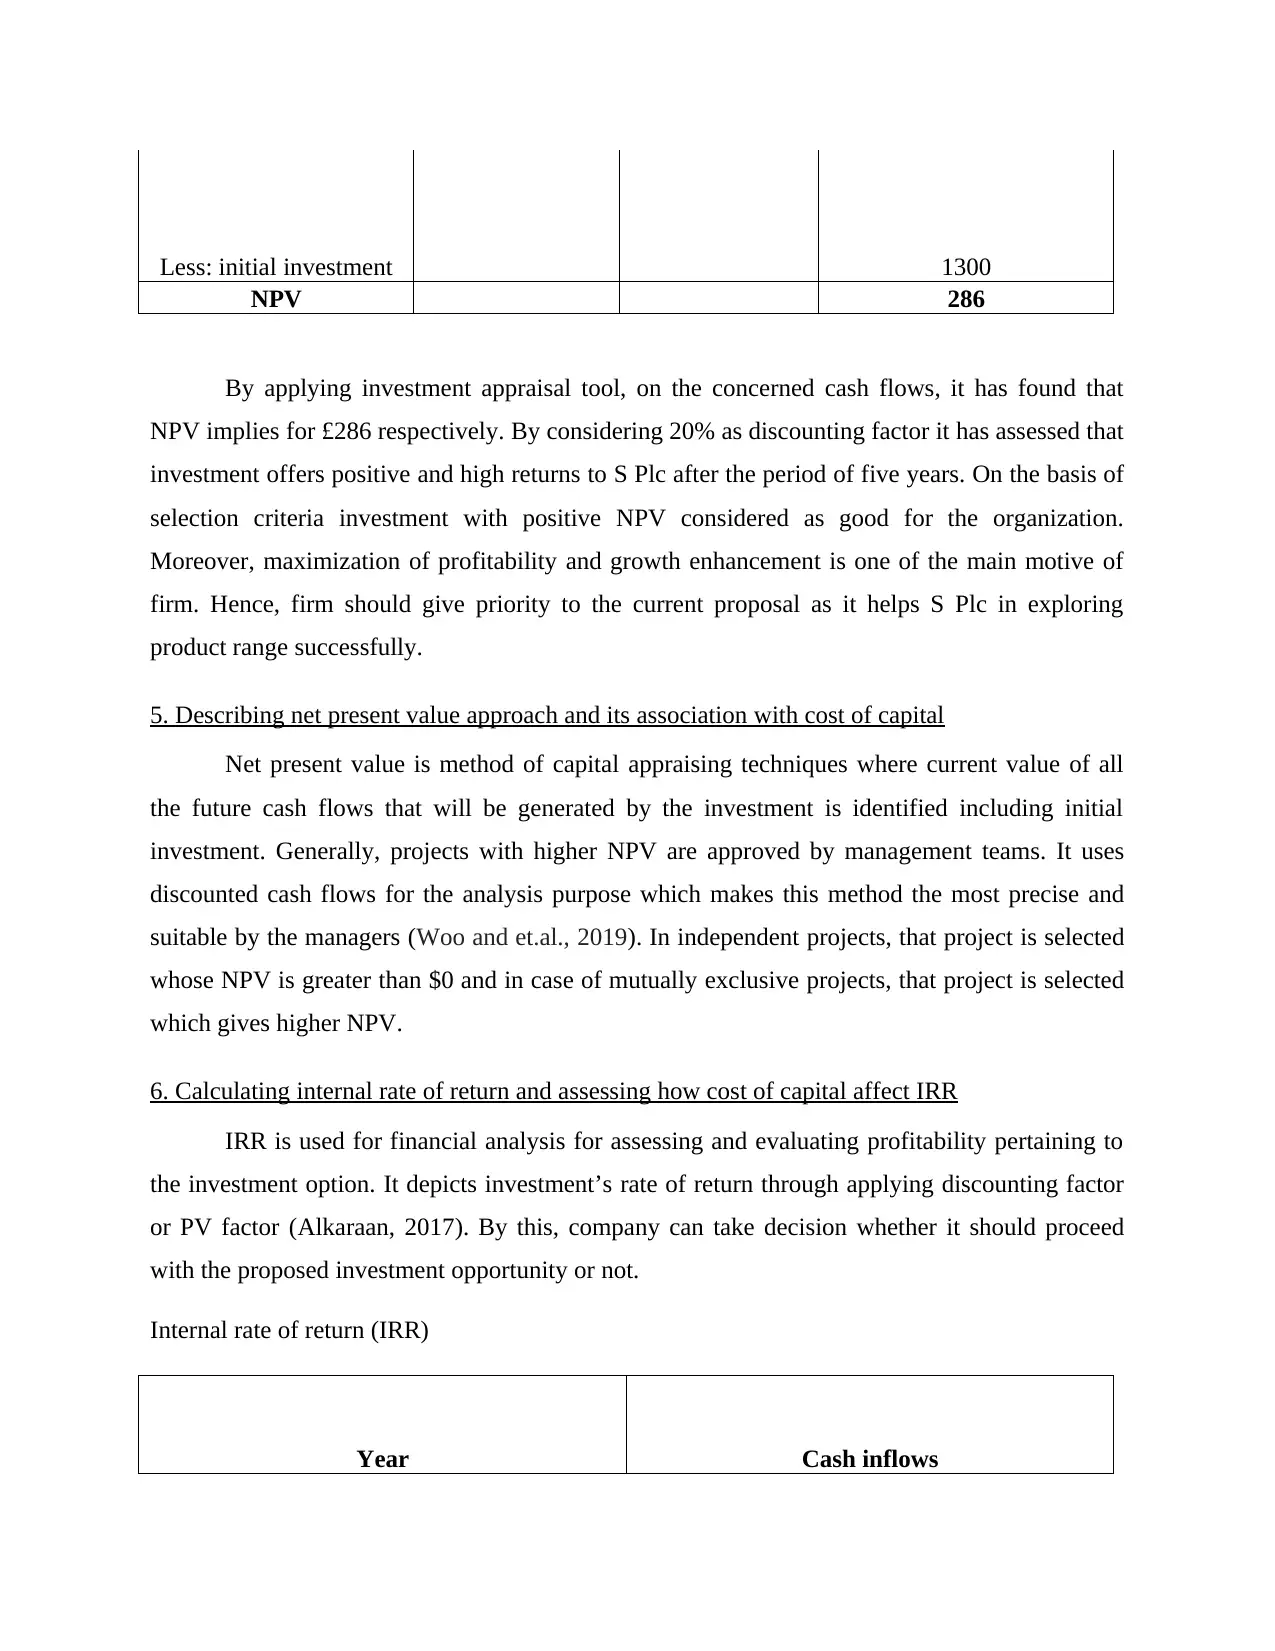
Less: initial investment 1300
NPV 286
By applying investment appraisal tool, on the concerned cash flows, it has found that
NPV implies for £286 respectively. By considering 20% as discounting factor it has assessed that
investment offers positive and high returns to S Plc after the period of five years. On the basis of
selection criteria investment with positive NPV considered as good for the organization.
Moreover, maximization of profitability and growth enhancement is one of the main motive of
firm. Hence, firm should give priority to the current proposal as it helps S Plc in exploring
product range successfully.
5. Describing net present value approach and its association with cost of capital
Net present value is method of capital appraising techniques where current value of all
the future cash flows that will be generated by the investment is identified including initial
investment. Generally, projects with higher NPV are approved by management teams. It uses
discounted cash flows for the analysis purpose which makes this method the most precise and
suitable by the managers (Woo and et.al., 2019). In independent projects, that project is selected
whose NPV is greater than $0 and in case of mutually exclusive projects, that project is selected
which gives higher NPV.
6. Calculating internal rate of return and assessing how cost of capital affect IRR
IRR is used for financial analysis for assessing and evaluating profitability pertaining to
the investment option. It depicts investment’s rate of return through applying discounting factor
or PV factor (Alkaraan, 2017). By this, company can take decision whether it should proceed
with the proposed investment opportunity or not.
Internal rate of return (IRR)
Year Cash inflows
Paraphrase This Document
Need a fresh take? Get an instant paraphrase of this document with our AI Paraphraser
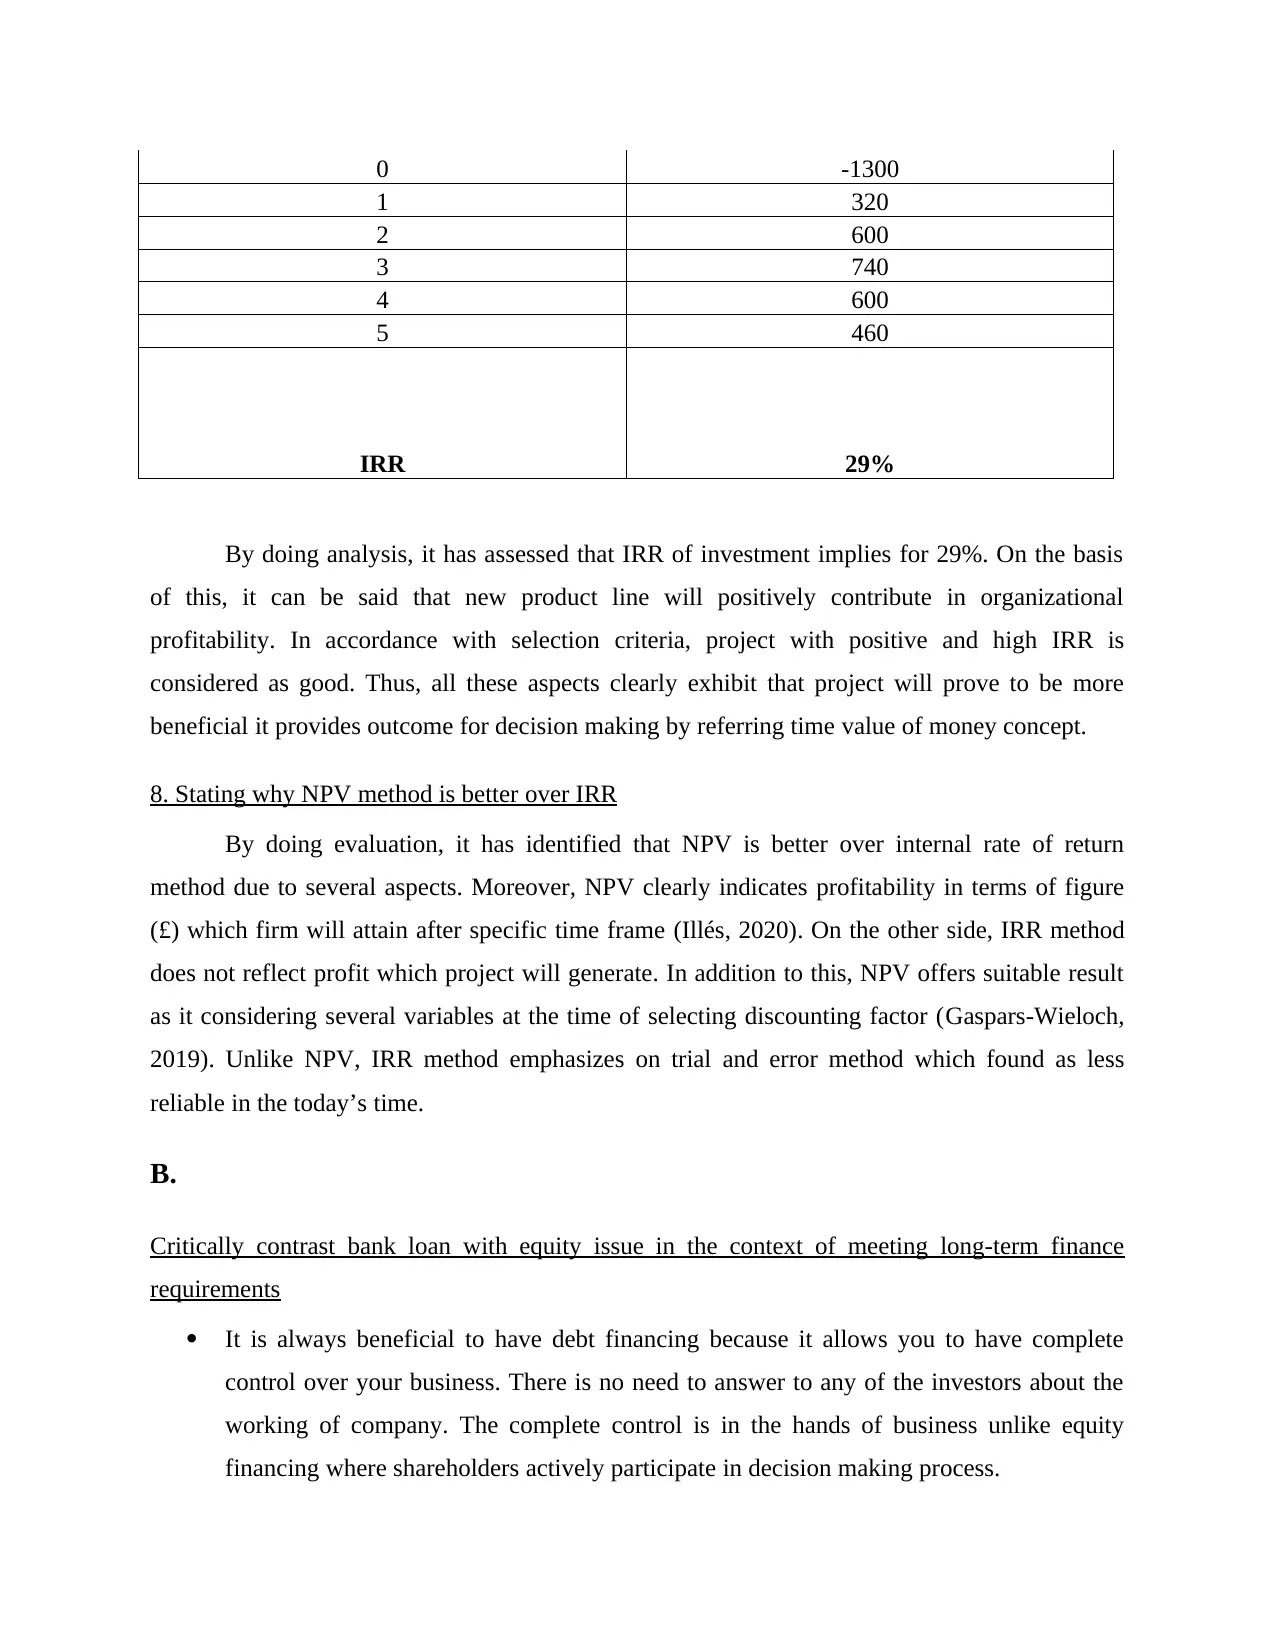
0 -1300
1 320
2 600
3 740
4 600
5 460
IRR 29%
By doing analysis, it has assessed that IRR of investment implies for 29%. On the basis
of this, it can be said that new product line will positively contribute in organizational
profitability. In accordance with selection criteria, project with positive and high IRR is
considered as good. Thus, all these aspects clearly exhibit that project will prove to be more
beneficial it provides outcome for decision making by referring time value of money concept.
8. Stating why NPV method is better over IRR
By doing evaluation, it has identified that NPV is better over internal rate of return
method due to several aspects. Moreover, NPV clearly indicates profitability in terms of figure
(£) which firm will attain after specific time frame (Illés, 2020). On the other side, IRR method
does not reflect profit which project will generate. In addition to this, NPV offers suitable result
as it considering several variables at the time of selecting discounting factor (Gaspars-Wieloch,
2019). Unlike NPV, IRR method emphasizes on trial and error method which found as less
reliable in the today’s time.
B.
Critically contrast bank loan with equity issue in the context of meeting long-term finance
requirements
It is always beneficial to have debt financing because it allows you to have complete
control over your business. There is no need to answer to any of the investors about the
working of company. The complete control is in the hands of business unlike equity
financing where shareholders actively participate in decision making process.
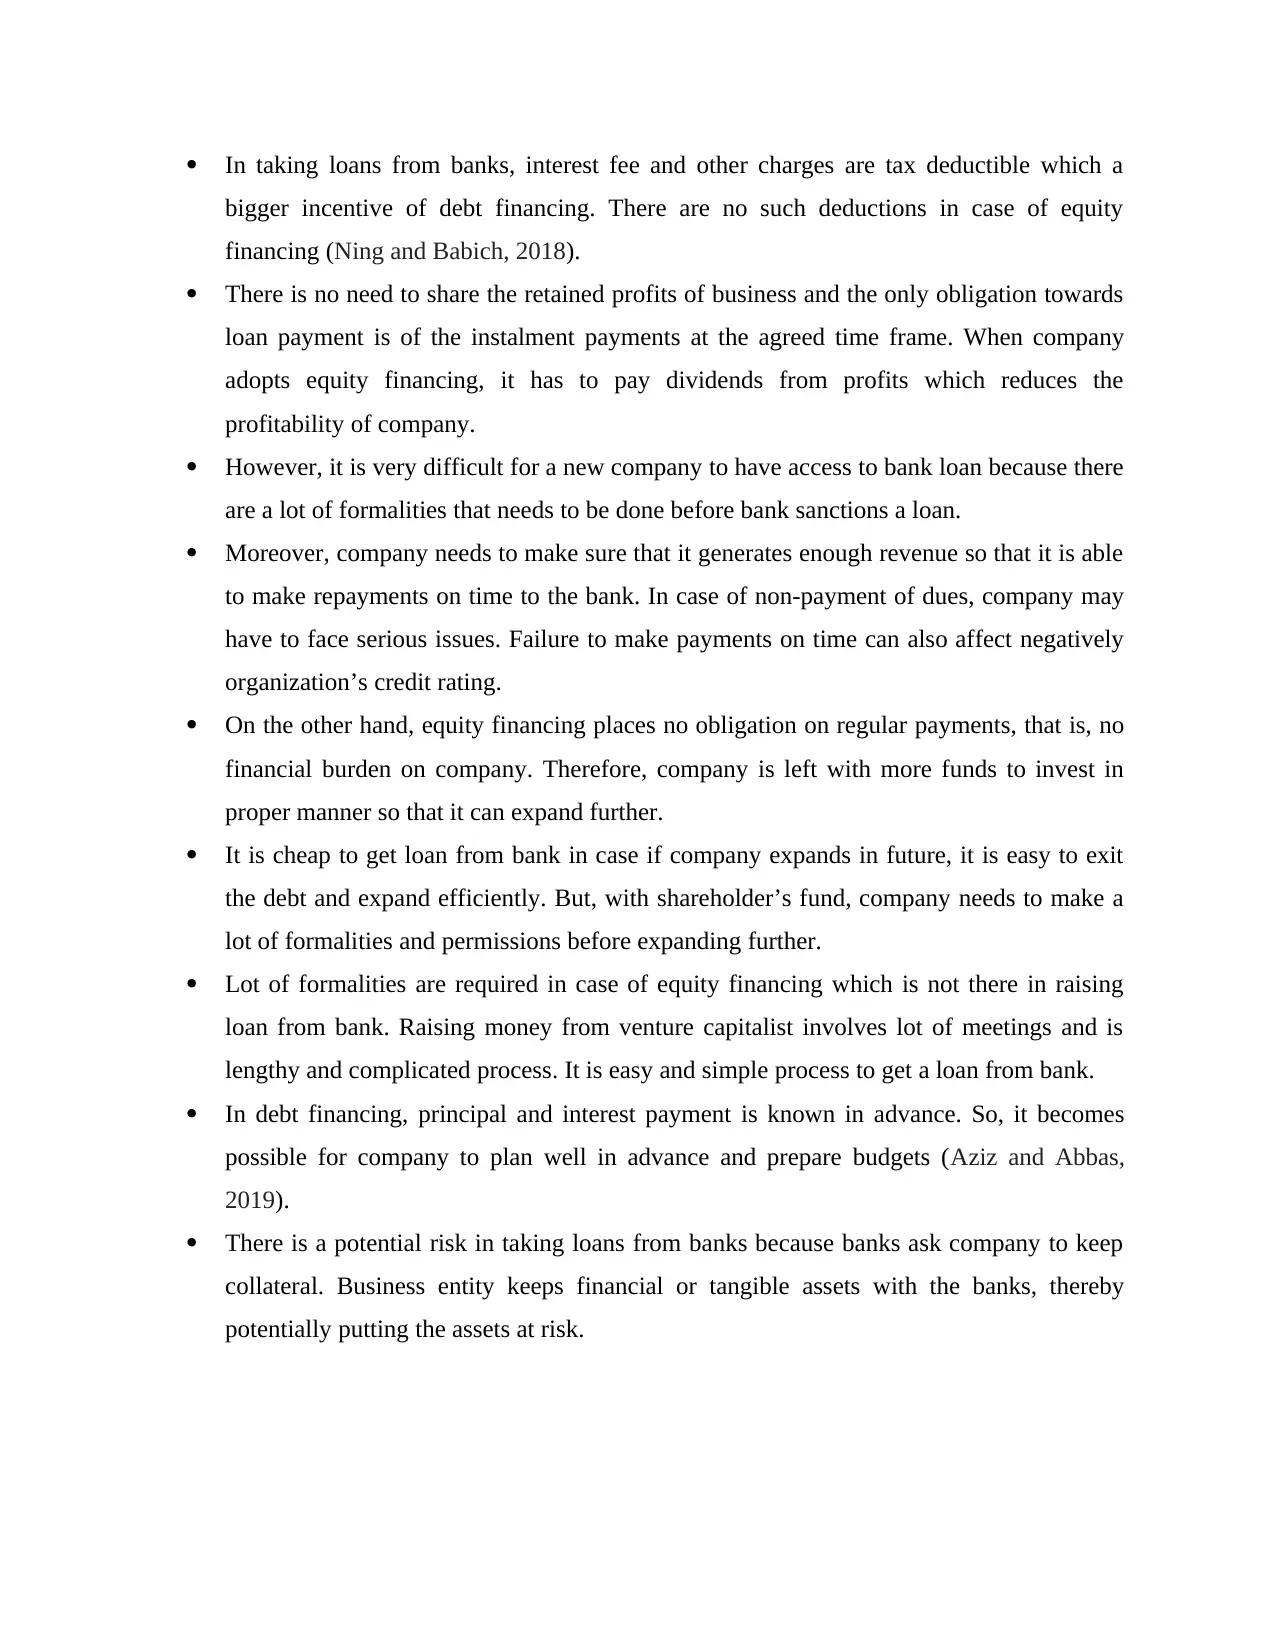
In taking loans from banks, interest fee and other charges are tax deductible which a
bigger incentive of debt financing. There are no such deductions in case of equity
financing (Ning and Babich, 2018).
There is no need to share the retained profits of business and the only obligation towards
loan payment is of the instalment payments at the agreed time frame. When company
adopts equity financing, it has to pay dividends from profits which reduces the
profitability of company.
However, it is very difficult for a new company to have access to bank loan because there
are a lot of formalities that needs to be done before bank sanctions a loan.
Moreover, company needs to make sure that it generates enough revenue so that it is able
to make repayments on time to the bank. In case of non-payment of dues, company may
have to face serious issues. Failure to make payments on time can also affect negatively
organization’s credit rating.
On the other hand, equity financing places no obligation on regular payments, that is, no
financial burden on company. Therefore, company is left with more funds to invest in
proper manner so that it can expand further.
It is cheap to get loan from bank in case if company expands in future, it is easy to exit
the debt and expand efficiently. But, with shareholder’s fund, company needs to make a
lot of formalities and permissions before expanding further.
Lot of formalities are required in case of equity financing which is not there in raising
loan from bank. Raising money from venture capitalist involves lot of meetings and is
lengthy and complicated process. It is easy and simple process to get a loan from bank.
In debt financing, principal and interest payment is known in advance. So, it becomes
possible for company to plan well in advance and prepare budgets (Aziz and Abbas,
2019).
There is a potential risk in taking loans from banks because banks ask company to keep
collateral. Business entity keeps financial or tangible assets with the banks, thereby
potentially putting the assets at risk.
⊘ This is a preview!⊘
Do you want full access?
Subscribe today to unlock all pages.
Trusted by 1+ million students worldwide
C
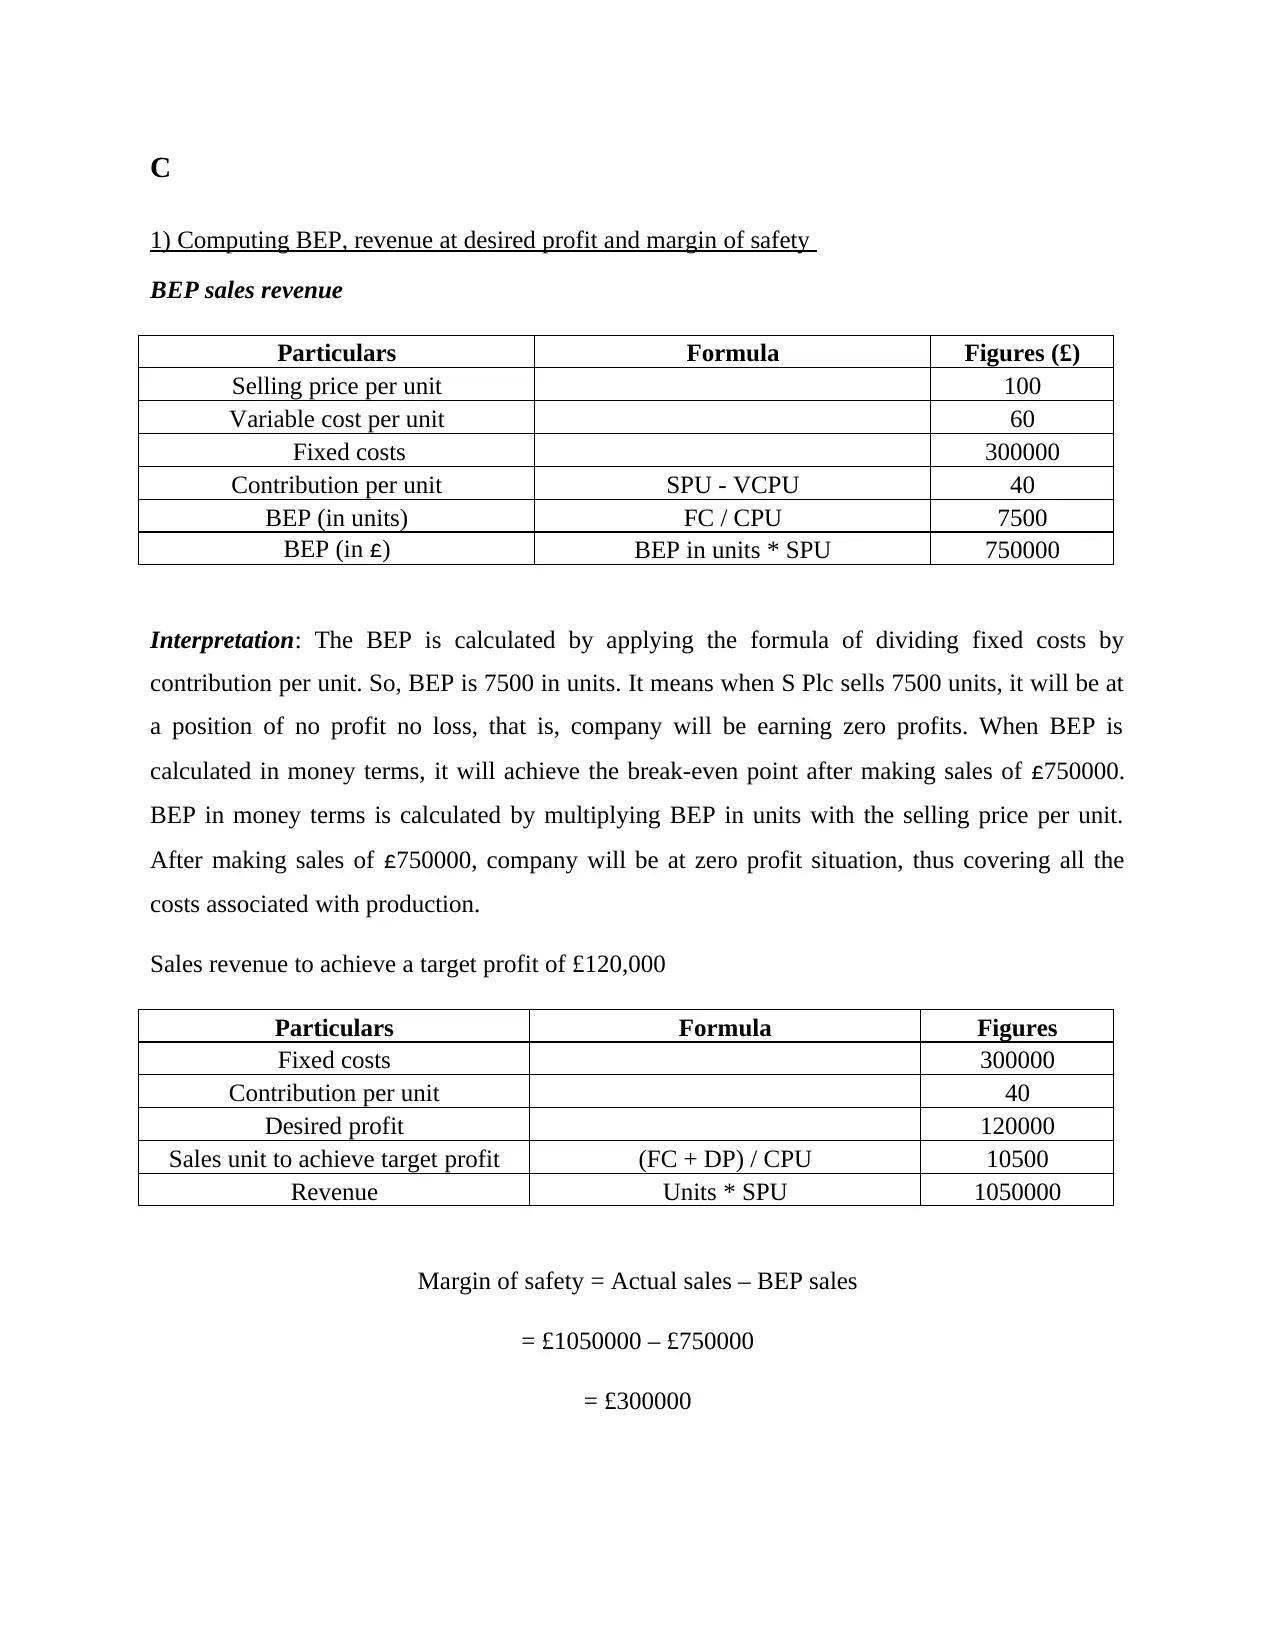
1) Computing BEP, revenue at desired profit and margin of safety
BEP sales revenue
Particulars Formula Figures (£)
Selling price per unit 100
Variable cost per unit 60
Fixed costs 300000
Contribution per unit SPU - VCPU 40
BEP (in units) FC / CPU 7500
BEP (in £) BEP in units * SPU 750000
Interpretation: The BEP is calculated by applying the formula of dividing fixed costs by
contribution per unit. So, BEP is 7500 in units. It means when S Plc sells 7500 units, it will be at
a position of no profit no loss, that is, company will be earning zero profits. When BEP is
calculated in money terms, it will achieve the break-even point after making sales of £750000.
BEP in money terms is calculated by multiplying BEP in units with the selling price per unit.
After making sales of £750000, company will be at zero profit situation, thus covering all the
costs associated with production.
Sales revenue to achieve a target profit of £120,000
Particulars Formula Figures
Fixed costs 300000
Contribution per unit 40
Desired profit 120000
Sales unit to achieve target profit (FC + DP) / CPU 10500
Revenue Units * SPU 1050000
Margin of safety = Actual sales – BEP sales
= £1050000 – £750000
= £300000
Paraphrase This Document
Need a fresh take? Get an instant paraphrase of this document with our AI Paraphraser
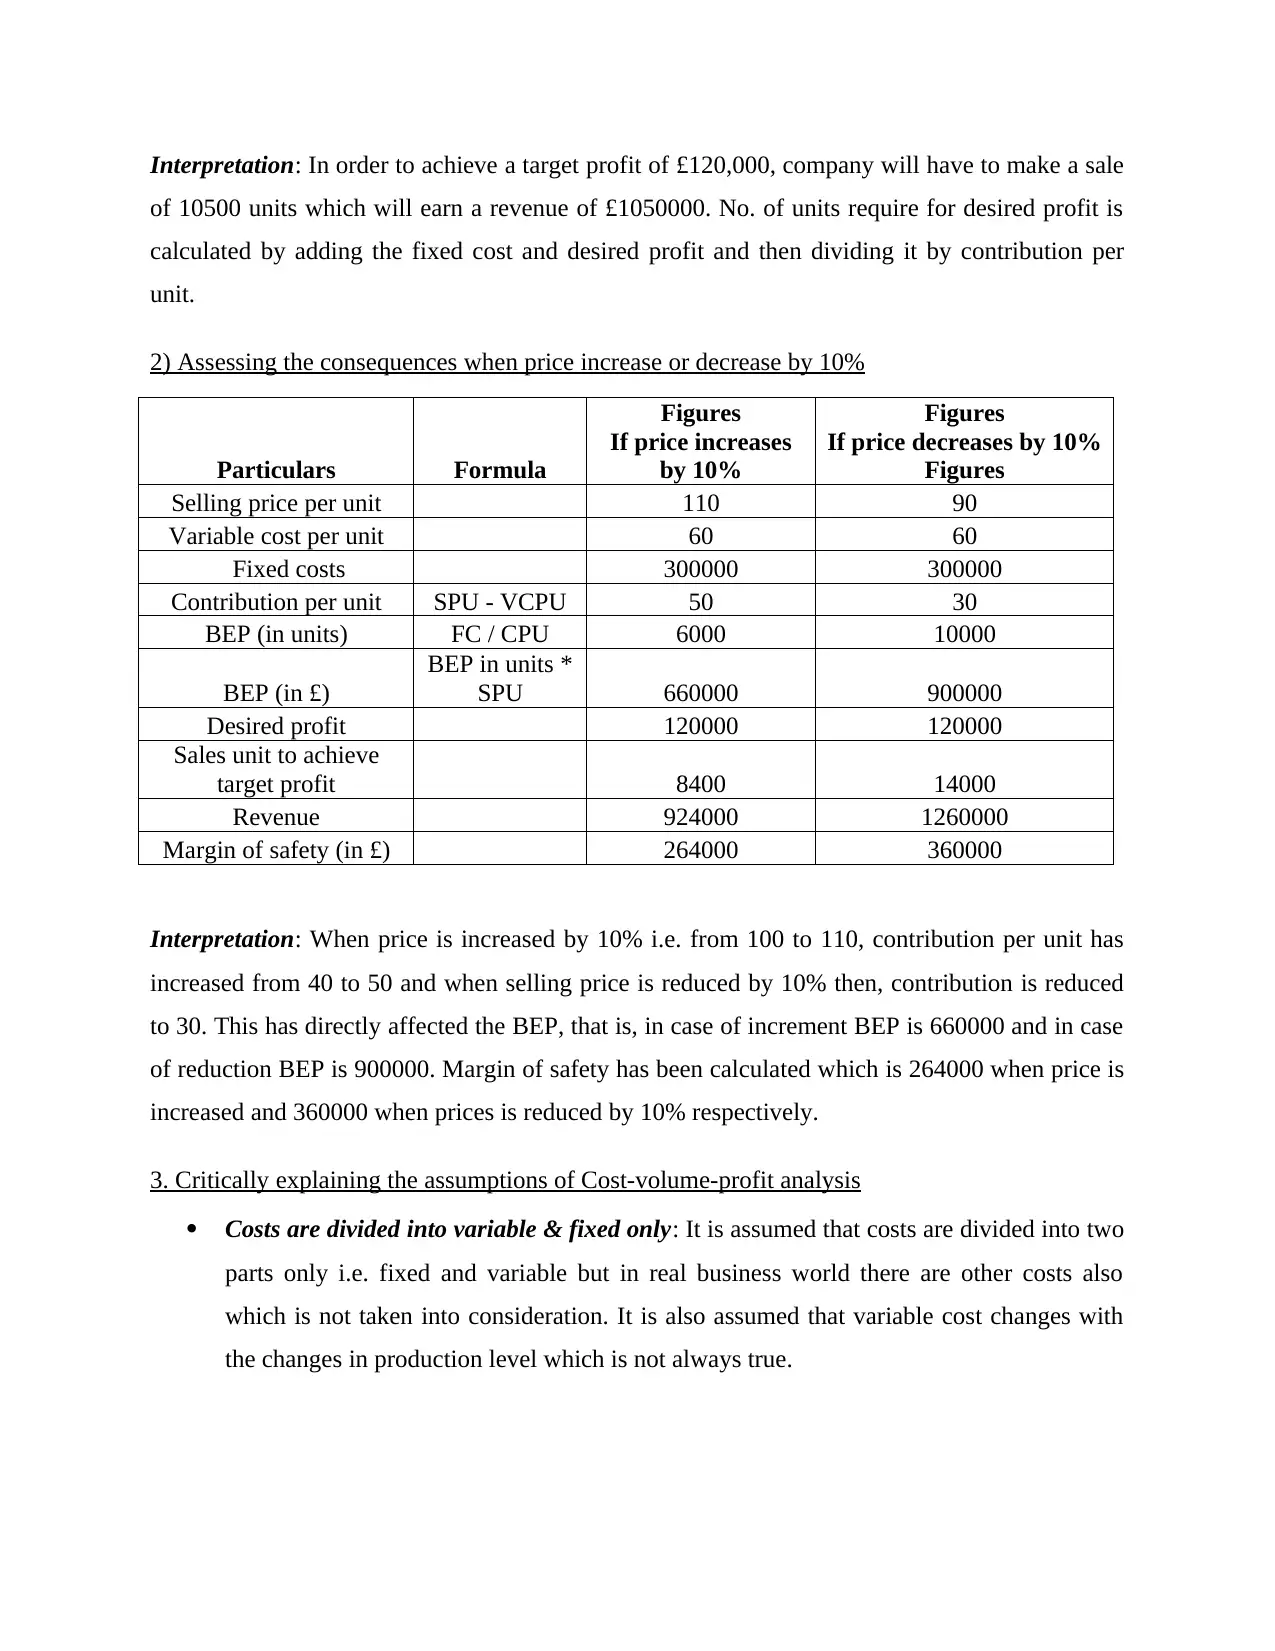
Interpretation: In order to achieve a target profit of £120,000, company will have to make a sale
of 10500 units which will earn a revenue of £1050000. No. of units require for desired profit is
calculated by adding the fixed cost and desired profit and then dividing it by contribution per
unit.
2) Assessing the consequences when price increase or decrease by 10%
Particulars Formula
Figures
If price increases
by 10%
Figures
If price decreases by 10%
Figures
Selling price per unit 110 90
Variable cost per unit 60 60
Fixed costs 300000 300000
Contribution per unit SPU - VCPU 50 30
BEP (in units) FC / CPU 6000 10000
BEP (in £)
BEP in units *
SPU 660000 900000
Desired profit 120000 120000
Sales unit to achieve
target profit 8400 14000
Revenue 924000 1260000
Margin of safety (in £) 264000 360000
Interpretation: When price is increased by 10% i.e. from 100 to 110, contribution per unit has
increased from 40 to 50 and when selling price is reduced by 10% then, contribution is reduced
to 30. This has directly affected the BEP, that is, in case of increment BEP is 660000 and in case
of reduction BEP is 900000. Margin of safety has been calculated which is 264000 when price is
increased and 360000 when prices is reduced by 10% respectively.
3. Critically explaining the assumptions of Cost-volume-profit analysis
Costs are divided into variable & fixed only: It is assumed that costs are divided into two
parts only i.e. fixed and variable but in real business world there are other costs also
which is not taken into consideration. It is also assumed that variable cost changes with
the changes in production level which is not always true.
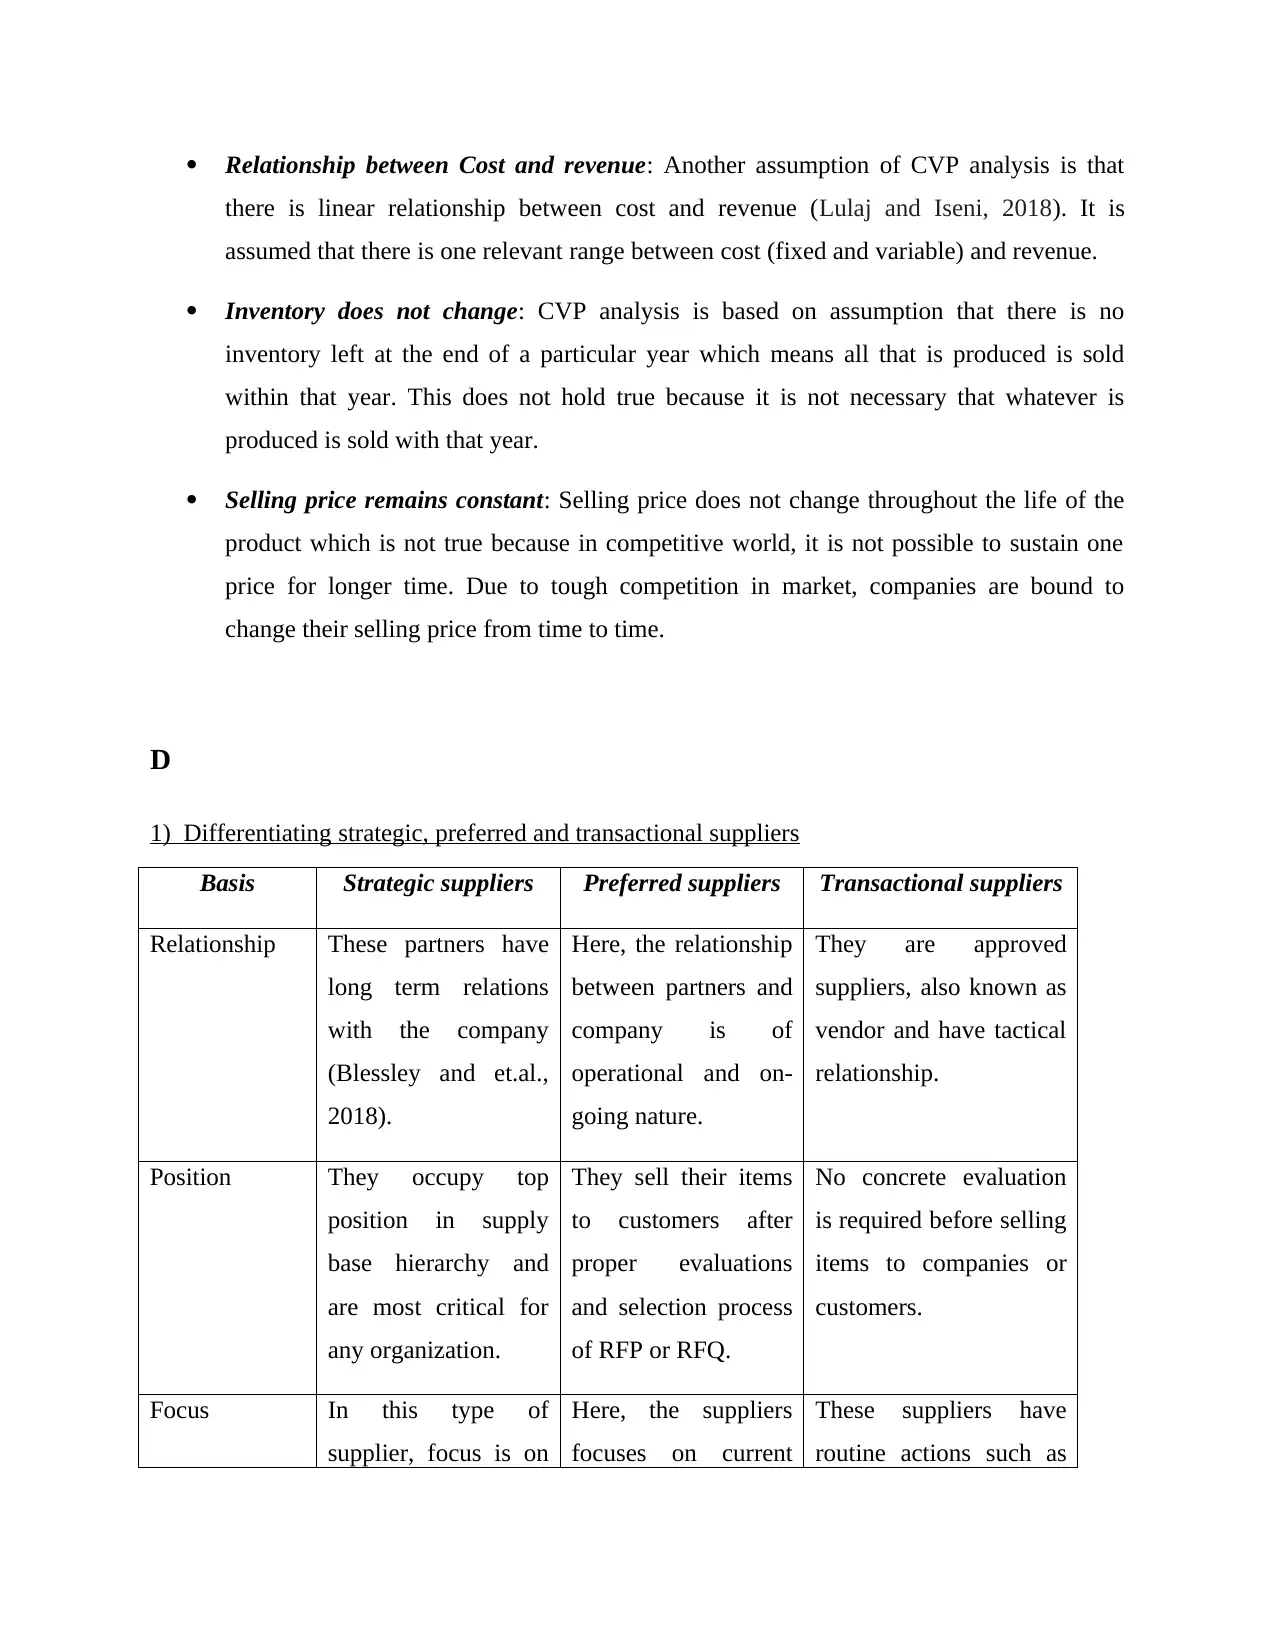
Relationship between Cost and revenue: Another assumption of CVP analysis is that
there is linear relationship between cost and revenue (Lulaj and Iseni, 2018). It is
assumed that there is one relevant range between cost (fixed and variable) and revenue.
Inventory does not change: CVP analysis is based on assumption that there is no
inventory left at the end of a particular year which means all that is produced is sold
within that year. This does not hold true because it is not necessary that whatever is
produced is sold with that year.
Selling price remains constant: Selling price does not change throughout the life of the
product which is not true because in competitive world, it is not possible to sustain one
price for longer time. Due to tough competition in market, companies are bound to
change their selling price from time to time.
D
1) Differentiating strategic, preferred and transactional suppliers
Basis Strategic suppliers Preferred suppliers Transactional suppliers
Relationship These partners have
long term relations
with the company
(Blessley and et.al.,
2018).
Here, the relationship
between partners and
company is of
operational and on-
going nature.
They are approved
suppliers, also known as
vendor and have tactical
relationship.
Position They occupy top
position in supply
base hierarchy and
are most critical for
any organization.
They sell their items
to customers after
proper evaluations
and selection process
of RFP or RFQ.
No concrete evaluation
is required before selling
items to companies or
customers.
Focus In this type of
supplier, focus is on
Here, the suppliers
focuses on current
These suppliers have
routine actions such as
⊘ This is a preview!⊘
Do you want full access?
Subscribe today to unlock all pages.
Trusted by 1+ million students worldwide
1 out of 17
Related Documents


Your All-in-One AI-Powered Toolkit for Academic Success.
+13062052269
info@desklib.com
Available 24*7 on WhatsApp / Email
![[object Object]](/_next/static/media/star-bottom.7253800d.svg)
Unlock your academic potential
Copyright © 2020–2026 A2Z Services. All Rights Reserved. Developed and managed by ZUCOL.