Financial Analysis and Management: Investment Appraisal Techniques
VerifiedAdded on 2023/06/11
|19
|4613
|428
Report
AI Summary
This report provides a detailed analysis of various investment appraisal techniques, crucial for making informed long-term investment decisions. It begins by emphasizing the importance of the investment appraisal process, highlighting its strategic implications and the need to evaluate projects based on strategic fit, operational capability, and financial feasibility. The report then critically evaluates five key techniques: Net Present Value (NPV), Profitability Index (PI), Internal Rate of Return (IRR), Accounting Rate of Return (ARR), and Payback Period, explaining their methodologies, advantages, and limitations with illustrative examples. Additionally, the analysis incorporates the concept of discounting rates and the Weighted Average Cost of Capital (WACC) method to assess the economic viability of investment proposals. The report concludes by underscoring the significance of these techniques in maximizing shareholder value and ensuring effective capital allocation.

FINANCIAL ANALYSIS and
management
08/06/2018
management
08/06/2018
Paraphrase This Document
Need a fresh take? Get an instant paraphrase of this document with our AI Paraphraser
1
Table of Contents
Introduction and importance of the investment appraisal process..................................................2
Evaluation of techniques of investment appraisal process...............................................................4
Net Present Value (NPV):.................................................................................................................4
Profitability Index (PI):.....................................................................................................................5
Internal Rate of Return (IRR):...........................................................................................................7
Accounting Rate of Return (ARR)....................................................................................................8
Pay Back Period:...............................................................................................................................9
Discounting Rates..............................................................................................................................11
Analysis of Weighted Average Cost of Capital (WACC) method.......................................................11
Conclusion..........................................................................................................................................14
References..........................................................................................................................................15
2
Introduction and importance of the investment appraisal process
Investment decisions are the decisions to invest in the capital assets of the company such as
land, building, plant, machinery, equipment, shares or other long term assets. These decisions
have long term strategic implications which means the revenues generated from such
decisions must be able to cover the costs of past (Biermanand Smidt, 2012). Long term
investment decisions are of acute significance for two main reasons. Firstly, these decisions
involve a huge amount of money and resources (Banerjee, 2017). And secondly, these
decisions are irreversible decisions and once the projects have begun, it’s nearly impossible
to cease them. The investment appraisal decisions are also important as these enable to en
cash the various economic opportunities of the following types, such as
1. Expansion decisions of the existing production processes in order to fulfil the existing
demands and for tapping new markets while availing the benefits of economies of
scale.
2. Replacement decisions of an existing plant, machinery, building, or vehicle so as to
avoid the frequent repair charges and to reap the advantages of technological
advancements. These in turn result in efficiency of the labour force and eventually
reduces the cost of the products.
3. Buy decisions, hire on rent or lease decisions in relation to a particular asset is another
important consideration which establishes the need for making investment decisions.
The step wise step procedure for making an investment decision is as follows (Tulvinschi,
2014).
Recognition and constitution of the long term goal of the organisation.
Research and identification of the new investment opportunities.
⊘ This is a preview!⊘
Do you want full access?
Subscribe today to unlock all pages.
Trusted by 1+ million students worldwide

3
Classification of projects according to their economic viability and finance budget of
the entity.
Estimation and computation of the cash inflows and outflows arising out of the
proposal.
Selection of the project after consideration of other factors such as legal,
environmental, political factors.
Post implementation monitoring of the project and the control over expenditures.
Paraphrase This Document
Need a fresh take? Get an instant paraphrase of this document with our AI Paraphraser

4
Evaluation of techniques of investment appraisal process
The five chief techniques of evaluating feasibility of investment proposals are Net Present
Value (NPV), Profitability Index, Internal Rate of Return, Accounting Rate of Return and
Payback Period. Each of the techniques is described in the following segment.
Net Present Value (NPV):
This method uses one of the most important concepts of time value of money and discounted
cash flows arising out of operations of the projects. This technique involves using an
appropriate discount rate to discount the future financial cash inflows and outflows, and then
comparing them with the initially invested amount of capital. For determining the net present
value we use the following formula (Baker and English, 2011).
NPV=∑
i=1
n CFi
(1+ d)i
= CF0 + CF 1
(1+k )1 + CF 2
(1+k )2 + …. + CF 3
(1+k )3
where:
CFi = net cash flow from year i,
CF0 = initial investment,
k = discount rate, and
n = number of years.
In case of a single project, positive NPV leads to selection of the project and negative NPV
leads to rejection of the project (Gray, Larson and Desai, 2011). In case of two or more
5
mutually projects out of which one has to be selected, the project with the highest NPV
would be preferred (Brigham and Houston, 2012). The technique can be described using the
following example.
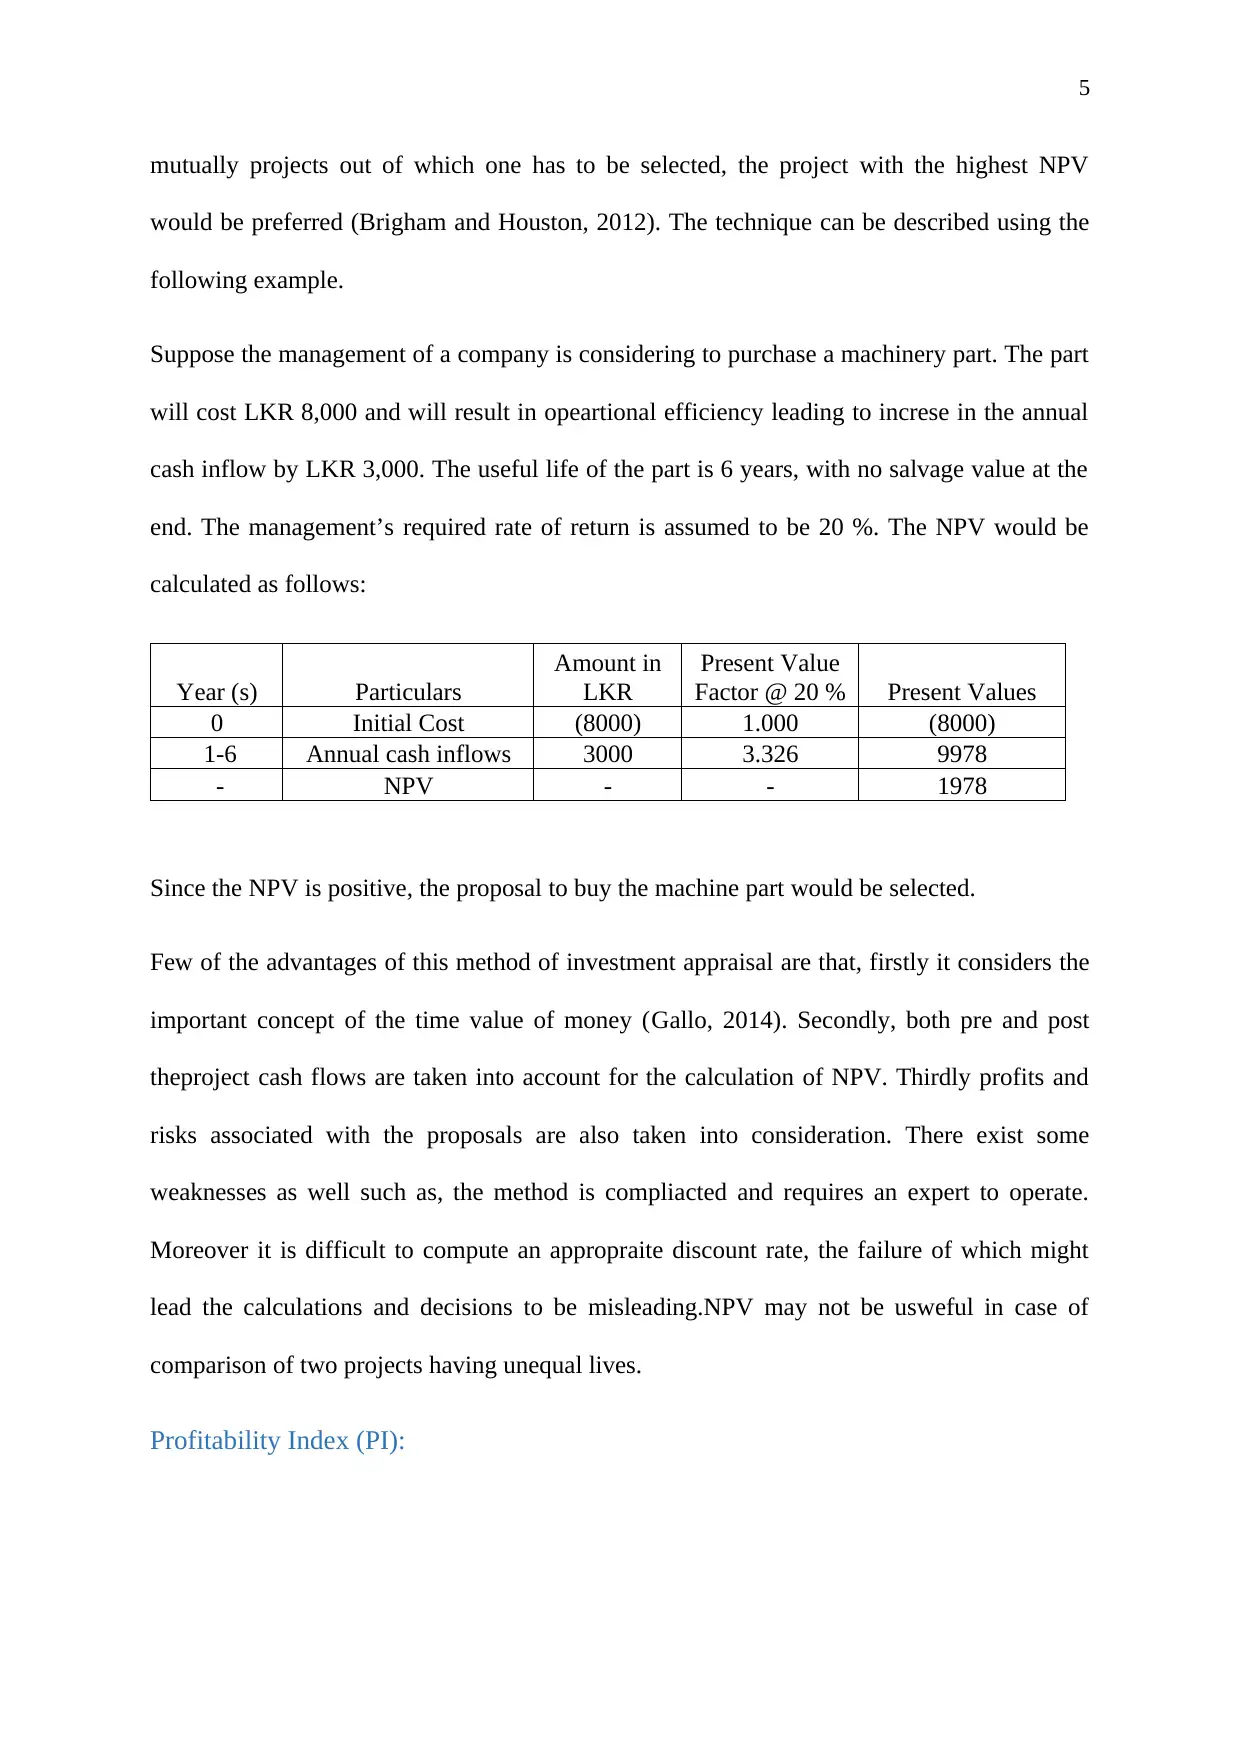
Suppose the management of a company is considering to purchase a machinery part. The part
will cost LKR 8,000 and will result in opeartional efficiency leading to increse in the annual
cash inflow by LKR 3,000. The useful life of the part is 6 years, with no salvage value at the
end. The management’s required rate of return is assumed to be 20 %. The NPV would be
calculated as follows:
Year (s) Particulars
Amount in
LKR
Present Value
Factor @ 20 % Present Values
0 Initial Cost (8000) 1.000 (8000)
1-6 Annual cash inflows 3000 3.326 9978
- NPV - - 1978
Since the NPV is positive, the proposal to buy the machine part would be selected.
Few of the advantages of this method of investment appraisal are that, firstly it considers the
important concept of the time value of money (Gallo, 2014). Secondly, both pre and post
theproject cash flows are taken into account for the calculation of NPV. Thirdly profits and
risks associated with the proposals are also taken into consideration. There exist some
weaknesses as well such as, the method is compliacted and requires an expert to operate.
Moreover it is difficult to compute an appropraite discount rate, the failure of which might
lead the calculations and decisions to be misleading.NPV may not be usweful in case of
comparison of two projects having unequal lives.
Profitability Index (PI):
mutually projects out of which one has to be selected, the project with the highest NPV
would be preferred (Brigham and Houston, 2012). The technique can be described using the
following example.
Suppose the management of a company is considering to purchase a machinery part. The part
will cost LKR 8,000 and will result in opeartional efficiency leading to increse in the annual
cash inflow by LKR 3,000. The useful life of the part is 6 years, with no salvage value at the
end. The management’s required rate of return is assumed to be 20 %. The NPV would be
calculated as follows:
Year (s) Particulars
Amount in
LKR
Present Value
Factor @ 20 % Present Values
0 Initial Cost (8000) 1.000 (8000)
1-6 Annual cash inflows 3000 3.326 9978
- NPV - - 1978
Since the NPV is positive, the proposal to buy the machine part would be selected.
Few of the advantages of this method of investment appraisal are that, firstly it considers the
important concept of the time value of money (Gallo, 2014). Secondly, both pre and post
theproject cash flows are taken into account for the calculation of NPV. Thirdly profits and
risks associated with the proposals are also taken into consideration. There exist some
weaknesses as well such as, the method is compliacted and requires an expert to operate.
Moreover it is difficult to compute an appropraite discount rate, the failure of which might
lead the calculations and decisions to be misleading.NPV may not be usweful in case of
comparison of two projects having unequal lives.
Profitability Index (PI):
⊘ This is a preview!⊘
Do you want full access?
Subscribe today to unlock all pages.
Trusted by 1+ million students worldwide
6
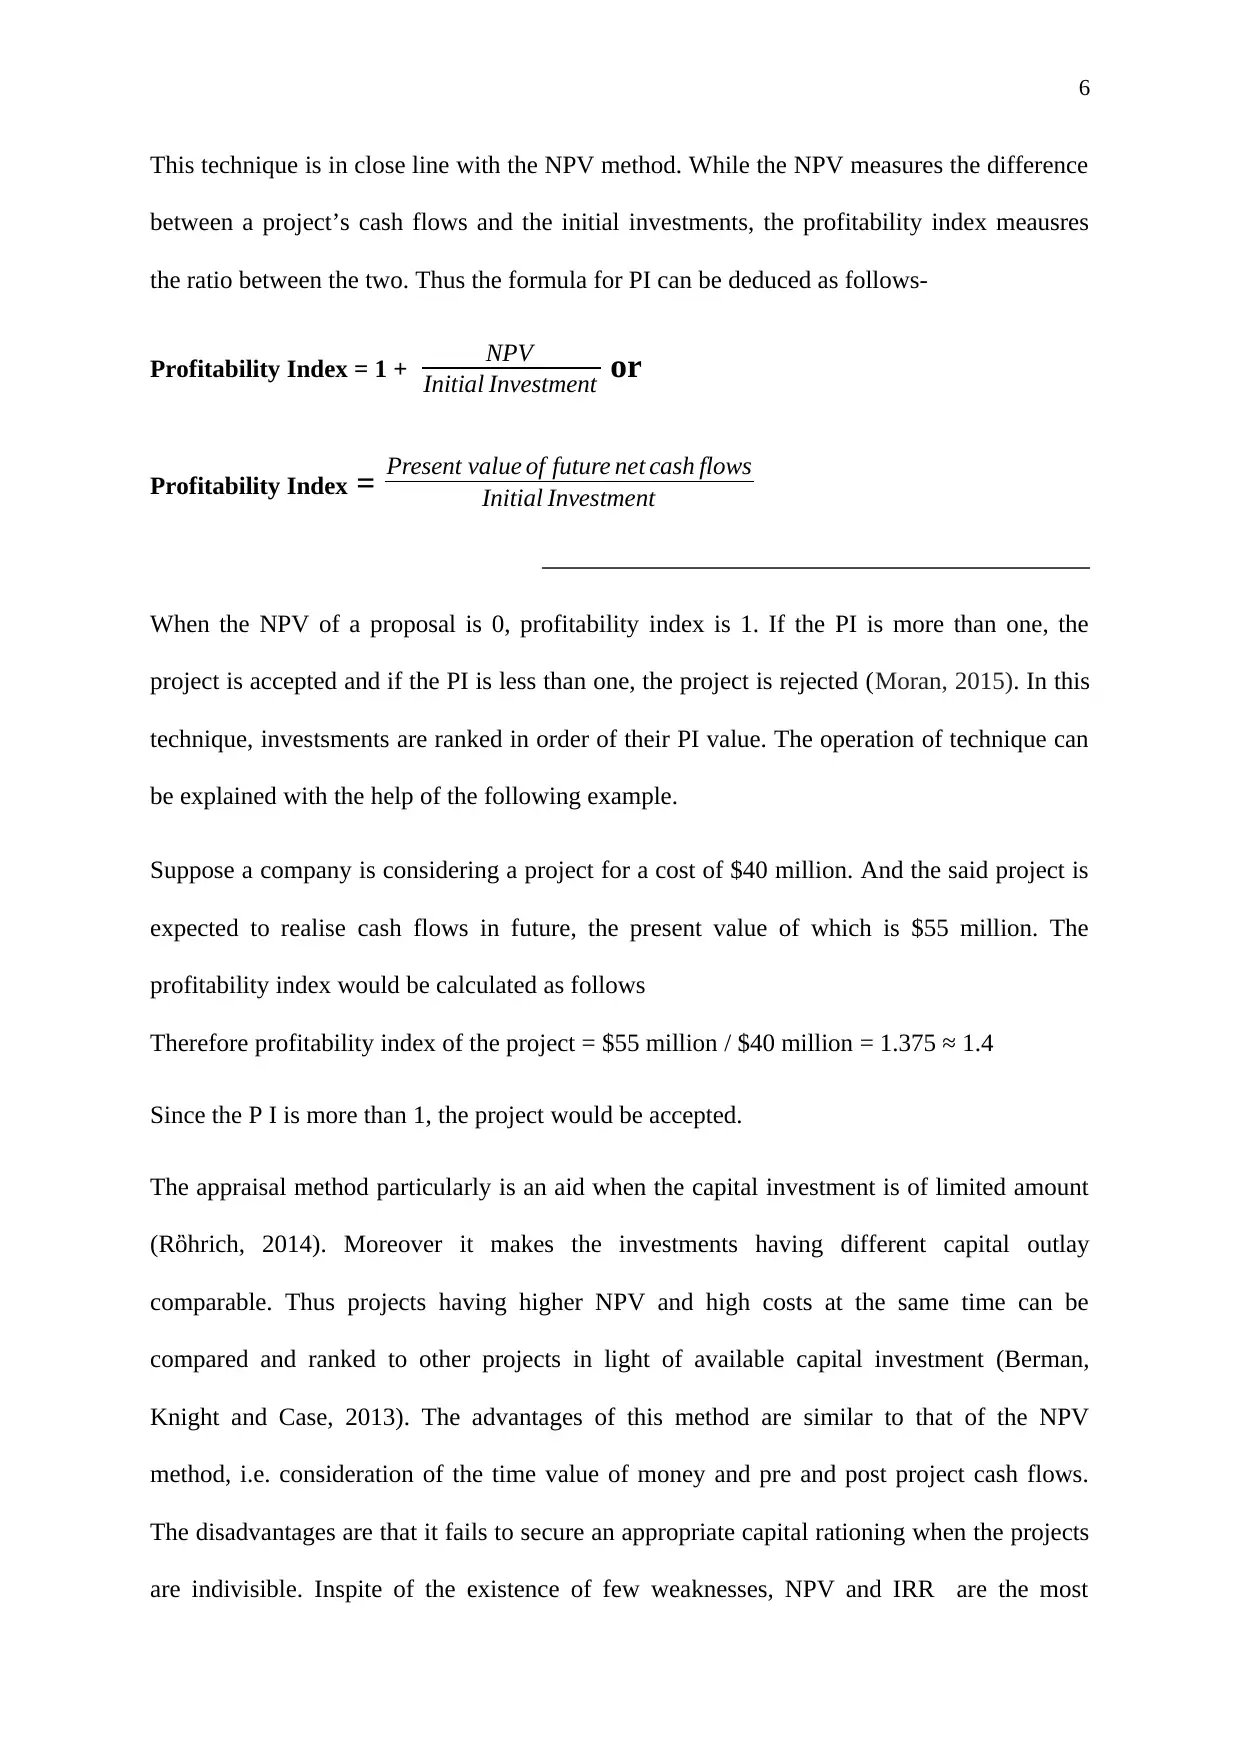
This technique is in close line with the NPV method. While the NPV measures the difference
between a project’s cash flows and the initial investments, the profitability index meausres
the ratio between the two. Thus the formula for PI can be deduced as follows-
Profitability Index = 1 + NPV
Initial Investment or
Profitability Index = Present value of future net cash flows
Initial Investment
When the NPV of a proposal is 0, profitability index is 1. If the PI is more than one, the
project is accepted and if the PI is less than one, the project is rejected (Moran, 2015). In this
technique, investsments are ranked in order of their PI value. The operation of technique can
be explained with the help of the following example.
Suppose a company is considering a project for a cost of $40 million. And the said project is
expected to realise cash flows in future, the present value of which is $55 million. The
profitability index would be calculated as follows
Therefore profitability index of the project = $55 million / $40 million = 1.375 ≈ 1.4
Since the P I is more than 1, the project would be accepted.
The appraisal method particularly is an aid when the capital investment is of limited amount
(Rὂhrich, 2014). Moreover it makes the investments having different capital outlay
comparable. Thus projects having higher NPV and high costs at the same time can be
compared and ranked to other projects in light of available capital investment (Berman,
Knight and Case, 2013). The advantages of this method are similar to that of the NPV
method, i.e. consideration of the time value of money and pre and post project cash flows.
The disadvantages are that it fails to secure an appropriate capital rationing when the projects
are indivisible. Inspite of the existence of few weaknesses, NPV and IRR are the most
Paraphrase This Document
Need a fresh take? Get an instant paraphrase of this document with our AI Paraphraser
7
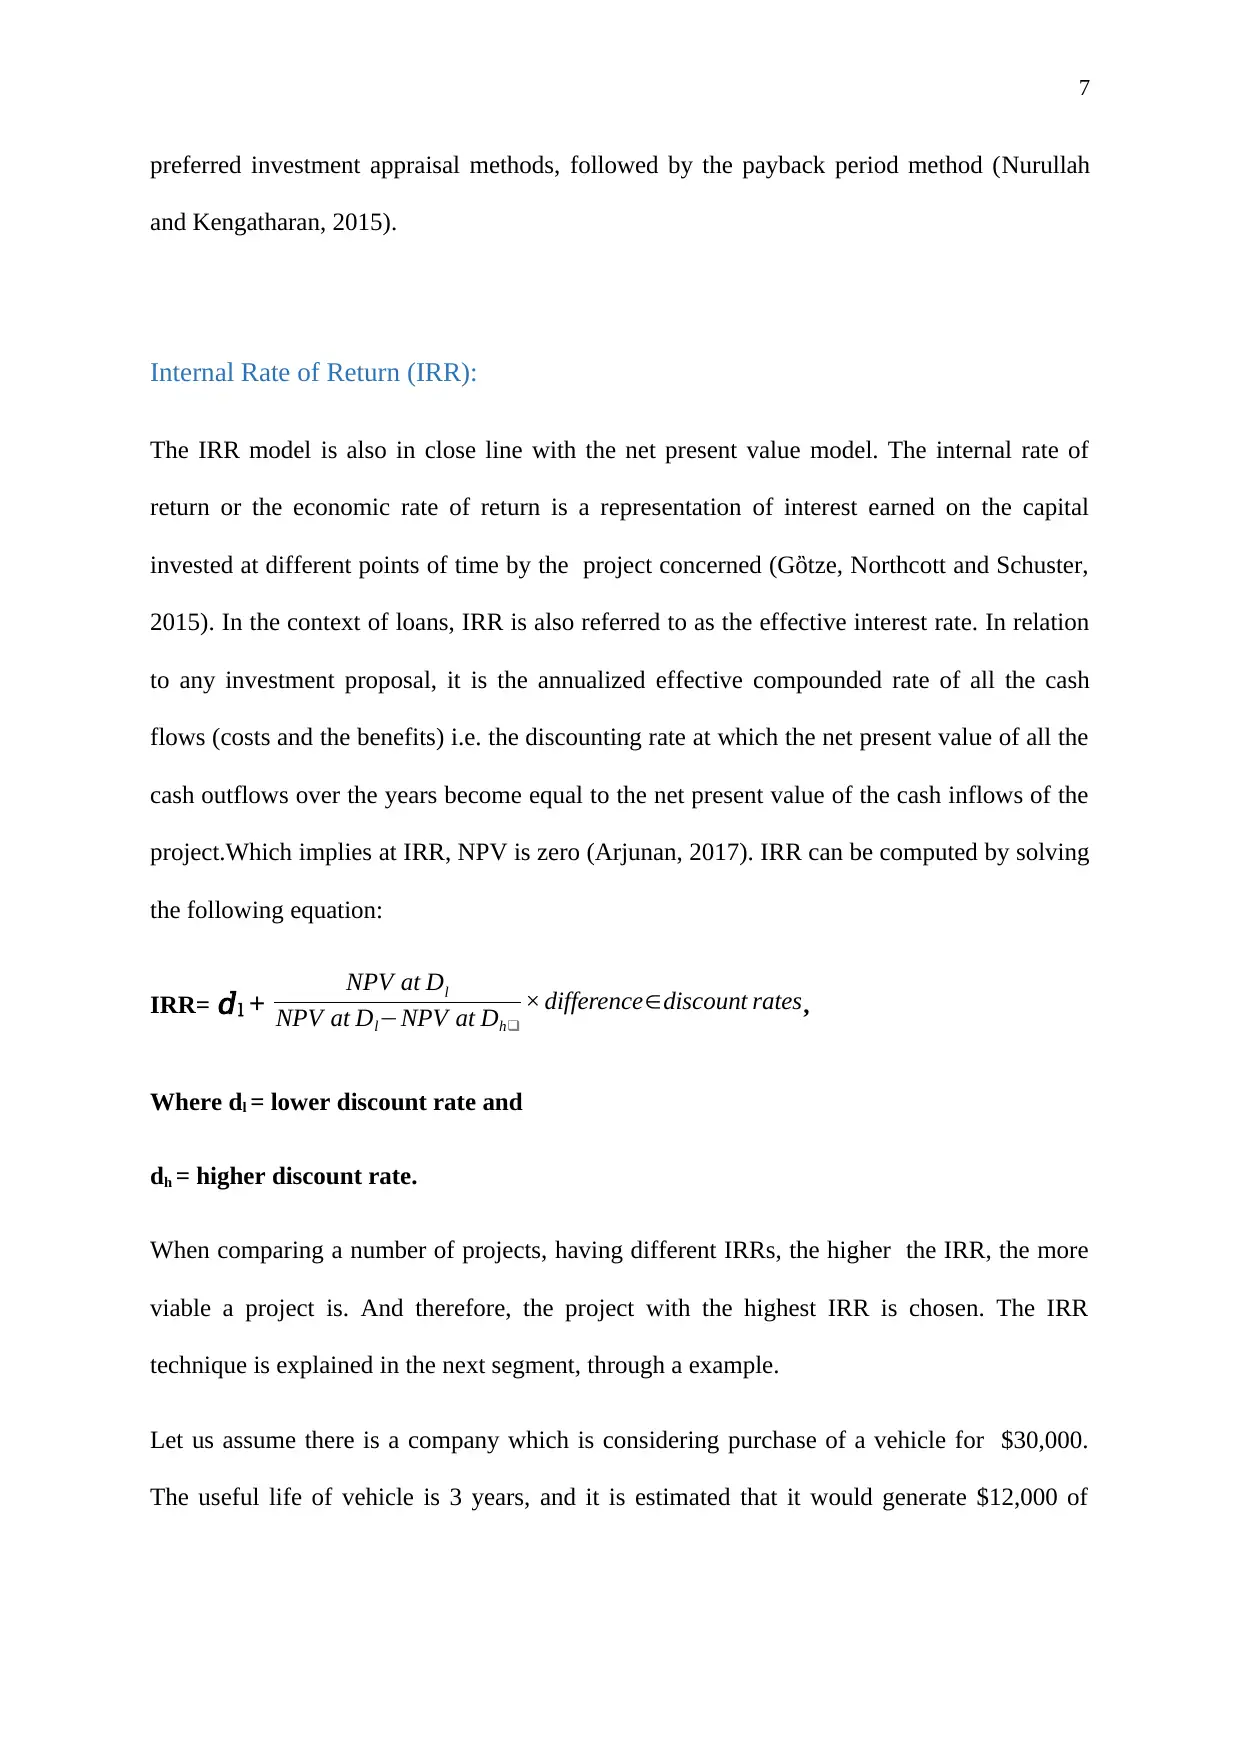
preferred investment appraisal methods, followed by the payback period method (Nurullah
and Kengatharan, 2015).
Internal Rate of Return (IRR):
The IRR model is also in close line with the net present value model. The internal rate of
return or the economic rate of return is a representation of interest earned on the capital
invested at different points of time by the project concerned (Gὂtze, Northcott and Schuster,
2015). In the context of loans, IRR is also referred to as the effective interest rate. In relation
to any investment proposal, it is the annualized effective compounded rate of all the cash
flows (costs and the benefits) i.e. the discounting rate at which the net present value of all the
cash outflows over the years become equal to the net present value of the cash inflows of the
project.Which implies at IRR, NPV is zero (Arjunan, 2017). IRR can be computed by solving
the following equation:
IRR= 𝑑l + NPV at Dl
NPV at Dl−NPV at Dh❑
× difference∈discount rates,
Where dl = lower discount rate and
dh = higher discount rate.
When comparing a number of projects, having different IRRs, the higher the IRR, the more
viable a project is. And therefore, the project with the highest IRR is chosen. The IRR
technique is explained in the next segment, through a example.
Let us assume there is a company which is considering purchase of a vehicle for $30,000.
The useful life of vehicle is 3 years, and it is estimated that it would generate $12,000 of
8
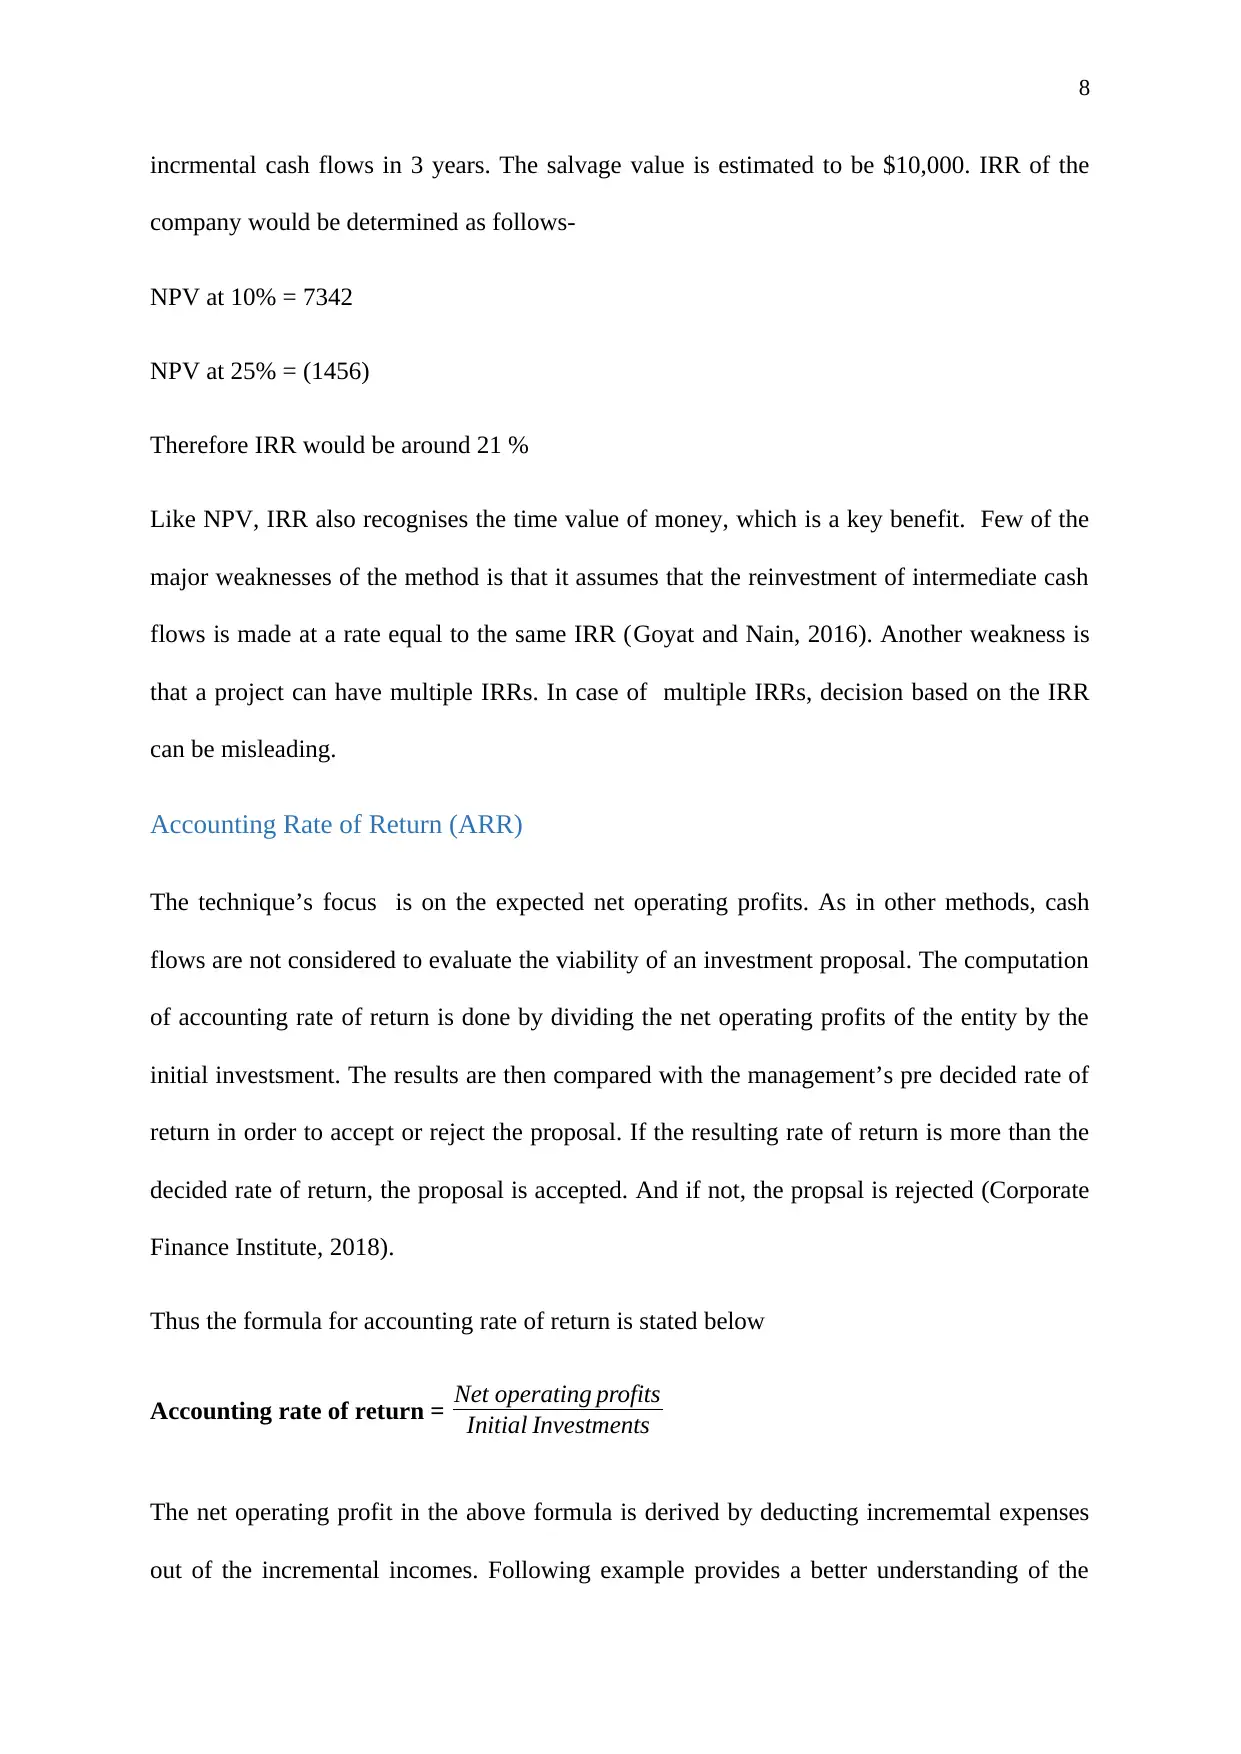
incrmental cash flows in 3 years. The salvage value is estimated to be $10,000. IRR of the
company would be determined as follows-
NPV at 10% = 7342
NPV at 25% = (1456)
Therefore IRR would be around 21 %
Like NPV, IRR also recognises the time value of money, which is a key benefit. Few of the
major weaknesses of the method is that it assumes that the reinvestment of intermediate cash
flows is made at a rate equal to the same IRR (Goyat and Nain, 2016). Another weakness is
that a project can have multiple IRRs. In case of multiple IRRs, decision based on the IRR
can be misleading.
Accounting Rate of Return (ARR)
The technique’s focus is on the expected net operating profits. As in other methods, cash
flows are not considered to evaluate the viability of an investment proposal. The computation
of accounting rate of return is done by dividing the net operating profits of the entity by the
initial investsment. The results are then compared with the management’s pre decided rate of
return in order to accept or reject the proposal. If the resulting rate of return is more than the
decided rate of return, the proposal is accepted. And if not, the propsal is rejected (Corporate
Finance Institute, 2018).
Thus the formula for accounting rate of return is stated below
Accounting rate of return = Net operating profits
Initial Investments
The net operating profit in the above formula is derived by deducting incrememtal expenses
out of the incremental incomes. Following example provides a better understanding of the
⊘ This is a preview!⊘
Do you want full access?
Subscribe today to unlock all pages.
Trusted by 1+ million students worldwide
9
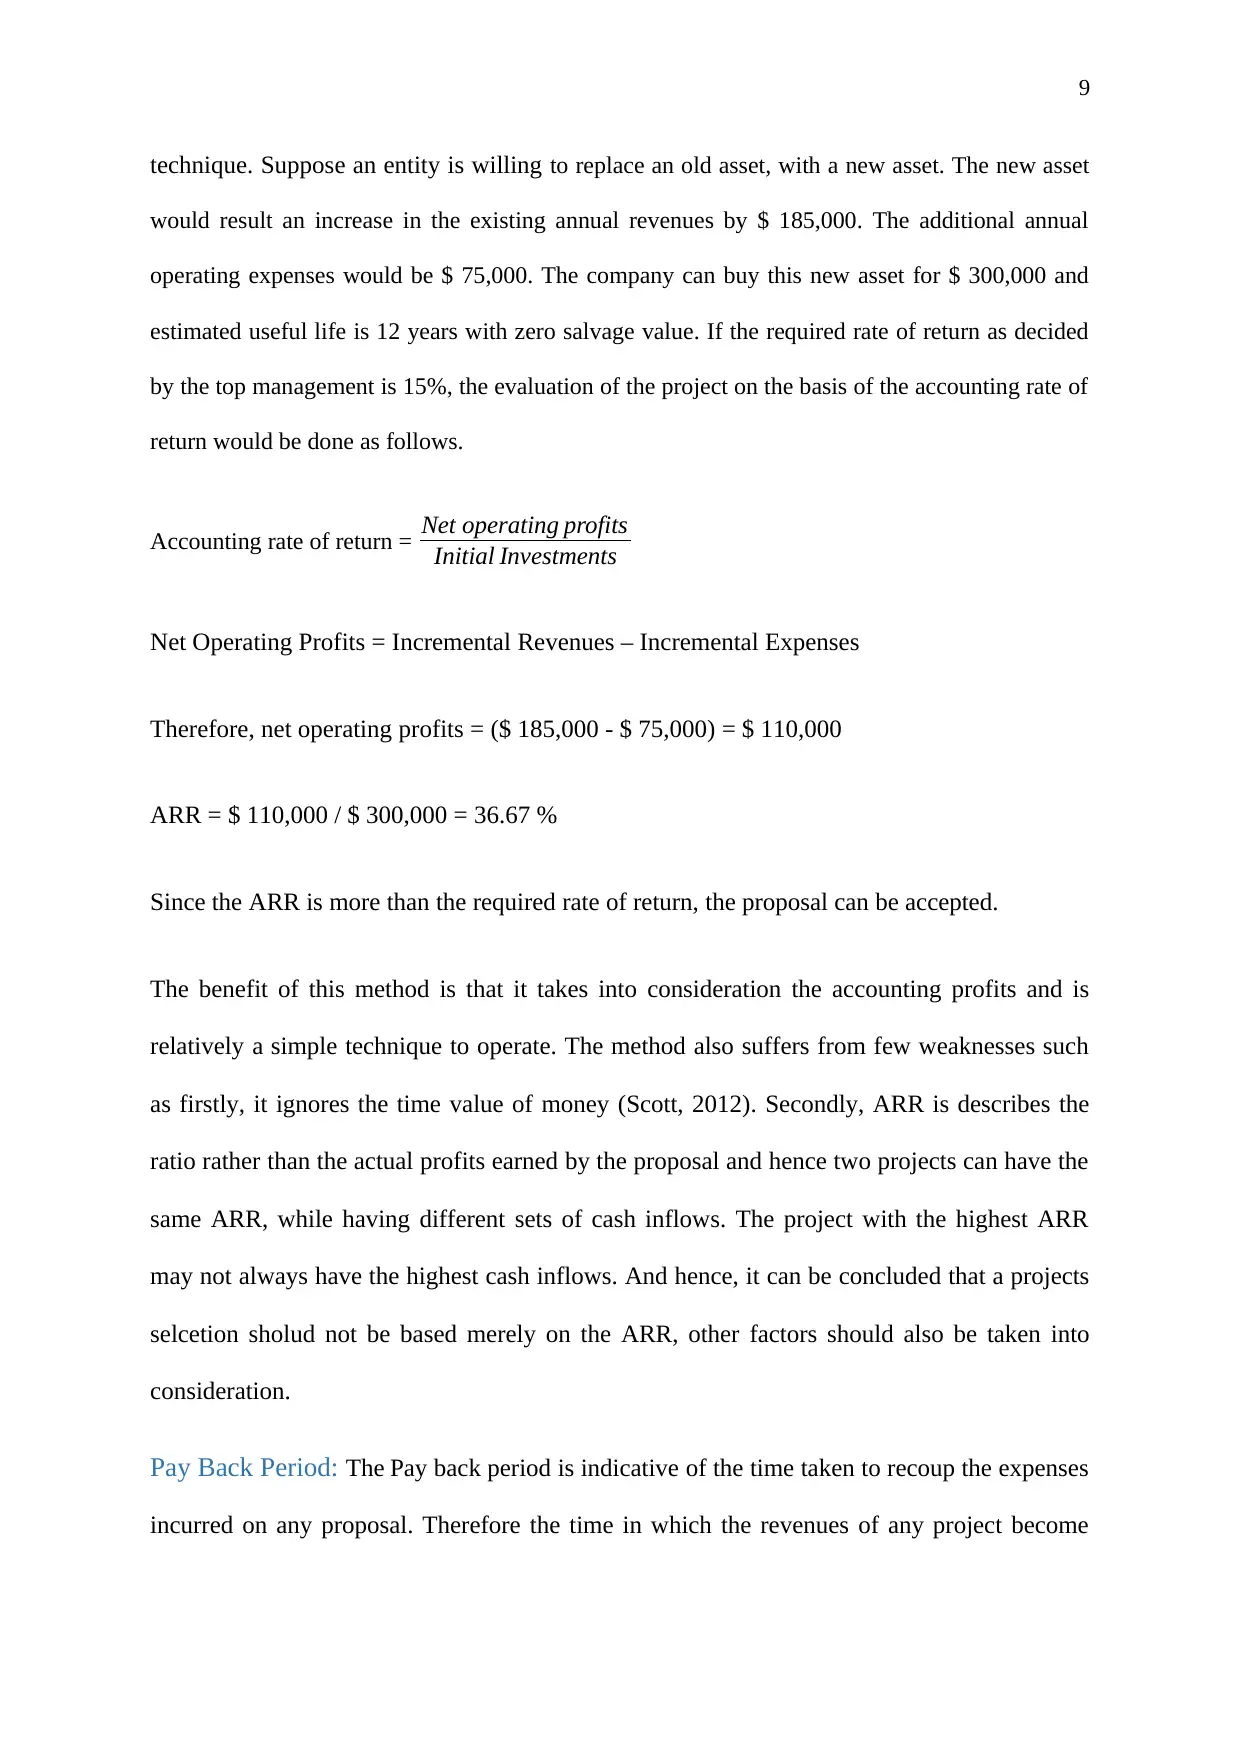
technique. Suppose an entity is willing to replace an old asset, with a new asset. The new asset
would result an increase in the existing annual revenues by $ 185,000. The additional annual
operating expenses would be $ 75,000. The company can buy this new asset for $ 300,000 and
estimated useful life is 12 years with zero salvage value. If the required rate of return as decided
by the top management is 15%, the evaluation of the project on the basis of the accounting rate of
return would be done as follows.
Accounting rate of return = Net operating profits
Initial Investments
Net Operating Profits = Incremental Revenues – Incremental Expenses
Therefore, net operating profits = ($ 185,000 - $ 75,000) = $ 110,000
ARR = $ 110,000 / $ 300,000 = 36.67 %
Since the ARR is more than the required rate of return, the proposal can be accepted.
The benefit of this method is that it takes into consideration the accounting profits and is
relatively a simple technique to operate. The method also suffers from few weaknesses such
as firstly, it ignores the time value of money (Scott, 2012). Secondly, ARR is describes the
ratio rather than the actual profits earned by the proposal and hence two projects can have the
same ARR, while having different sets of cash inflows. The project with the highest ARR
may not always have the highest cash inflows. And hence, it can be concluded that a projects
selcetion sholud not be based merely on the ARR, other factors should also be taken into
consideration.
Pay Back Period: The Pay back period is indicative of the time taken to recoup the expenses
incurred on any proposal. Therefore the time in which the revenues of any project become
Paraphrase This Document
Need a fresh take? Get an instant paraphrase of this document with our AI Paraphraser
10
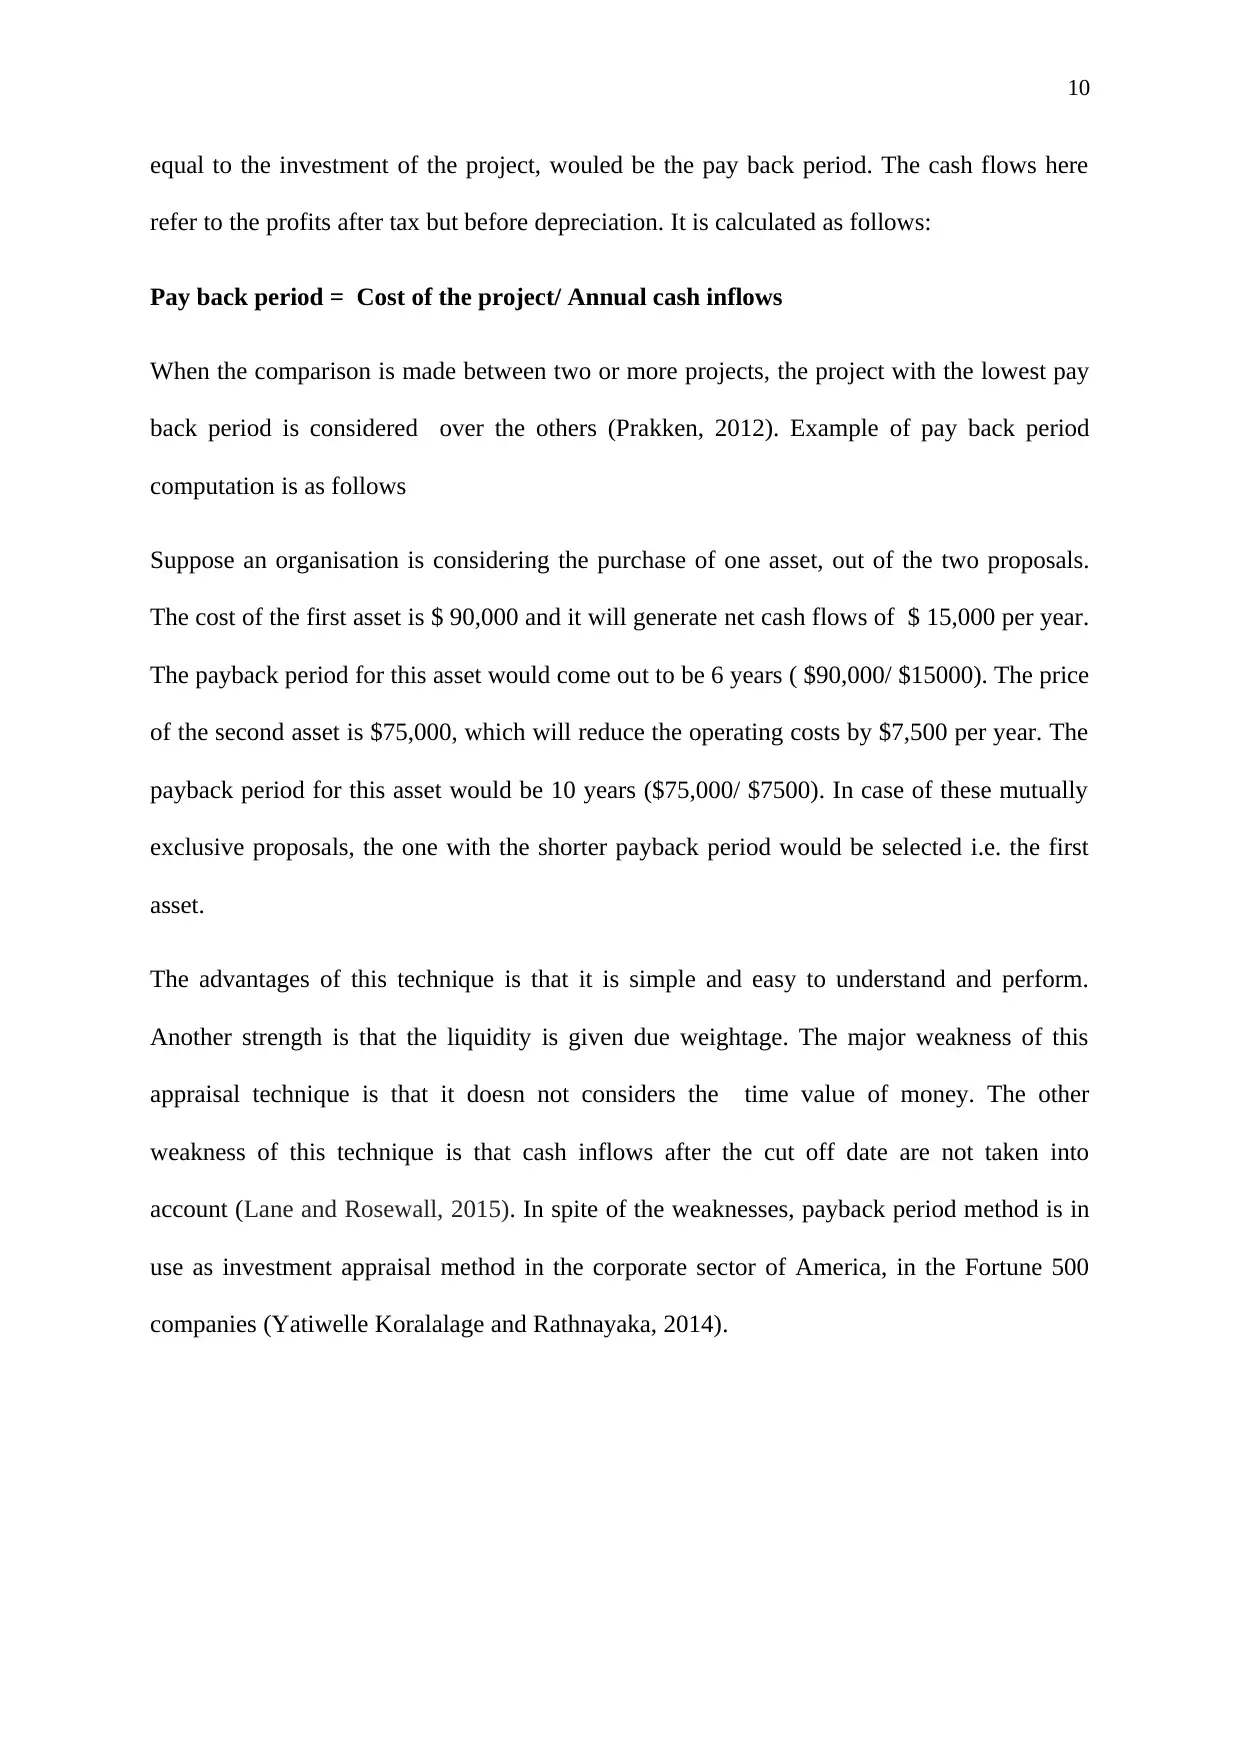
equal to the investment of the project, wouled be the pay back period. The cash flows here
refer to the profits after tax but before depreciation. It is calculated as follows:
Pay back period = Cost of the project/ Annual cash inflows
When the comparison is made between two or more projects, the project with the lowest pay
back period is considered over the others (Prakken, 2012). Example of pay back period
computation is as follows
Suppose an organisation is considering the purchase of one asset, out of the two proposals.
The cost of the first asset is $ 90,000 and it will generate net cash flows of $ 15,000 per year.
The payback period for this asset would come out to be 6 years ( $90,000/ $15000). The price
of the second asset is $75,000, which will reduce the operating costs by $7,500 per year. The
payback period for this asset would be 10 years ($75,000/ $7500). In case of these mutually
exclusive proposals, the one with the shorter payback period would be selected i.e. the first
asset.
The advantages of this technique is that it is simple and easy to understand and perform.
Another strength is that the liquidity is given due weightage. The major weakness of this
appraisal technique is that it doesn not considers the time value of money. The other
weakness of this technique is that cash inflows after the cut off date are not taken into
account (Lane and Rosewall, 2015). In spite of the weaknesses, payback period method is in
use as investment appraisal method in the corporate sector of America, in the Fortune 500
companies (Yatiwelle Koralalage and Rathnayaka, 2014).
11
Discounting Rates
The techniques that use the discounted cash flows require an appropriate discounting rate of
return, in order to compute the present equivalent of the future cash flows to be aroused out
of the projects. The computation of the applicable rate of return is a matter of strategic
importance. The two methods to be used for calculating the discounting rates are Weighted
Average Cost of Capital (WACC) and the Capital Asset Pricing Model (CAPM). The critical
analysis of WACC has been undertaken in the following segment.
Analysis of Weighted Average Cost of Capital (WACC) method
Weighted Average Cost of Capital is the overall average cost of different sources of capital
i.e. debt, equity shares, preference shares (Ross, et. al, 2014). This rate is often used as the
rate of return in the investment appraisal evaluations. Since while computing the weighted
average cost of capital, exact information of the market value of the assets and the required
rate of returns is not available accurately, the current market returns and the market related
information may be used as the required rate of returns (Pogue, 2010). In order to estimate
the weighted average cost of capital, effective rate of return of each category of investors is
determined. These effective returns are then proportioned in the ratio of the proportion of
either the book weights or the market capitalization of each investor type. And therefore,
formula for WACC in case of say market weights comes out to be
⊘ This is a preview!⊘
Do you want full access?
Subscribe today to unlock all pages.
Trusted by 1+ million students worldwide
1 out of 19
Related Documents


Your All-in-One AI-Powered Toolkit for Academic Success.
+13062052269
info@desklib.com
Available 24*7 on WhatsApp / Email
![[object Object]](/_next/static/media/star-bottom.7253800d.svg)
Unlock your academic potential
Copyright © 2020–2026 A2Z Services. All Rights Reserved. Developed and managed by ZUCOL.