Financial Modeling Project: Investment Appraisal of a Tenant Property
VerifiedAdded on  2022/09/18
|29
|2685
|32
Project
AI Summary
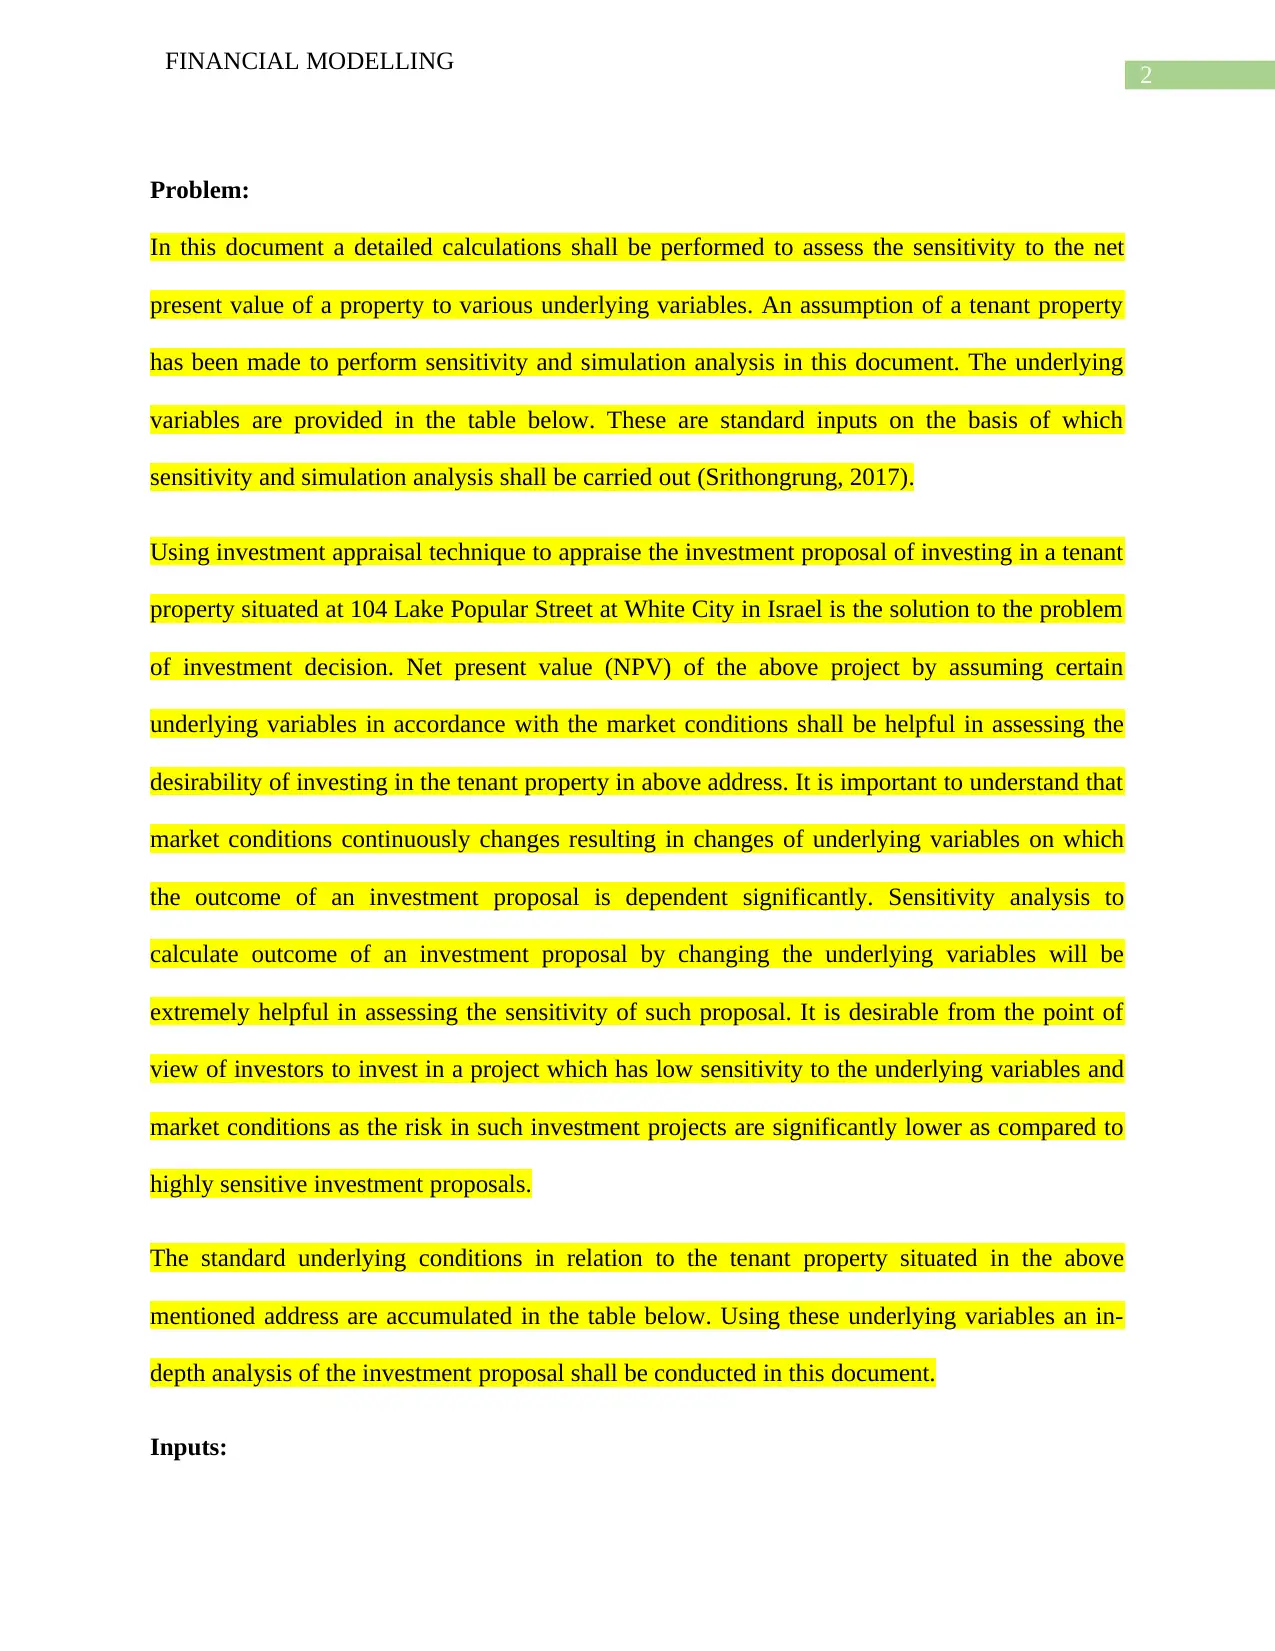
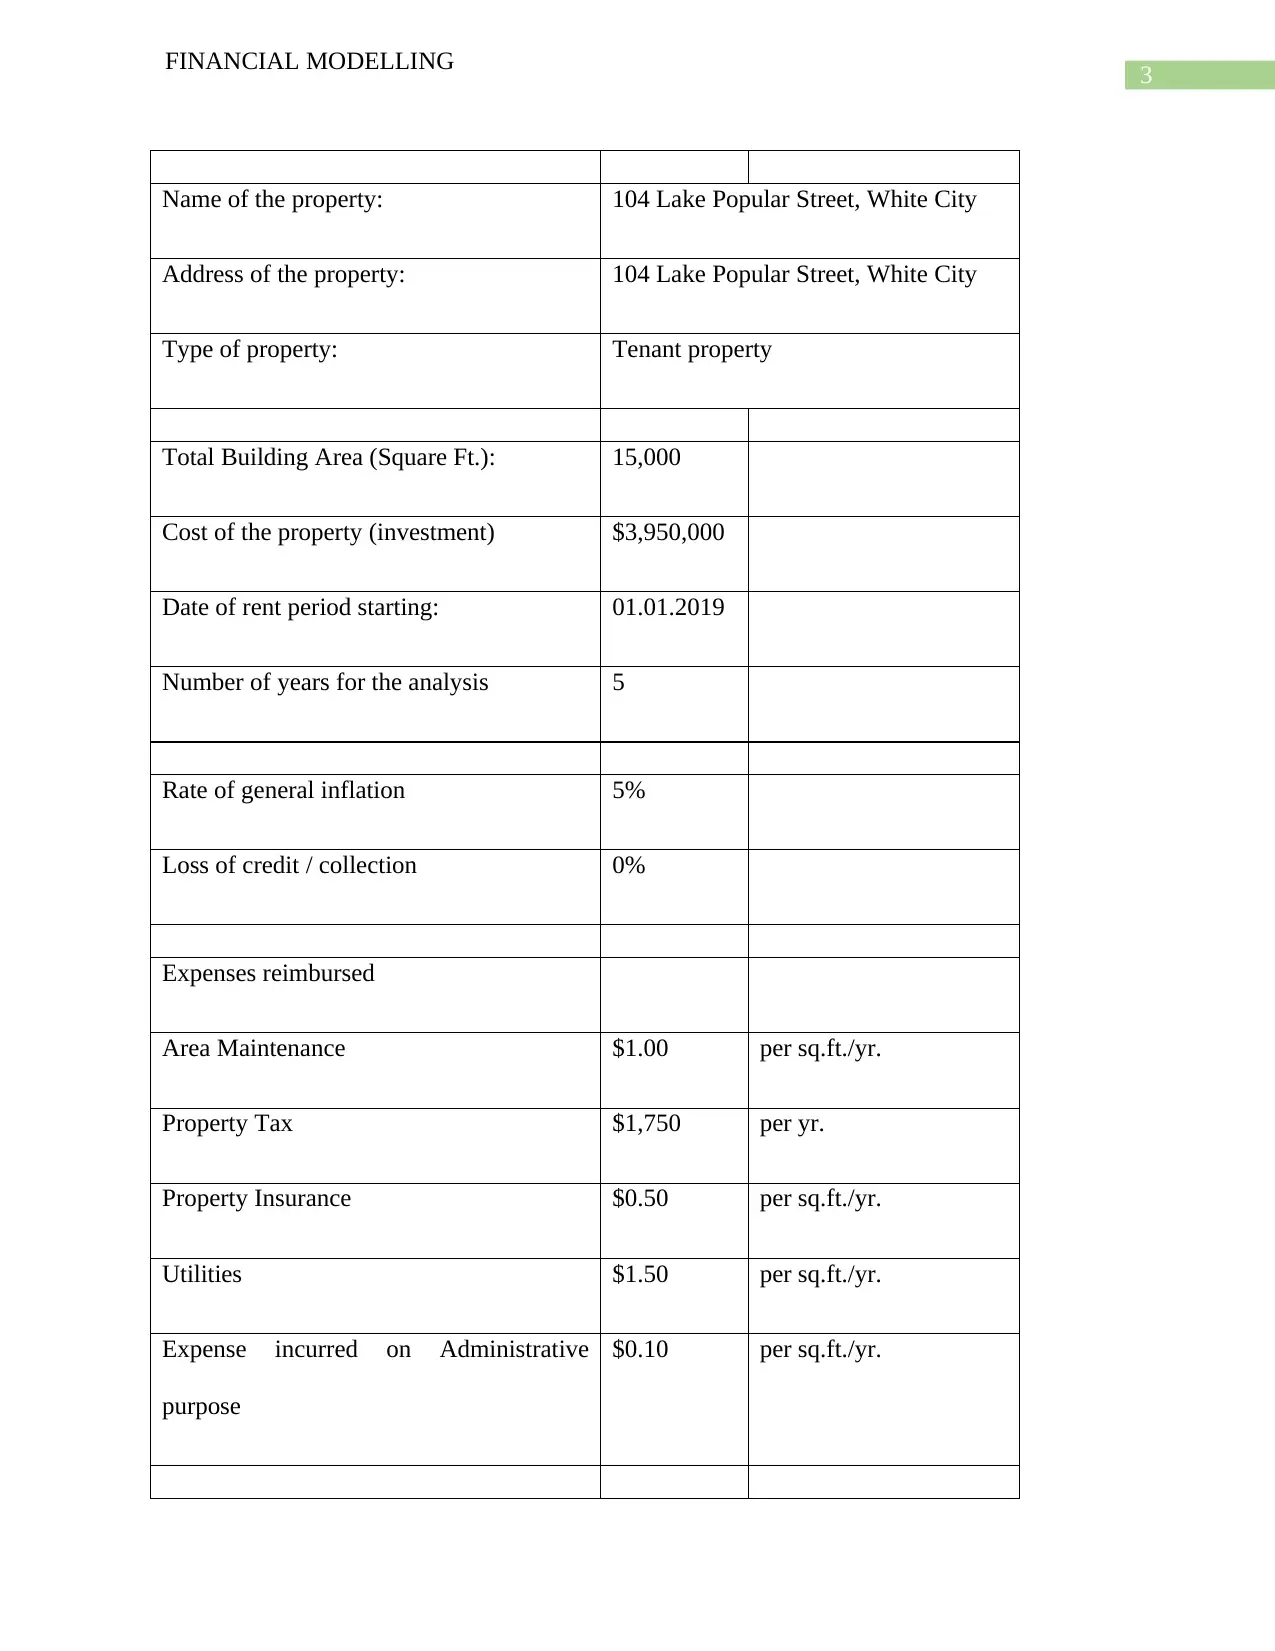
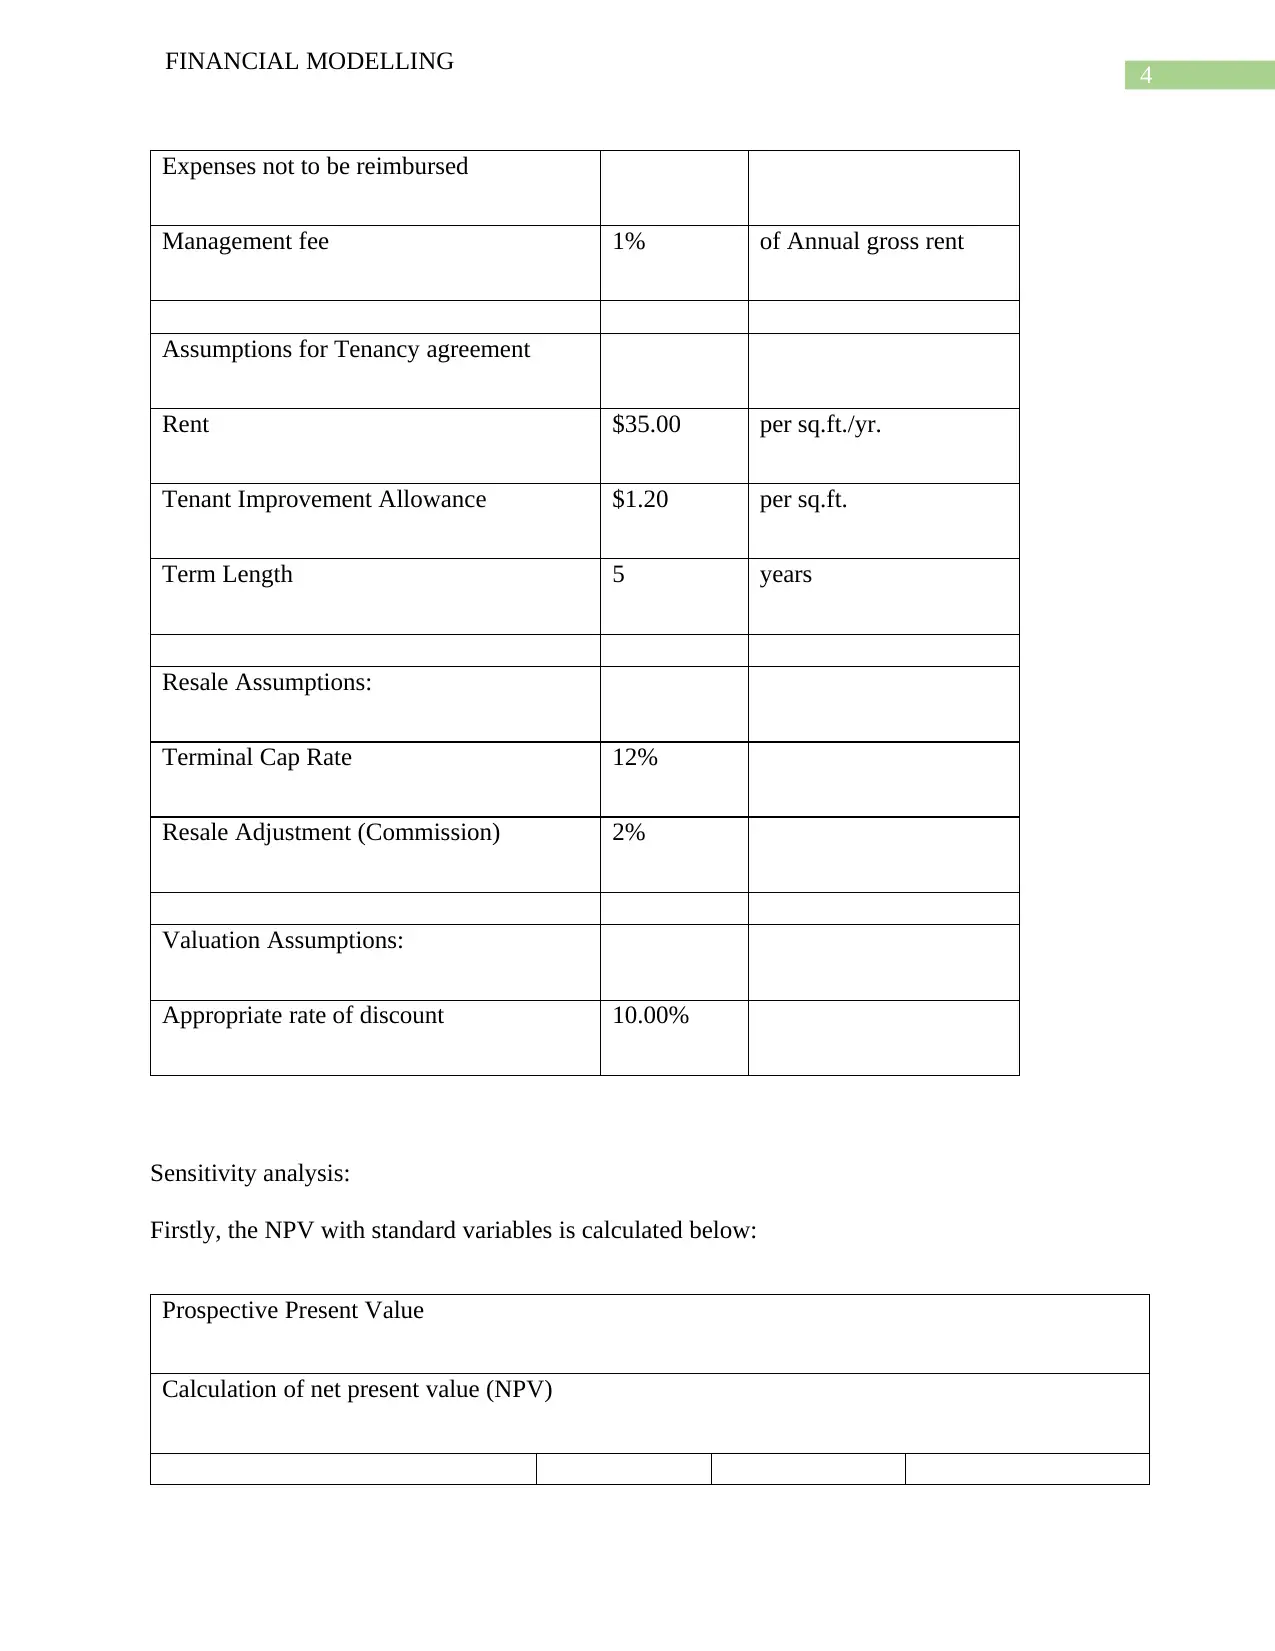
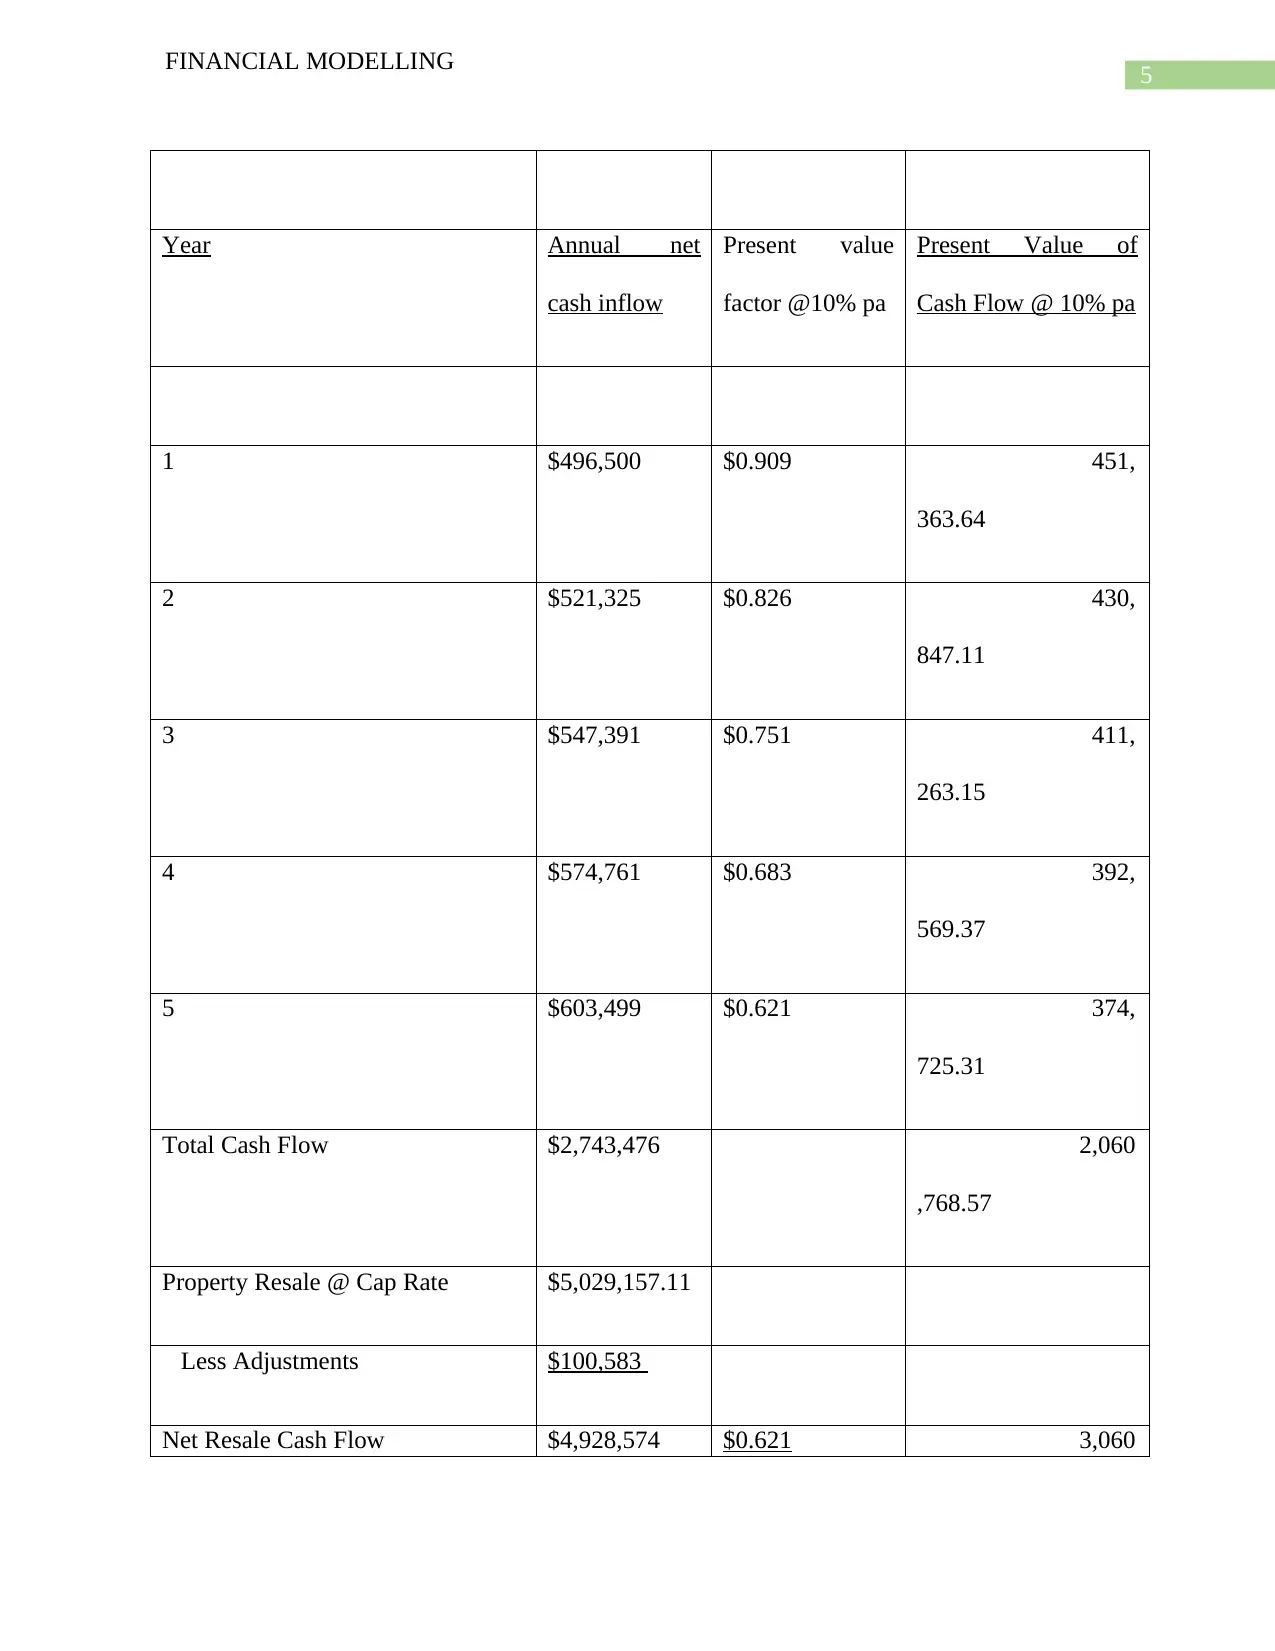
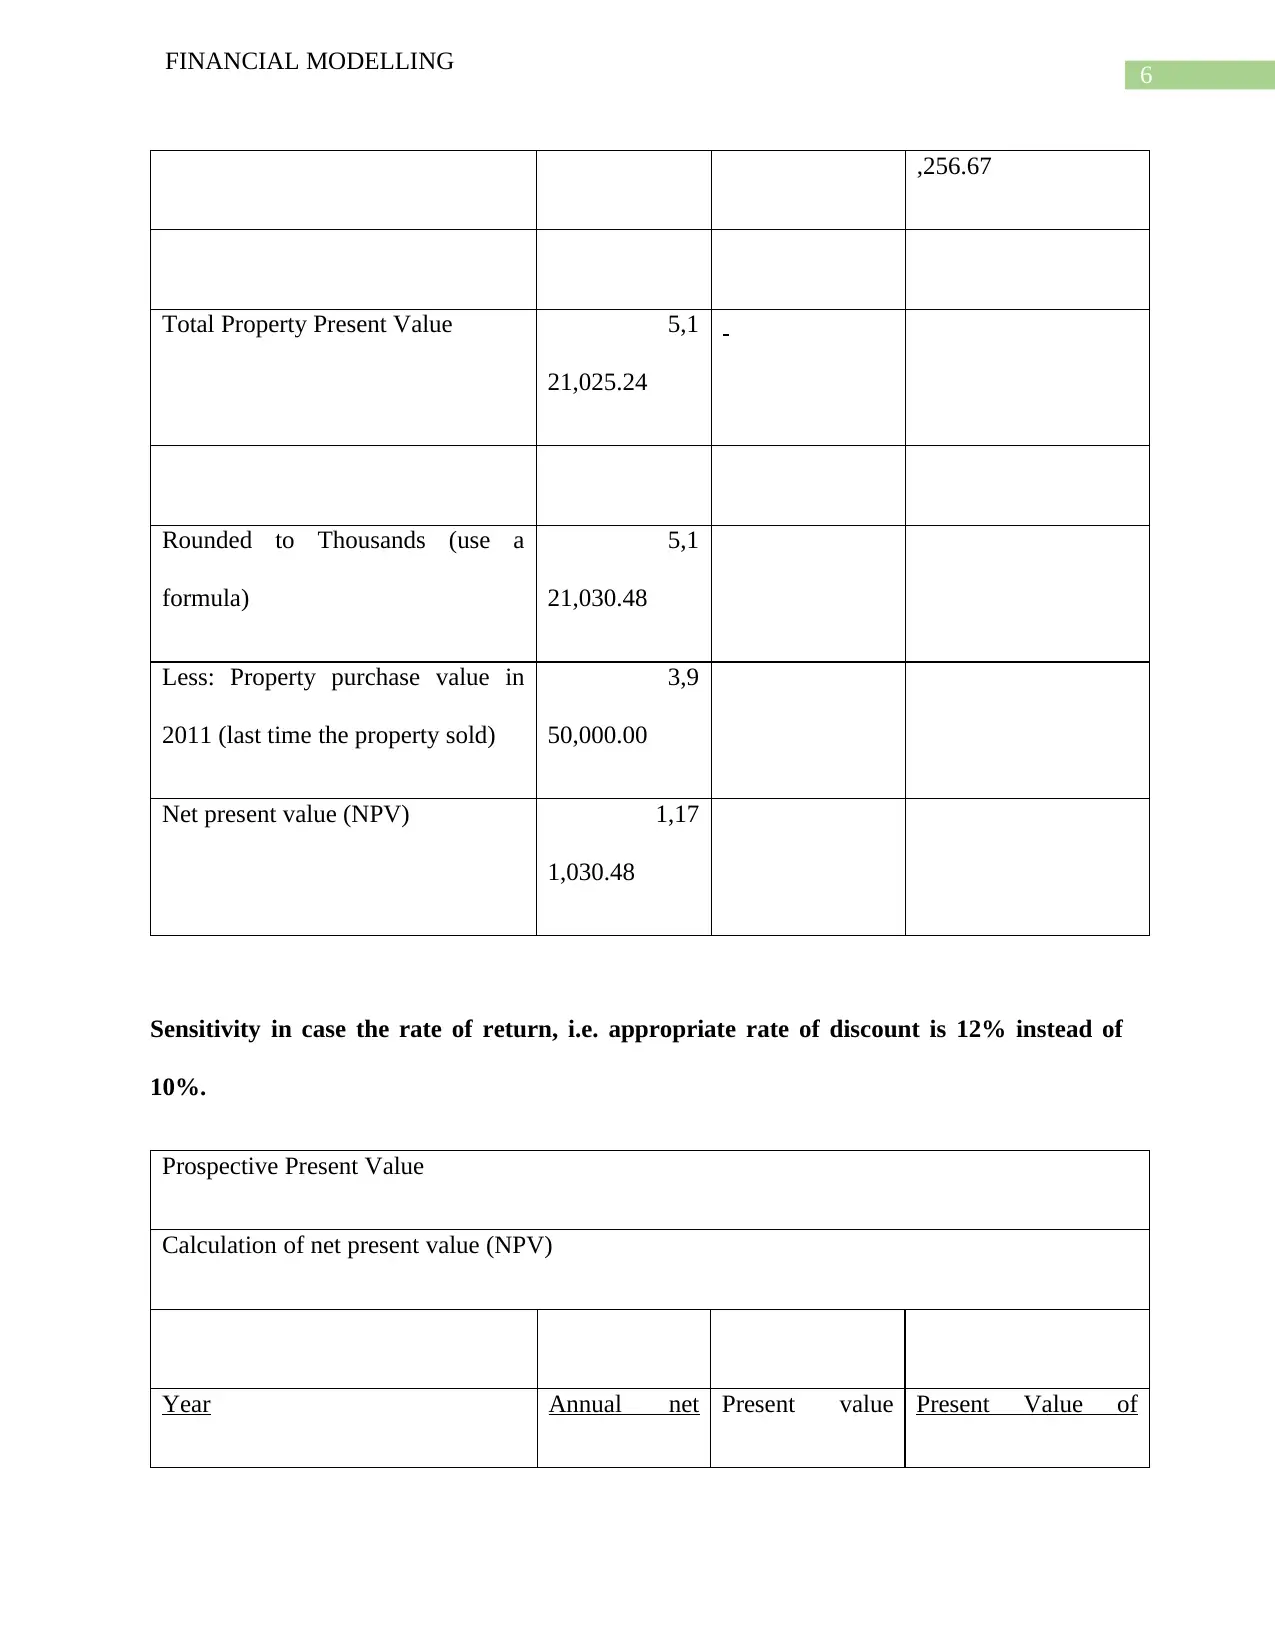
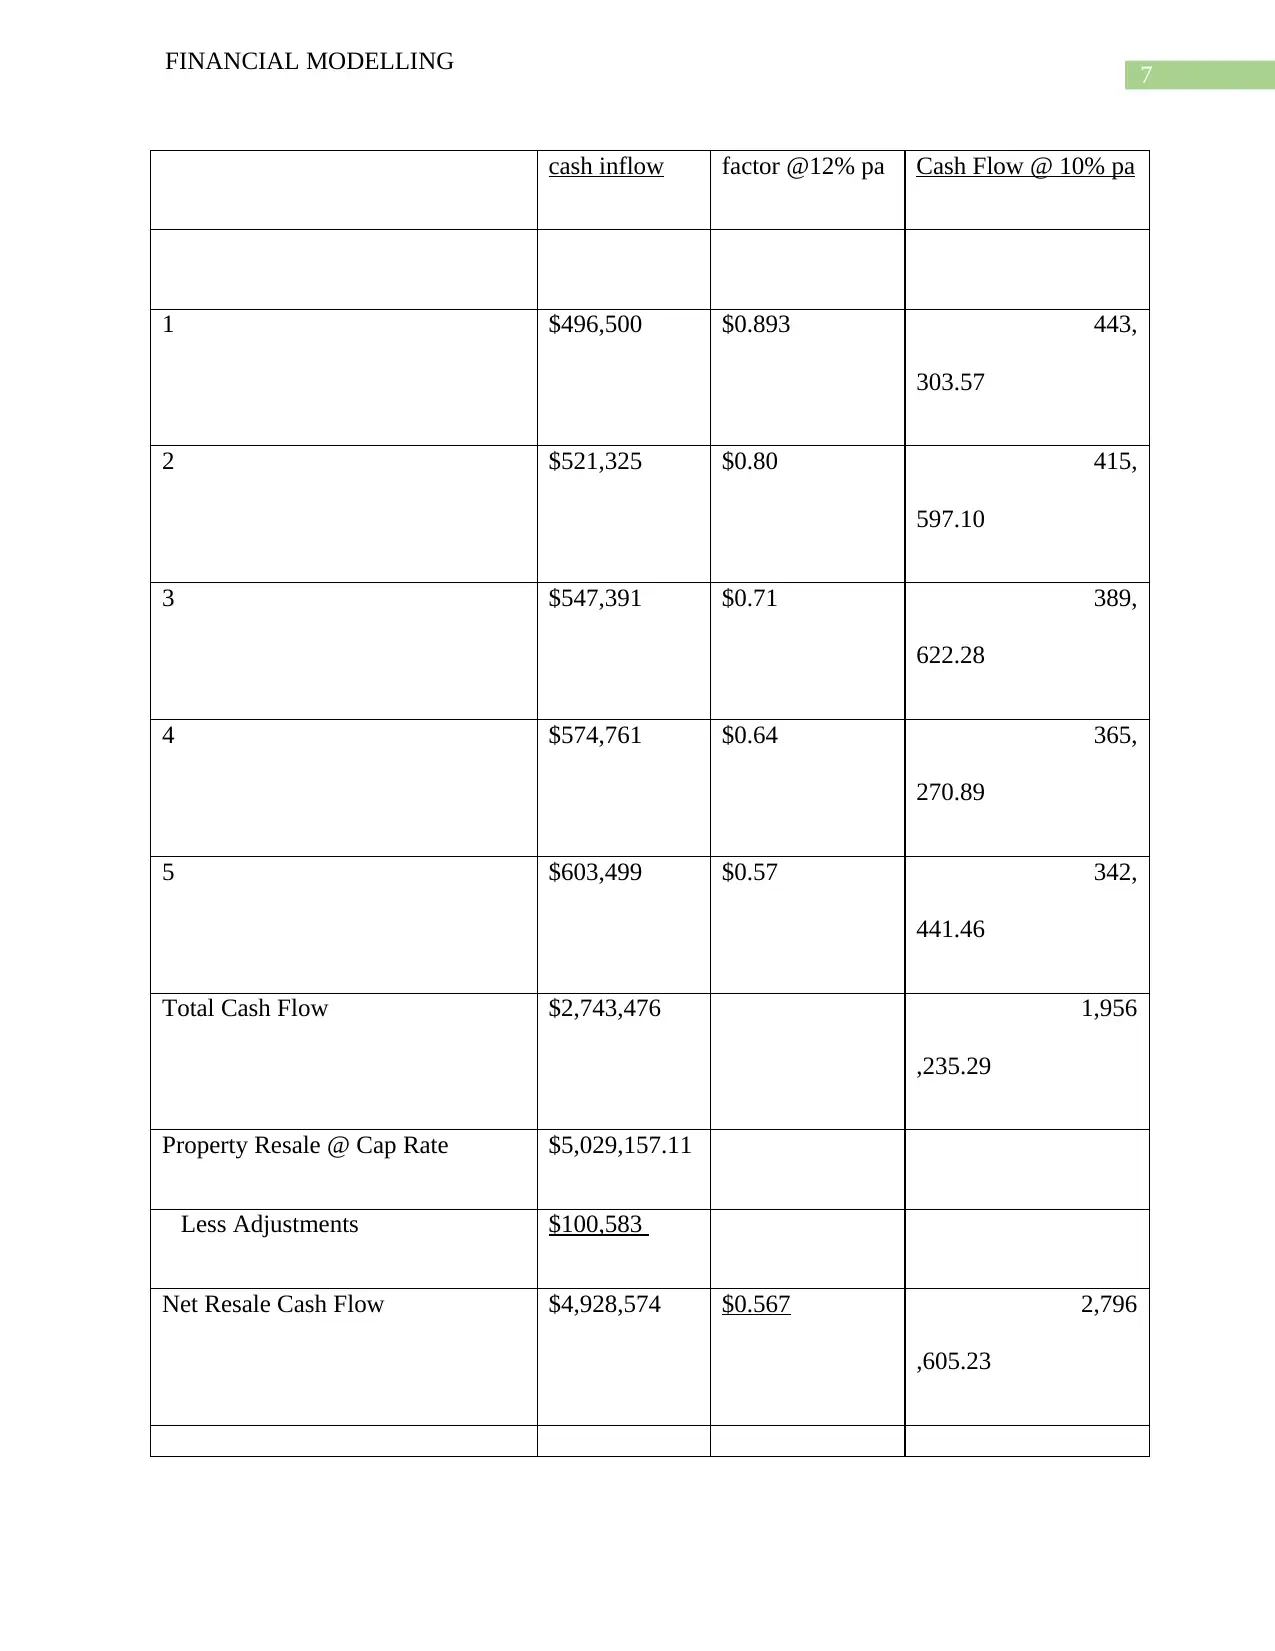
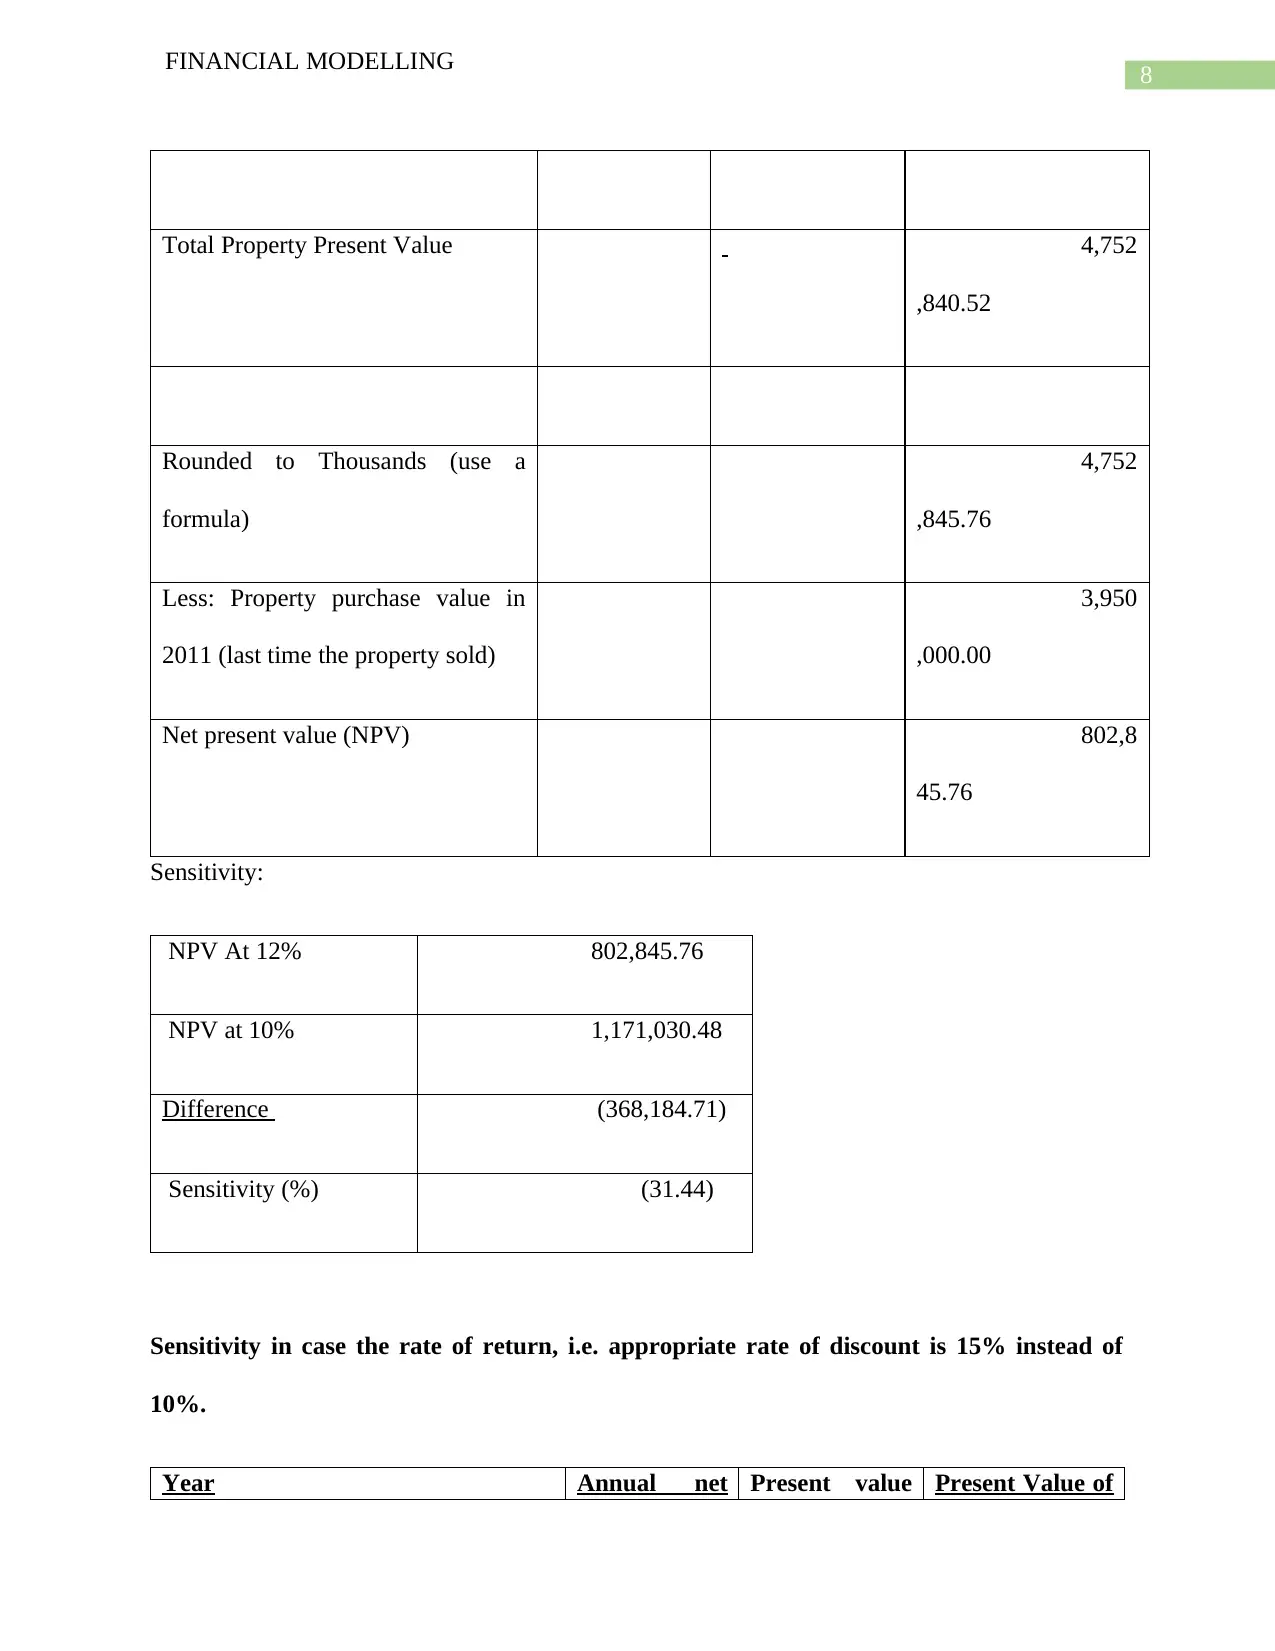
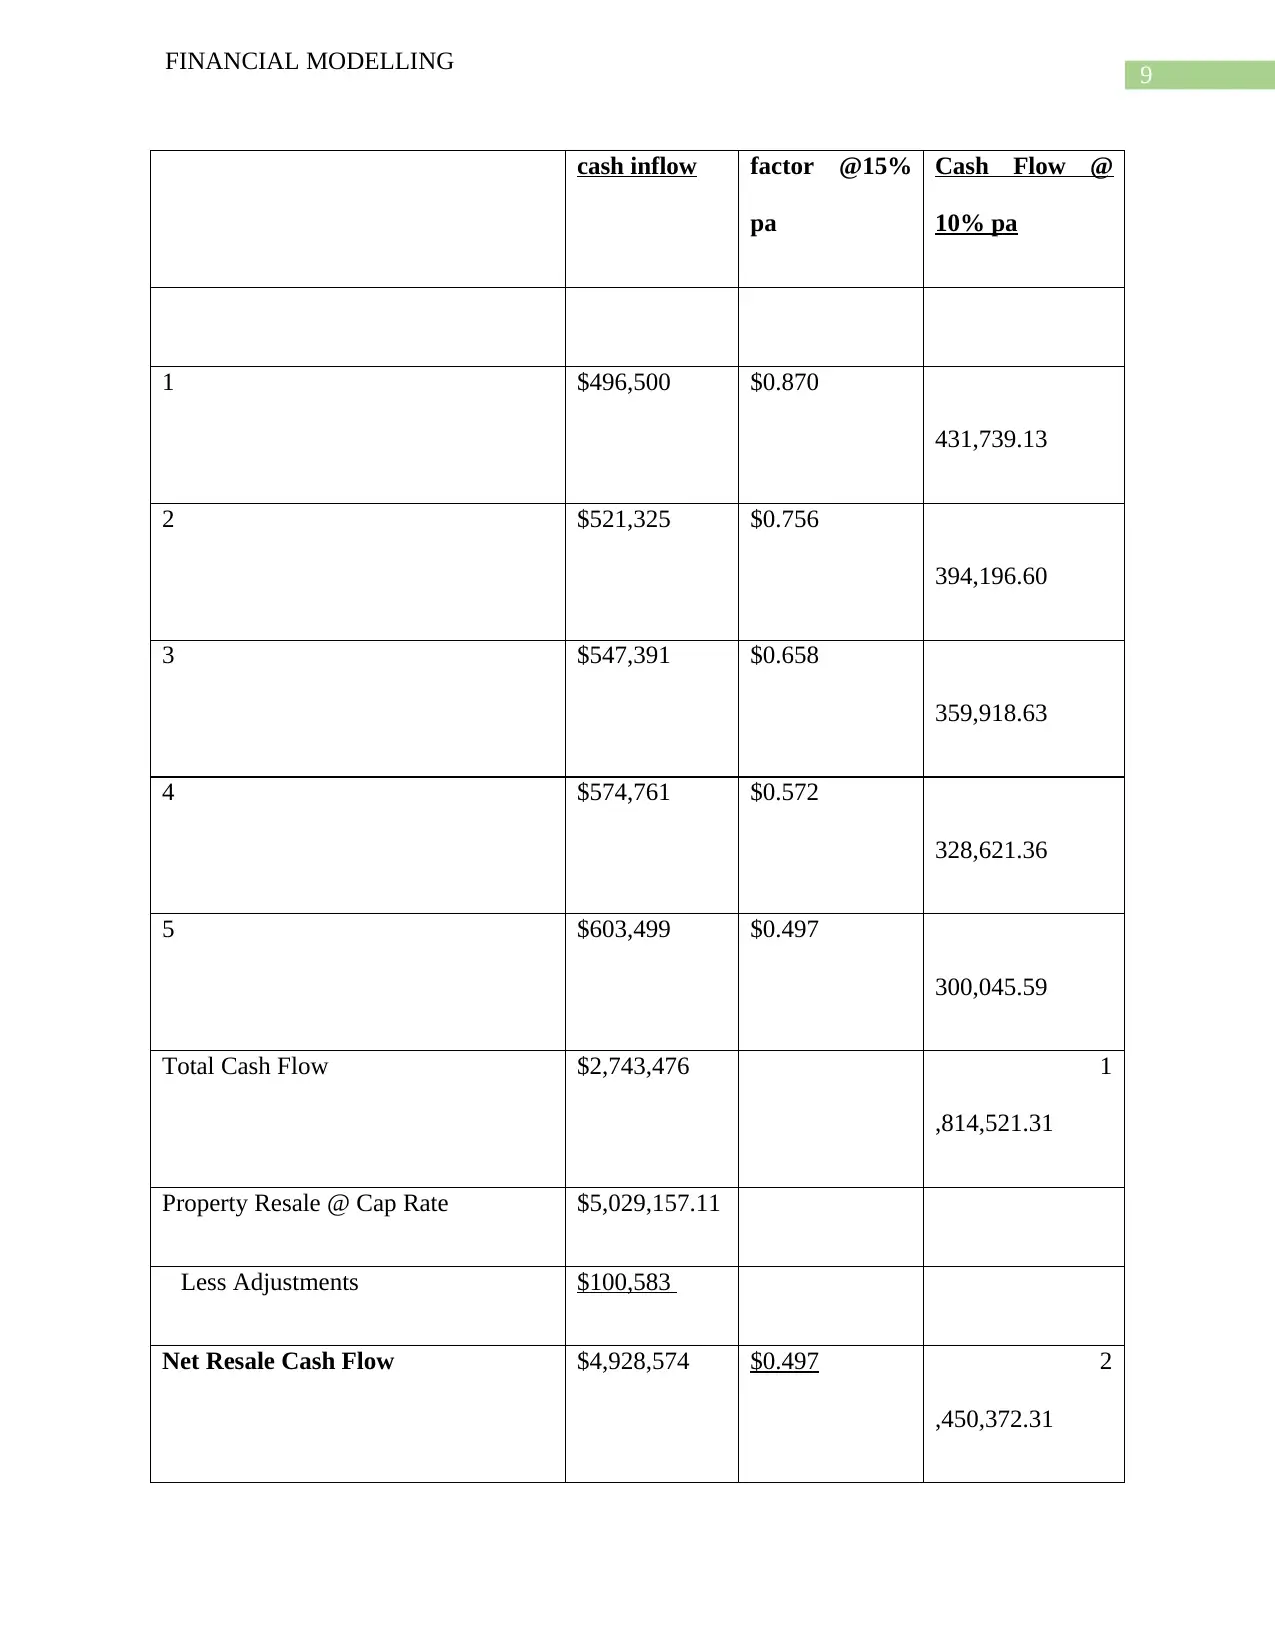
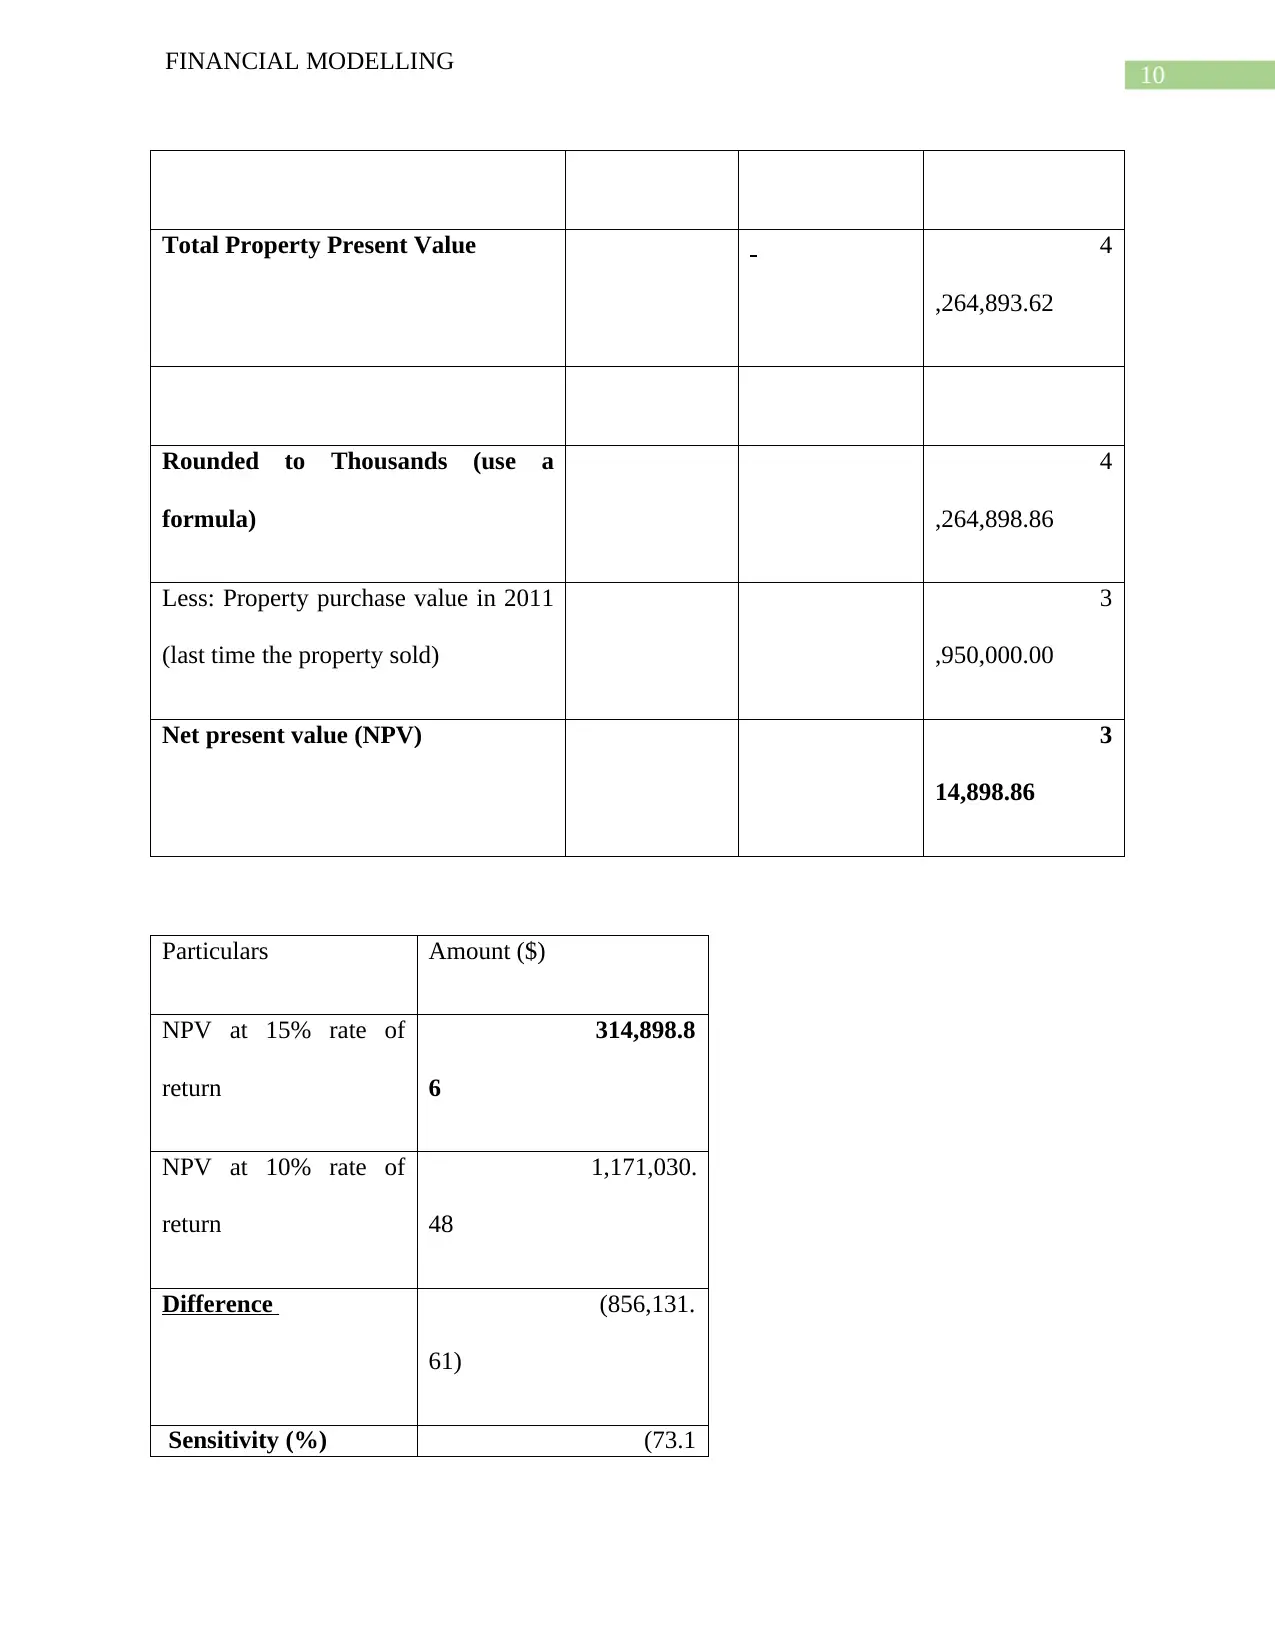
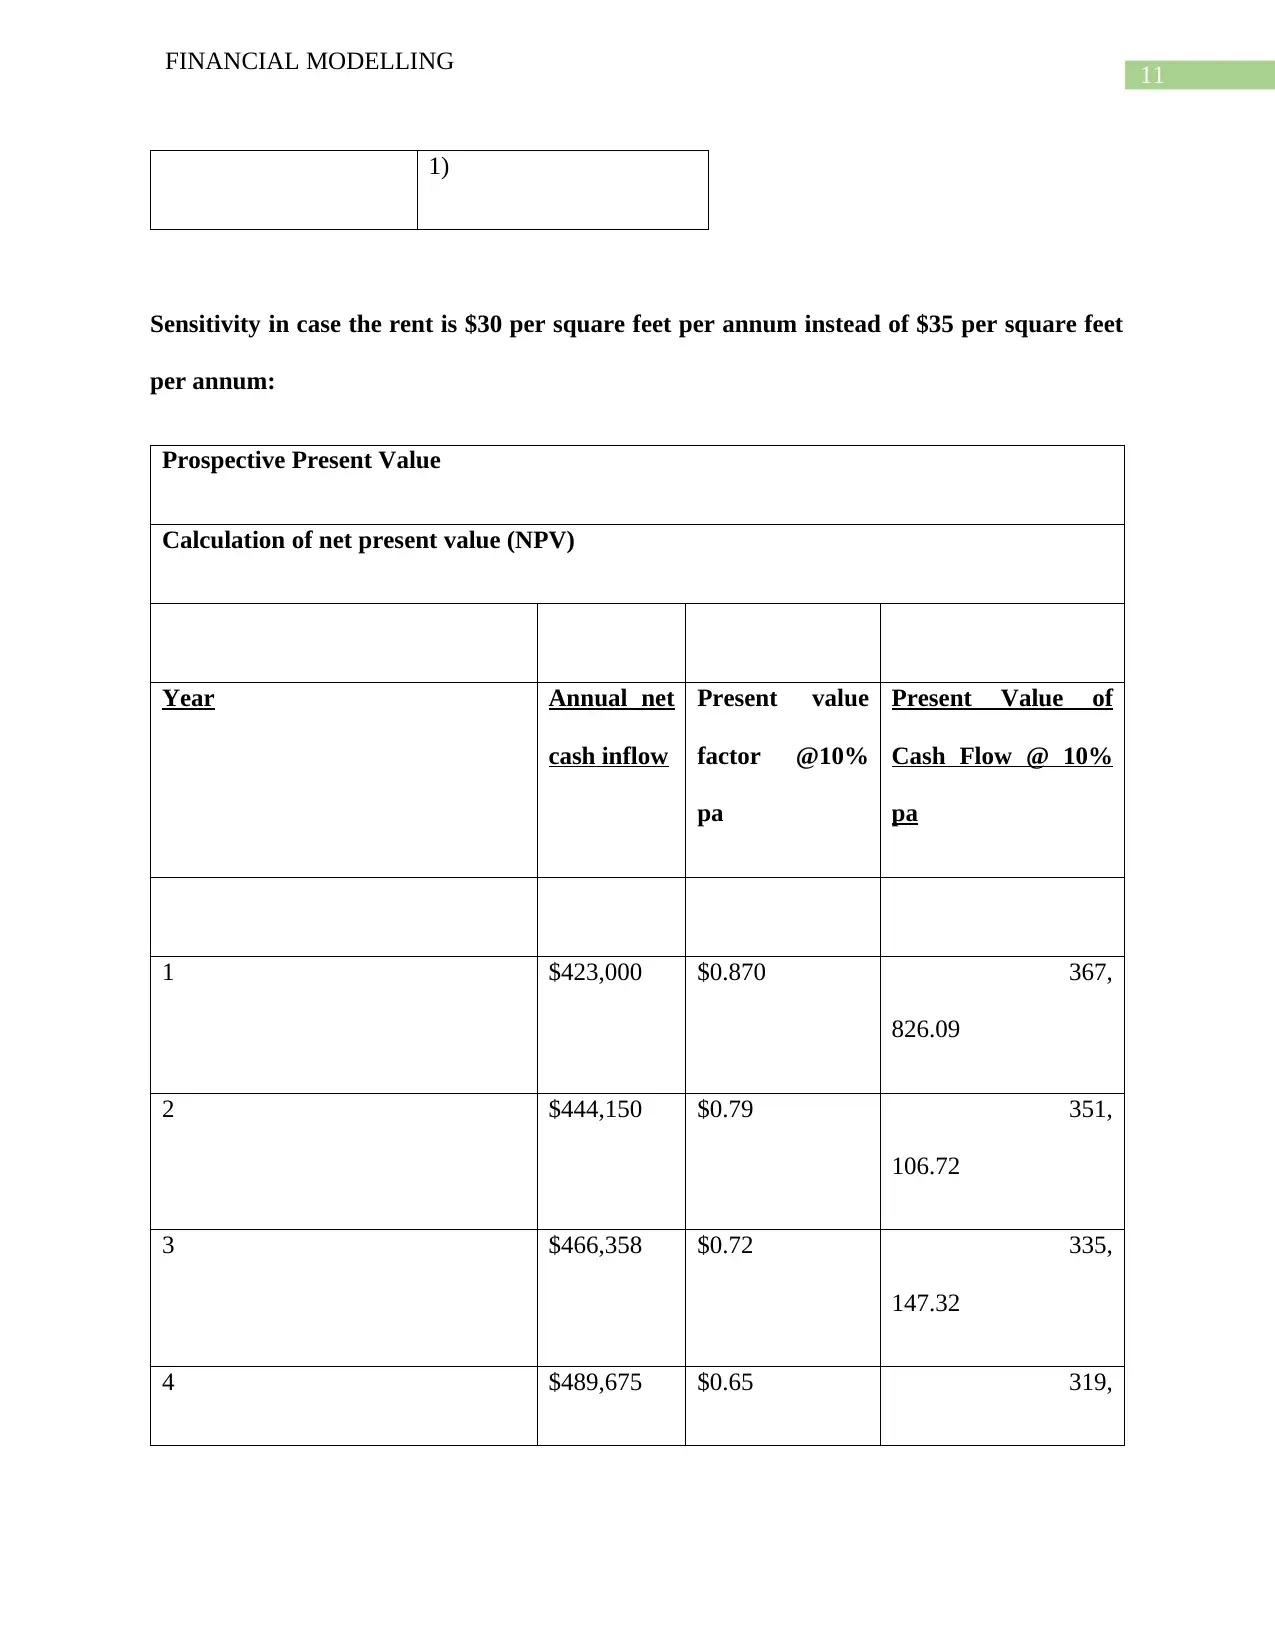
This document presents a comprehensive financial modeling project focused on the investment appraisal of a tenant property located at 104 Lake Popular Street, White City, Israel. The project includes detailed calculations to assess the sensitivity of the Net Present Value (NPV) to various underlying variables. The analysis considers factors such as rent, expenses, and the discount rate. Sensitivity analysis is performed by changing variables like the discount rate and rent per square foot. Simulation of a stochastic variable is used to analyze the impact of uncertain annual cash inflows. The project also covers pricing strategies, optimization using Excel, and the application of the Capital Asset Pricing Model (CAPM) to determine the cost of capital. The document highlights the advantages of financial modeling in making informed investment decisions by assessing potential outcomes under different market conditions. It uses a variety of financial modeling techniques to provide a detailed analysis of the investment's potential.

Running head: FINANCIAL MODELLING
Financial Modelling
Name of the Student:
Name of the University:
Authors Note:
Financial Modelling
Name of the Student:
Name of the University:
Authors Note:
Secure Best Marks with AI Grader
Need help grading? Try our AI Grader for instant feedback on your assignments.

1
FINANCIAL MODELLING
Contents
Problem:...........................................................................................................................................2
Sensitivity analysis:.........................................................................................................................4
Simulation of a stochastic variable:...............................................................................................13
Pricing:...........................................................................................................................................16
Optimizing using excel:.................................................................................................................17
CAPM Model illustration:.............................................................................................................26
References:....................................................................................................................................28

2
FINANCIAL MODELLING
Problem:
In this document a detailed calculations shall be performed to assess the sensitivity to the net
present value of a property to various underlying variables. An assumption of a tenant property
has been made to perform sensitivity and simulation analysis in this document. The underlying
variables are provided in the table below. These are standard inputs on the basis of which
sensitivity and simulation analysis shall be carried out (Srithongrung, 2017).
Using investment appraisal technique to appraise the investment proposal of investing in a tenant
property situated at 104 Lake Popular Street at White City in Israel is the solution to the problem
of investment decision. Net present value (NPV) of the above project by assuming certain
underlying variables in accordance with the market conditions shall be helpful in assessing the
desirability of investing in the tenant property in above address. It is important to understand that
market conditions continuously changes resulting in changes of underlying variables on which
the outcome of an investment proposal is dependent significantly. Sensitivity analysis to
calculate outcome of an investment proposal by changing the underlying variables will be
extremely helpful in assessing the sensitivity of such proposal. It is desirable from the point of
view of investors to invest in a project which has low sensitivity to the underlying variables and
market conditions as the risk in such investment projects are significantly lower as compared to
highly sensitive investment proposals.
The standard underlying conditions in relation to the tenant property situated in the above
mentioned address are accumulated in the table below. Using these underlying variables an in-
depth analysis of the investment proposal shall be conducted in this document.
Inputs:

3
FINANCIAL MODELLING
Name of the property: 104 Lake Popular Street, White City
Address of the property: 104 Lake Popular Street, White City
Type of property: Tenant property
Total Building Area (Square Ft.): 15,000
Cost of the property (investment) $3,950,000
Date of rent period starting: 01.01.2019
Number of years for the analysis 5
Rate of general inflation 5%
Loss of credit / collection 0%
Expenses reimbursed
Area Maintenance $1.00 per sq.ft./yr.
Property Tax $1,750 per yr.
Property Insurance $0.50 per sq.ft./yr.
Utilities $1.50 per sq.ft./yr.
Expense incurred on Administrative
purpose
$0.10 per sq.ft./yr.
Secure Best Marks with AI Grader
Need help grading? Try our AI Grader for instant feedback on your assignments.

4
FINANCIAL MODELLING
Expenses not to be reimbursed
Management fee 1% of Annual gross rent
Assumptions for Tenancy agreement
Rent $35.00 per sq.ft./yr.
Tenant Improvement Allowance $1.20 per sq.ft.
Term Length 5 years
Resale Assumptions:
Terminal Cap Rate 12%
Resale Adjustment (Commission) 2%
Valuation Assumptions:
Appropriate rate of discount 10.00%
Sensitivity analysis:
Firstly, the NPV with standard variables is calculated below:
Prospective Present Value
Calculation of net present value (NPV)

5
FINANCIAL MODELLING
Year Annual net
cash inflow
Present value
factor @10% pa
Present Value of
Cash Flow @ 10% pa
1 $496,500 $0.909 451,
363.64
2 $521,325 $0.826 430,
847.11
3 $547,391 $0.751 411,
263.15
4 $574,761 $0.683 392,
569.37
5 $603,499 $0.621 374,
725.31
Total Cash Flow $2,743,476 2,060
,768.57
Property Resale @ Cap Rate $5,029,157.11
Less Adjustments $100,583
Net Resale Cash Flow $4,928,574 $0.621 3,060

6
FINANCIAL MODELLING
,256.67
Total Property Present Value 5,1
21,025.24
Rounded to Thousands (use a
formula)
5,1
21,030.48
Less: Property purchase value in
2011 (last time the property sold)
3,9
50,000.00
Net present value (NPV) 1,17
1,030.48
Sensitivity in case the rate of return, i.e. appropriate rate of discount is 12% instead of
10%.
Prospective Present Value
Calculation of net present value (NPV)
Year Annual net Present value Present Value of
Paraphrase This Document
Need a fresh take? Get an instant paraphrase of this document with our AI Paraphraser

7
FINANCIAL MODELLING
cash inflow factor @12% pa Cash Flow @ 10% pa
1 $496,500 $0.893 443,
303.57
2 $521,325 $0.80 415,
597.10
3 $547,391 $0.71 389,
622.28
4 $574,761 $0.64 365,
270.89
5 $603,499 $0.57 342,
441.46
Total Cash Flow $2,743,476 1,956
,235.29
Property Resale @ Cap Rate $5,029,157.11
Less Adjustments $100,583
Net Resale Cash Flow $4,928,574 $0.567 2,796
,605.23

8
FINANCIAL MODELLING
Total Property Present Value 4,752
,840.52
Rounded to Thousands (use a
formula)
4,752
,845.76
Less: Property purchase value in
2011 (last time the property sold)
3,950
,000.00
Net present value (NPV) 802,8
45.76
Sensitivity:
NPV At 12% 802,845.76
NPV at 10% 1,171,030.48
Difference (368,184.71)
Sensitivity (%) (31.44)
Sensitivity in case the rate of return, i.e. appropriate rate of discount is 15% instead of
10%.
Year Annual net Present value Present Value of

9
FINANCIAL MODELLING
cash inflow factor @15%
pa
Cash Flow @
10% pa
1 $496,500 $0.870
431,739.13
2 $521,325 $0.756
394,196.60
3 $547,391 $0.658
359,918.63
4 $574,761 $0.572
328,621.36
5 $603,499 $0.497
300,045.59
Total Cash Flow $2,743,476 1
,814,521.31
Property Resale @ Cap Rate $5,029,157.11
Less Adjustments $100,583
Net Resale Cash Flow $4,928,574 $0.497 2
,450,372.31
Secure Best Marks with AI Grader
Need help grading? Try our AI Grader for instant feedback on your assignments.

10
FINANCIAL MODELLING
Total Property Present Value 4
,264,893.62
Rounded to Thousands (use a
formula)
4
,264,898.86
Less: Property purchase value in 2011
(last time the property sold)
3
,950,000.00
Net present value (NPV) 3
14,898.86
Particulars Amount ($)
NPV at 15% rate of
return
314,898.8
6
NPV at 10% rate of
return
1,171,030.
48
Difference (856,131.
61)
Sensitivity (%) (73.1

11
FINANCIAL MODELLING
1)
Sensitivity in case the rent is $30 per square feet per annum instead of $35 per square feet
per annum:
Prospective Present Value
Calculation of net present value (NPV)
Year Annual net
cash inflow
Present value
factor @10%
pa
Present Value of
Cash Flow @ 10%
pa
1 $423,000 $0.870 367,
826.09
2 $444,150 $0.79 351,
106.72
3 $466,358 $0.72 335,
147.32
4 $489,675 $0.65 319,

12
FINANCIAL MODELLING
913.35
5 $514,159 $0.59 305,
371.84
Total Cash Flow $2,337,342 1,679
,365.32
Property Resale @ Cap Rate $4,284,659.
53
Less Adjustments $85,693
Net Resale Cash Flow $4,198,966 $0.594 2,493
,870.01
Total Property Present Value 4,173
,235.33
Rounded to Thousands (use a
formula)
4,173
,240.57
Less: Property purchase value in
2011 (last time the property sold)
3,950
,000.00
Net present value (NPV) 223,2
Paraphrase This Document
Need a fresh take? Get an instant paraphrase of this document with our AI Paraphraser

13
FINANCIAL MODELLING
40.57
Sensitivity:
Particulars Amount ($)
NPV with $30 per S. ft.
rent
223,240.5
7
NPV with $35 per S. ft.
rent
1,171,030.
48
Difference (947,789.
91)
Sensitivity (%) (80.9
4)
Simulation of a stochastic variable:
In case the standard variables remain stochastic the annual cash inflows will be as following.
Year 1 Year 2 Year 3 Year 4 Year 5
Year ending Dec-19 Dec-20 Dec-21 Dec-22 Dec-23

14
FINANCIAL MODELLING
Gross revenue (Expected)
Revenue from rental $450,000 $472,500 $496,125 $520,931 $546,978
Less: Loss due to absorption
& Turnover Vac.
$0 $0 $0 $0 $0
Net rent receivable $450,000 $472,500 $496,125 $520,931 $546,978
Total Reimbursement
Revenue
$48,250 $50,200 $52,248 $54,397 $56,655
Effective Gross Revenue
receivable
$498,250 $522,700 $548,373 $575,329 $603,633
Operating Expenses
Reimbursable Expenses
Common Area
Maintenance
$15,000 $15,750 $16,538 $17,364 $18,233
Ad Valorem Tax $1,750 $1,750 $1,750 $1,750 $1,750
Property Insurance $7,500 $7,500 $7,500 $7,500 $7,500

15
FINANCIAL MODELLING
Utilities $22,500 $23,625 $24,806 $26,047 $27,349
Administrative Expense $1,500 $1,575 $1,654 $1,736 $1,823
Non-reimbursable
Expenses
Management $9,000.0
0
$9,450.0
0
$9,922.5
0
$10,418.
63
$10,939.
56
Total Operating Expenses $57,250 $59,650 $62,170 $64,816 $67,594
Net Operating Income $441,000 $463,050 $486,203 $510,513 $536,038
Capital cost
Tenant Improvements $18,000 $18,900 $19,845 $20,837 $21,879
Total Capital Costs $18,000 $18,900 $19,845 $20,837 $21,879
Net cash flow after meeting
all expenditures
$423,000 $444,150 $466,358 $489,675 $514,159
PV factors @10% pa 0.909090 0.826446 0.751314 0.683013 0.620921
Secure Best Marks with AI Grader
Need help grading? Try our AI Grader for instant feedback on your assignments.

16
FINANCIAL MODELLING
909 281 801 455 323
Discounted cash inflow (Net) $384,545
.45
$367,066
.12
$350,381
.29
$334,454
.87
$319,252
.38
Pricing:
Present value of cash inflows with standard variables.
Prospective Present Value
Calculation of net present value (NPV)
Year Annual net
cash inflow
Present value factor
@10% pa
Present Value of Cash
Flow @ 10% pa
1 $496,500 $0.909 451,363.6
4
2 $521,325 $0.826 430,847.1
1
3 $547,391 $0.751 411,263.1

17
FINANCIAL MODELLING
5
4 $574,761 $0.683 392,569.3
7
5 $603,499 $0.621 374,725.3
1
Total Cash Flow $2,743,476 2,060,768.5
7
Property Resale @
Cap Rate
$5,029,157.11
Less Adjustments $100,583
Net Resale Cash
Flow
$4,928,574 $0.621 3,060,256.6
7
Total Property
Present Value
5,12
1,025.24
The price of the property assumed to be brought at $3,950,000 will give the investor a net
present value of $1,171,030.48. Thus, investment in the property will give the investor
significant return provided underlying conditions remain more or less same (Wang & Wu, 2018).

18
FINANCIAL MODELLING
Optimizing using excel:
Tenant
Year 1 Year 2 Year 3 Year 4 Year 5
For Yr. Ending Dec-19 Dec-20 Dec-21 Dec-22 Dec-23
Revenue from rent $525,000 $551,250 $578,813 $607,753 $638,141
Less Absorption &
Turnover Vac.
$0 $0 $0 $0 $0
Gross rent $525,000 $551,250 $578,813 $607,753 $638,141
Expense Reimbursement
Rev.
$48,250 $50,200 $52,248 $54,397 $56,655
Total Potential Gross
Revenue
$573,250 $601,450 $631,060 $662,151 $694,796
Leasing and Capital
Costs
Tenant Improvements 22500 23400 24336 25309.44 26321.8176
Paraphrase This Document
Need a fresh take? Get an instant paraphrase of this document with our AI Paraphraser

19
FINANCIAL MODELLING
Total Potential Net Cash
Flow
$550,750 $578,050 $606,724 $636,841 $668,474
Tennant related expenses
Year 1 Year 2 Year 3 Year 4 Year 5
For Yr. Ending Dec-19 Dec-20 Dec-21 Dec-22 Dec-23
Reimbursable Expenses:
Common Area
Maintenance
$15,000 $15,750 $16,538 $17,364 $18,233
Ad Valorem Tax (Fixed) $1,750 $1,750 $1,750 $1,750 $1,750
Property Insurance (Fixed) $7,500 $7,500 $7,500 $7,500 $7,500
Utilities $22,500 $23,625 $24,806 $26,047 $27,349
Administrative Expense $1,500 $1,575 $1,654 $1,736 $1,823
Revenue from
Reimbursement
$48,250 $50,200 $52,248 $54,397 $56,655

20
FINANCIAL MODELLING
Total Reimbursement Revenue $48,250 $50,200 $52,248 $54,397 $56,655
Non-reimbursable
Expenses
Management fee $9,000 $9,450.0
0
$9,922.5
0
$10,418.6
3
$10,939.5
6
Year 1 Year 2 Year 3 Year 4 Year 5
Year ending Dec-19 Dec-20 Dec-21 Dec-22 Dec-23
Gross revenue (Expected)
Revenue from rental $525,000 $551,250 $578,813 $607,753 $638,141
Less: Loss due to absorption &
Turnover Vac.
$0 $0 $0 $0 $0
Net rent receivable $525,000 $551,250 $578,813 $607,753 $638,141
Total Reimbursement Revenue $48,250 $50,200 $52,248 $54,397 $56,655

21
FINANCIAL MODELLING
Effective Gross Revenue
receivable
$573,250 $601,450 $631,060 $662,151 $694,796
Operating Expenses
Reimbursable Expenses
Common Area Maintenance $15,000 $15,750 $16,538 $17,364 $18,233
Ad Valorem Tax $1,750 $1,750 $1,750 $1,750 $1,750
Property Insurance $7,500 $7,500 $7,500 $7,500 $7,500
Utilities $22,500 $23,625 $24,806 $26,047 $27,349
Administrative Expense $1,500 $1,575 $1,654 $1,736 $1,823
Non-reimbursable
Expenses
Management $10,500.
00
$11,025.
00
$11,576.
25
$12,155.
06
$12,762.
82
Total Operating Expenses $58,750 $61,225 $63,824 $66,552 $69,418
Net Operating Income $514,500 $540,225 $567,236 $595,598 $625,378
Secure Best Marks with AI Grader
Need help grading? Try our AI Grader for instant feedback on your assignments.

22
FINANCIAL MODELLING
Capital cost
Tenant Improvements $18,000 $18,900 $19,845 $20,837 $21,879
Total Capital Costs $18,000 $18,900 $19,845 $20,837 $21,879
Net cash flow after meeting
all expenditures
$496,500 $521,325 $547,391 $574,761 $603,499
Net present value:
Prospective Present Value
Calculation of net present value (NPV)
Year Annual net
cash inflow
Present value
factor @10%
pa
Present Value of
Cash Flow @ 10%
pa
1 $496,500 $0.909 451,

23
FINANCIAL MODELLING
363.64
2 $521,325 $0.826 430,
847.11
3 $547,391 $0.751 411,
263.15
4 $574,761 $0.683 392,
569.37
5 $603,499 $0.621 374,
725.31
Total Cash Flow $2,743,476 2,060
,768.57
Property Resale @ Cap Rate $5,029,157.11
Less Adjustments $100,583
Net Resale Cash Flow $4,928,574 $0.621 3,060
,256.67
Total Property Present Value 5,1
21,025.24

24
FINANCIAL MODELLING
Rounded to Thousands (use a
formula)
5,1
21,030.48
Less: Property purchase value in
2011 (last time the property sold)
3,9
50,000.00
Net present value (NPV) 1,17
1,030.48
Internal rate of return:
Internal rate of return (IRR)
Particulars Amount ($)
Initial investment 3,950,000.0
0
Year Annual net cash inflows
($)
1 583,965.
00
2 585,210.
Paraphrase This Document
Need a fresh take? Get an instant paraphrase of this document with our AI Paraphraser

25
FINANCIAL MODELLING
58
3 608,640.
48
4 633,007.
58
5 658,349.
37
Calculation of IRR
Year Annual net cash inflows
($)
0 (3,950,000.
00)
1 583,965.
00
2 585,210.
58
3 608,640.
48
4 633,007.
FINANCIAL MODELLING
58
3 608,640.
48
4 633,007.
58
5 658,349.
37
Calculation of IRR
Year Annual net cash inflows
($)
0 (3,950,000.
00)
1 583,965.
00
2 585,210.
58
3 608,640.
48
4 633,007.

26
FINANCIAL MODELLING
58
5 658,349.
37
IRR (7.71%)
Why financial modelling helps:
The advantage of financial modelling can be easily understood from the detail sensitivity and
simulation analyses of the investment proposal situated in 104 Lake Popular Street in White City
conducted above. It is clear from the above calculations that the impact of changes in underlying
variables and market conditions on the outcome of an investment proposal is measured by
financial modelling. Thus, financial modelling helps investors to pre-empt the possible outcomes
or results of investment proposals in case there is any change to the underlying conditions. As a
result the investors would be better positioned to absorb the risks by preparing for different
market conditions. Thus, in short financial modeling will help the investors to take better
investment decisions by conducting detailed analyses of possible results of different investment
options by changing underlying variables and market conditions.
CAPM Model illustration:
CAPM model helps in determining the cost of capital or rate of return on investment which is
used to discount the future cash inflows to appraise the investment options for investors. CAPM
model uses the following formula to calculate the expected rate of return:
{Risk free rate of return + (Beta x Risk premium)}

27
FINANCIAL MODELLING
In this case the standard rate of return on investment has been assumed at 10% and senility
analyses have shown the significant impact of the rate of return on the NPV of an investment
project (Cornell, 2016).
FINANCIAL MODELLING
In this case the standard rate of return on investment has been assumed at 10% and senility
analyses have shown the significant impact of the rate of return on the NPV of an investment
project (Cornell, 2016).
Secure Best Marks with AI Grader
Need help grading? Try our AI Grader for instant feedback on your assignments.

28
FINANCIAL MODELLING
References:
Cornell, B. (2016). Capital Budgeting: A 'General Equilibrium' Analysis. SSRN Electronic
Journal, 2(2), 123-324. doi: 10.2139/ssrn.2510874
Srithongrung, A. (2017). Capital Budgeting and Management Practices: Smoothing Out Rough
Spots in Government Outlays. Public Budgeting & Finance, 38(1), 47-71. doi:
10.1111/pbaf.12167
Wang, W., & Wu, Y. (2018). Why Are We Lagging Behind? An Empirical Analysis of
Municipal Capital Spending in the United States. Public Budgeting & Finance, 38(3), 76-
91. doi: 10.1111/pbaf.12193
1 out of 29
Related Documents

Your All-in-One AI-Powered Toolkit for Academic Success.
 +13062052269
info@desklib.com
Available 24*7 on WhatsApp / Email
Unlock your academic potential
© 2024  |  Zucol Services PVT LTD  |  All rights reserved.