Managing Financial Resources: Investment Appraisal for PNJ Ltd
VerifiedAdded on 2023/04/22
|26
|5014
|487
Report
AI Summary
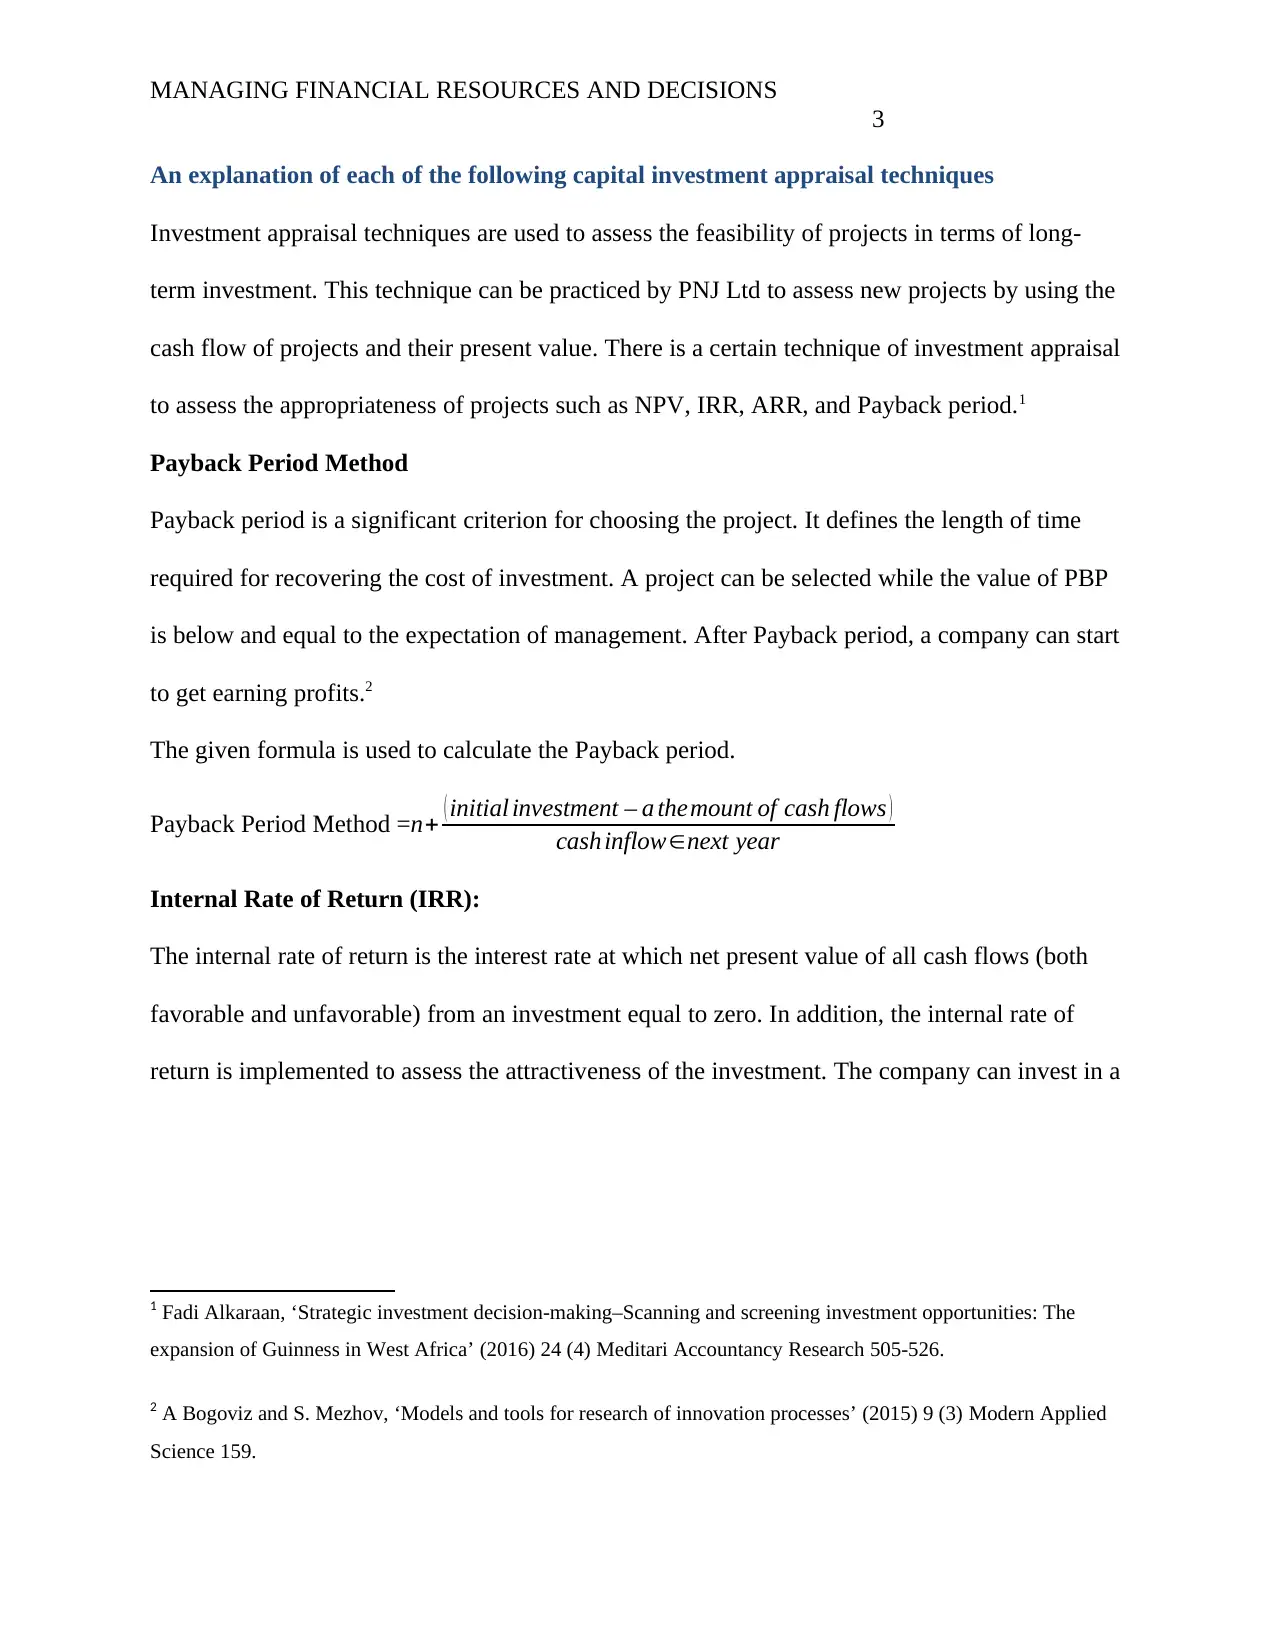
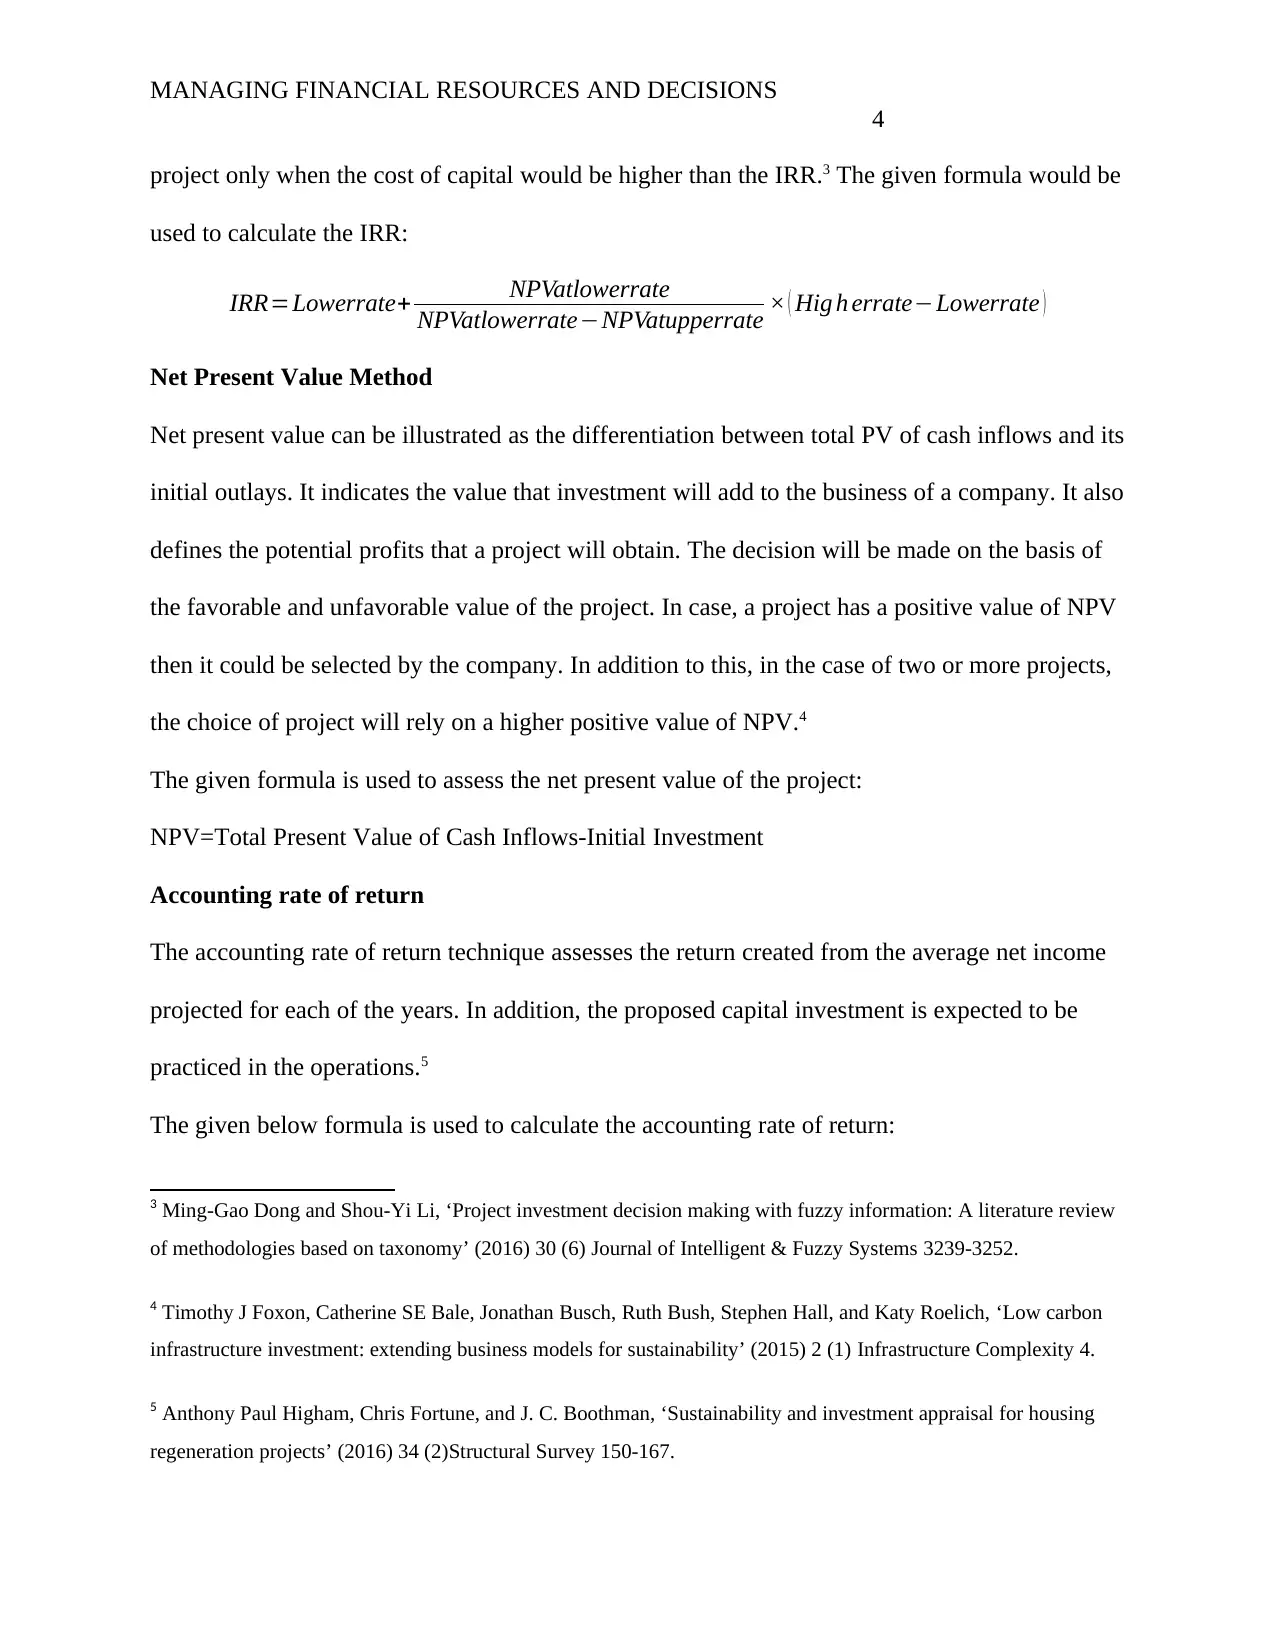
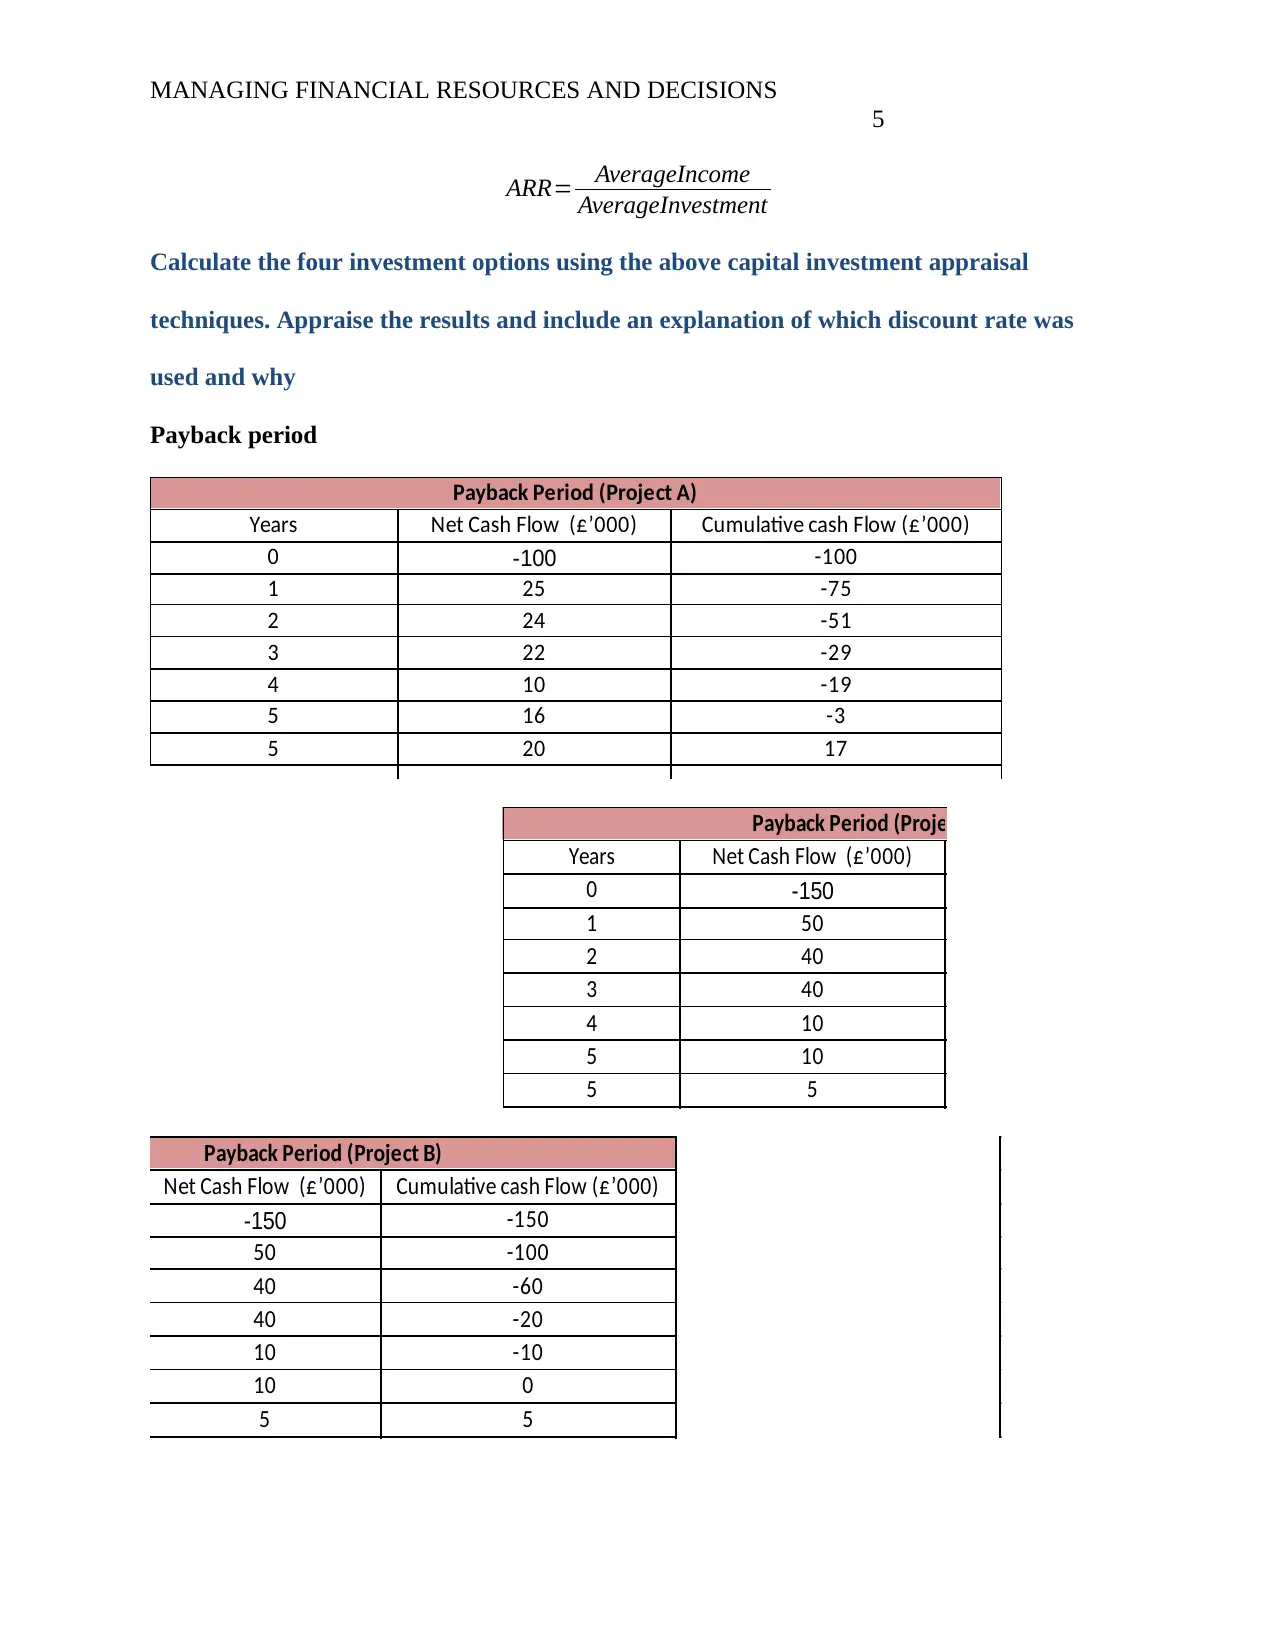
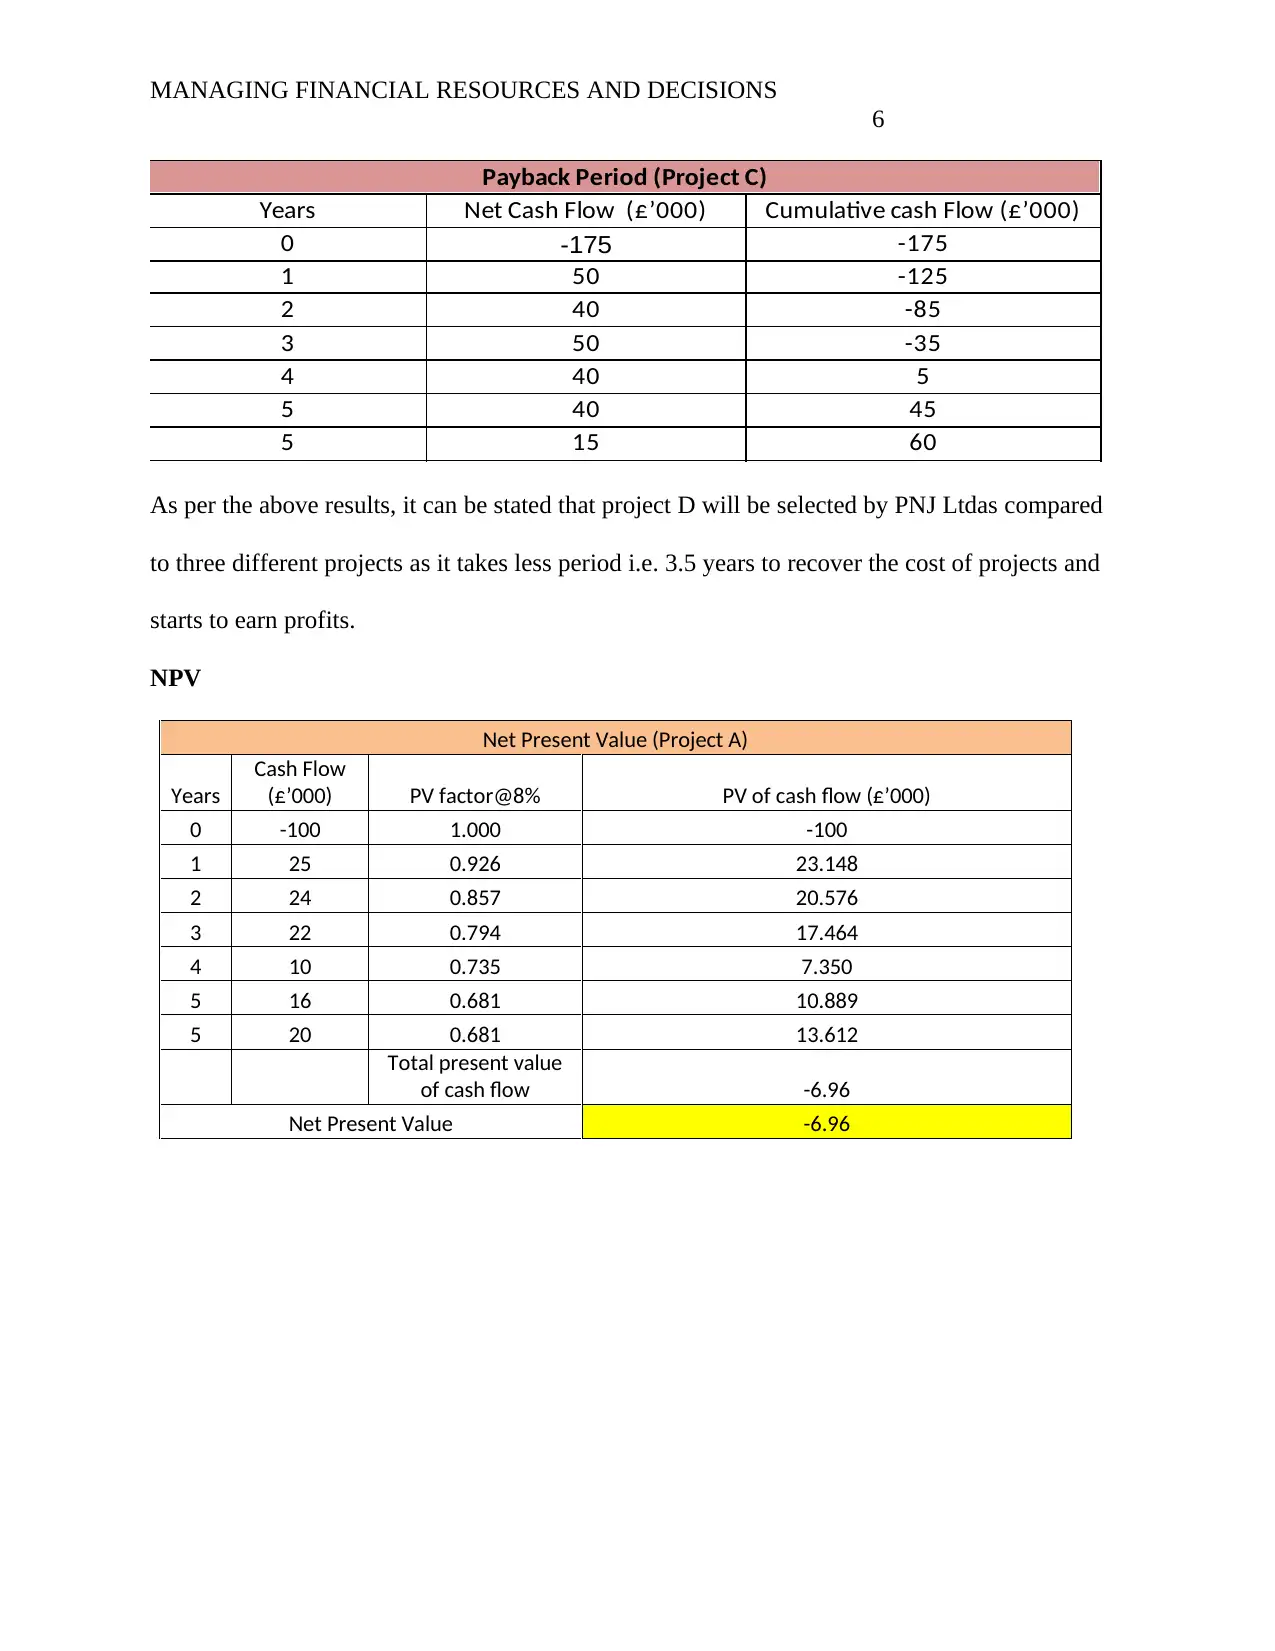
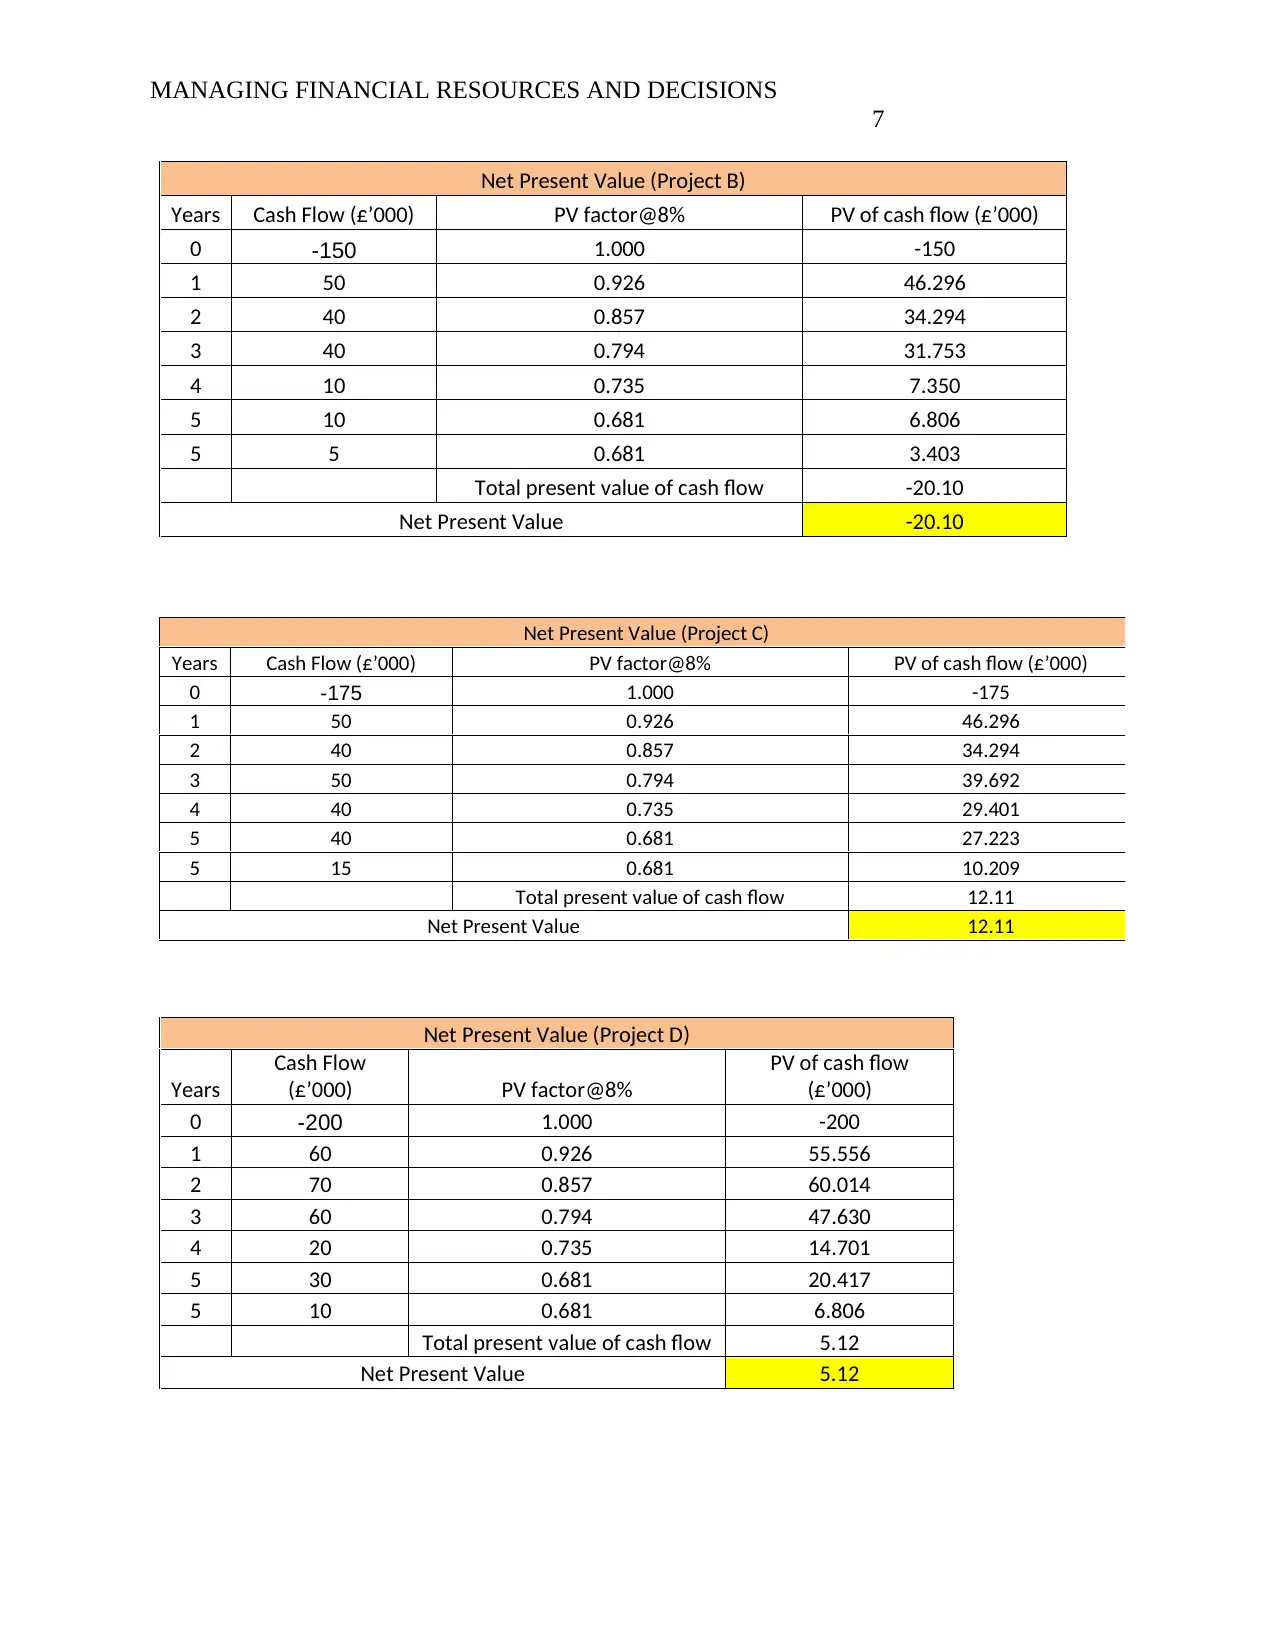
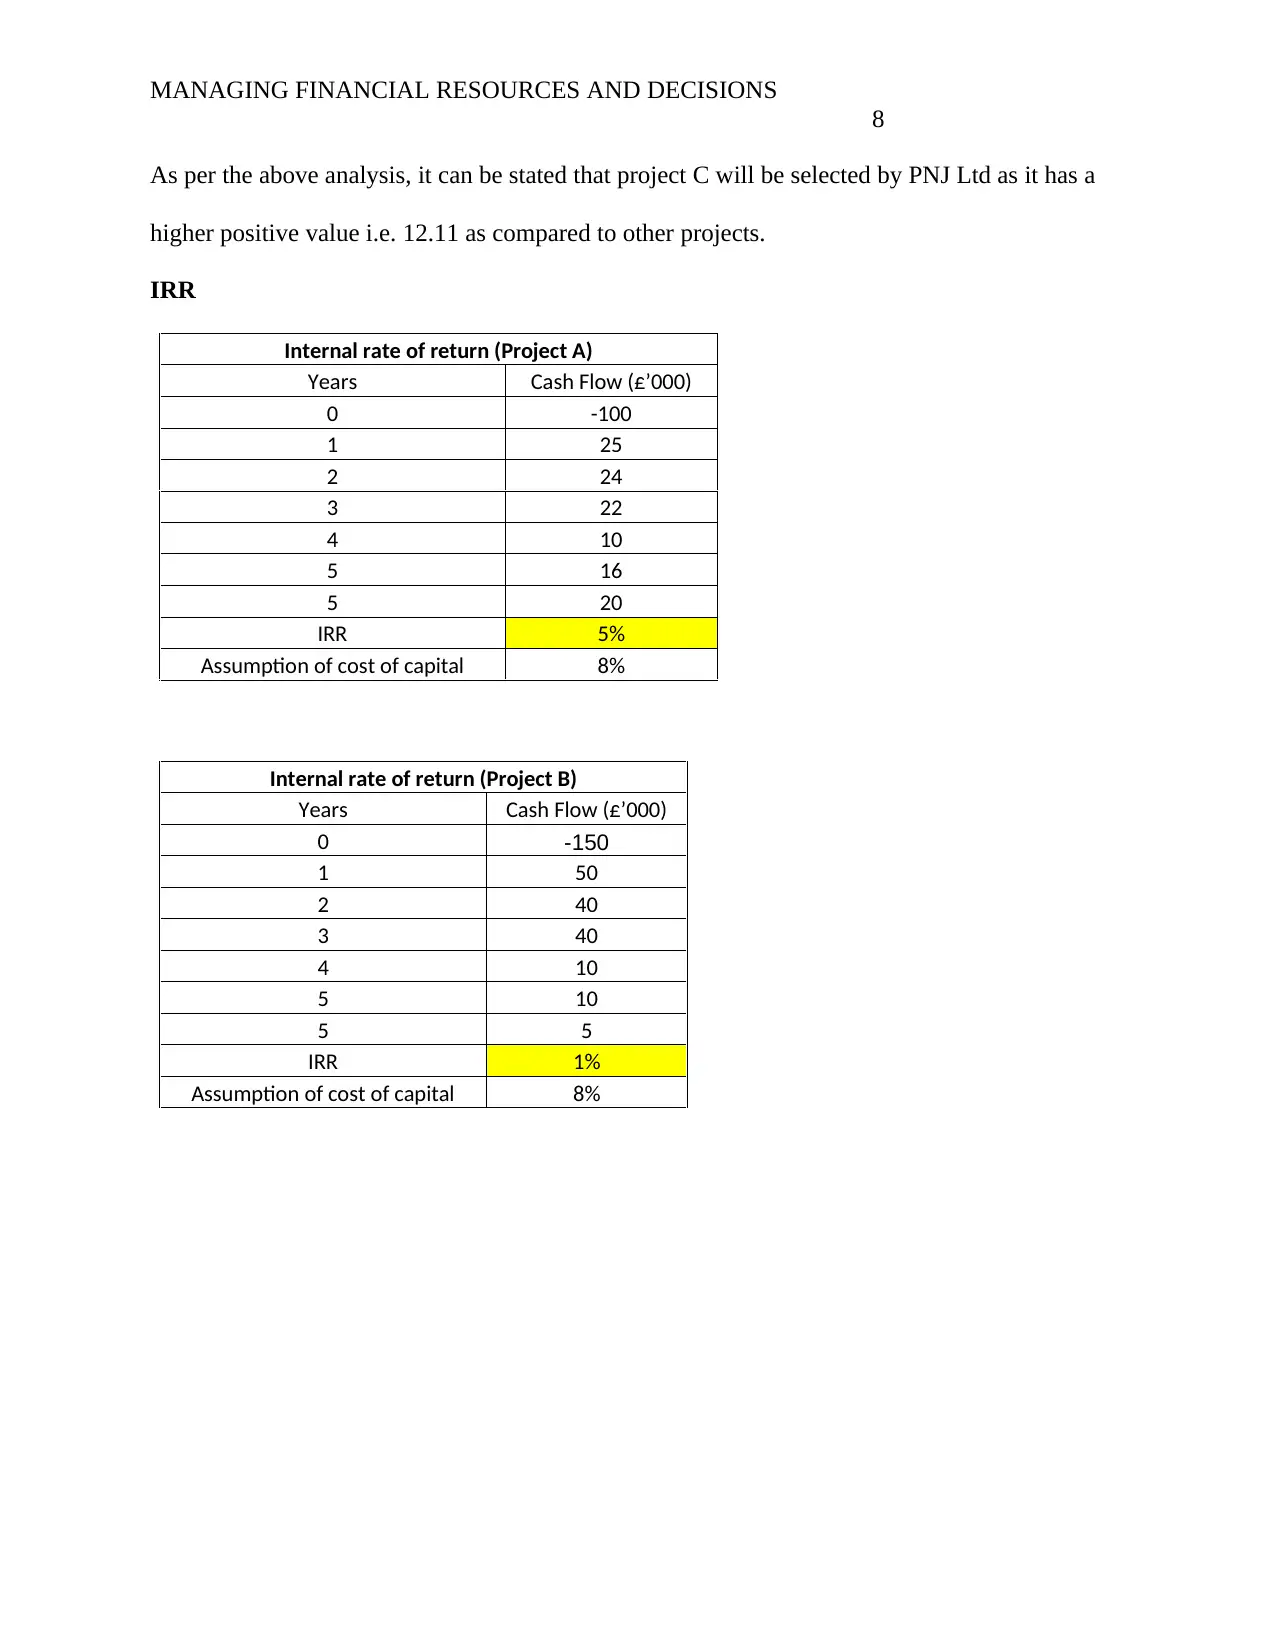
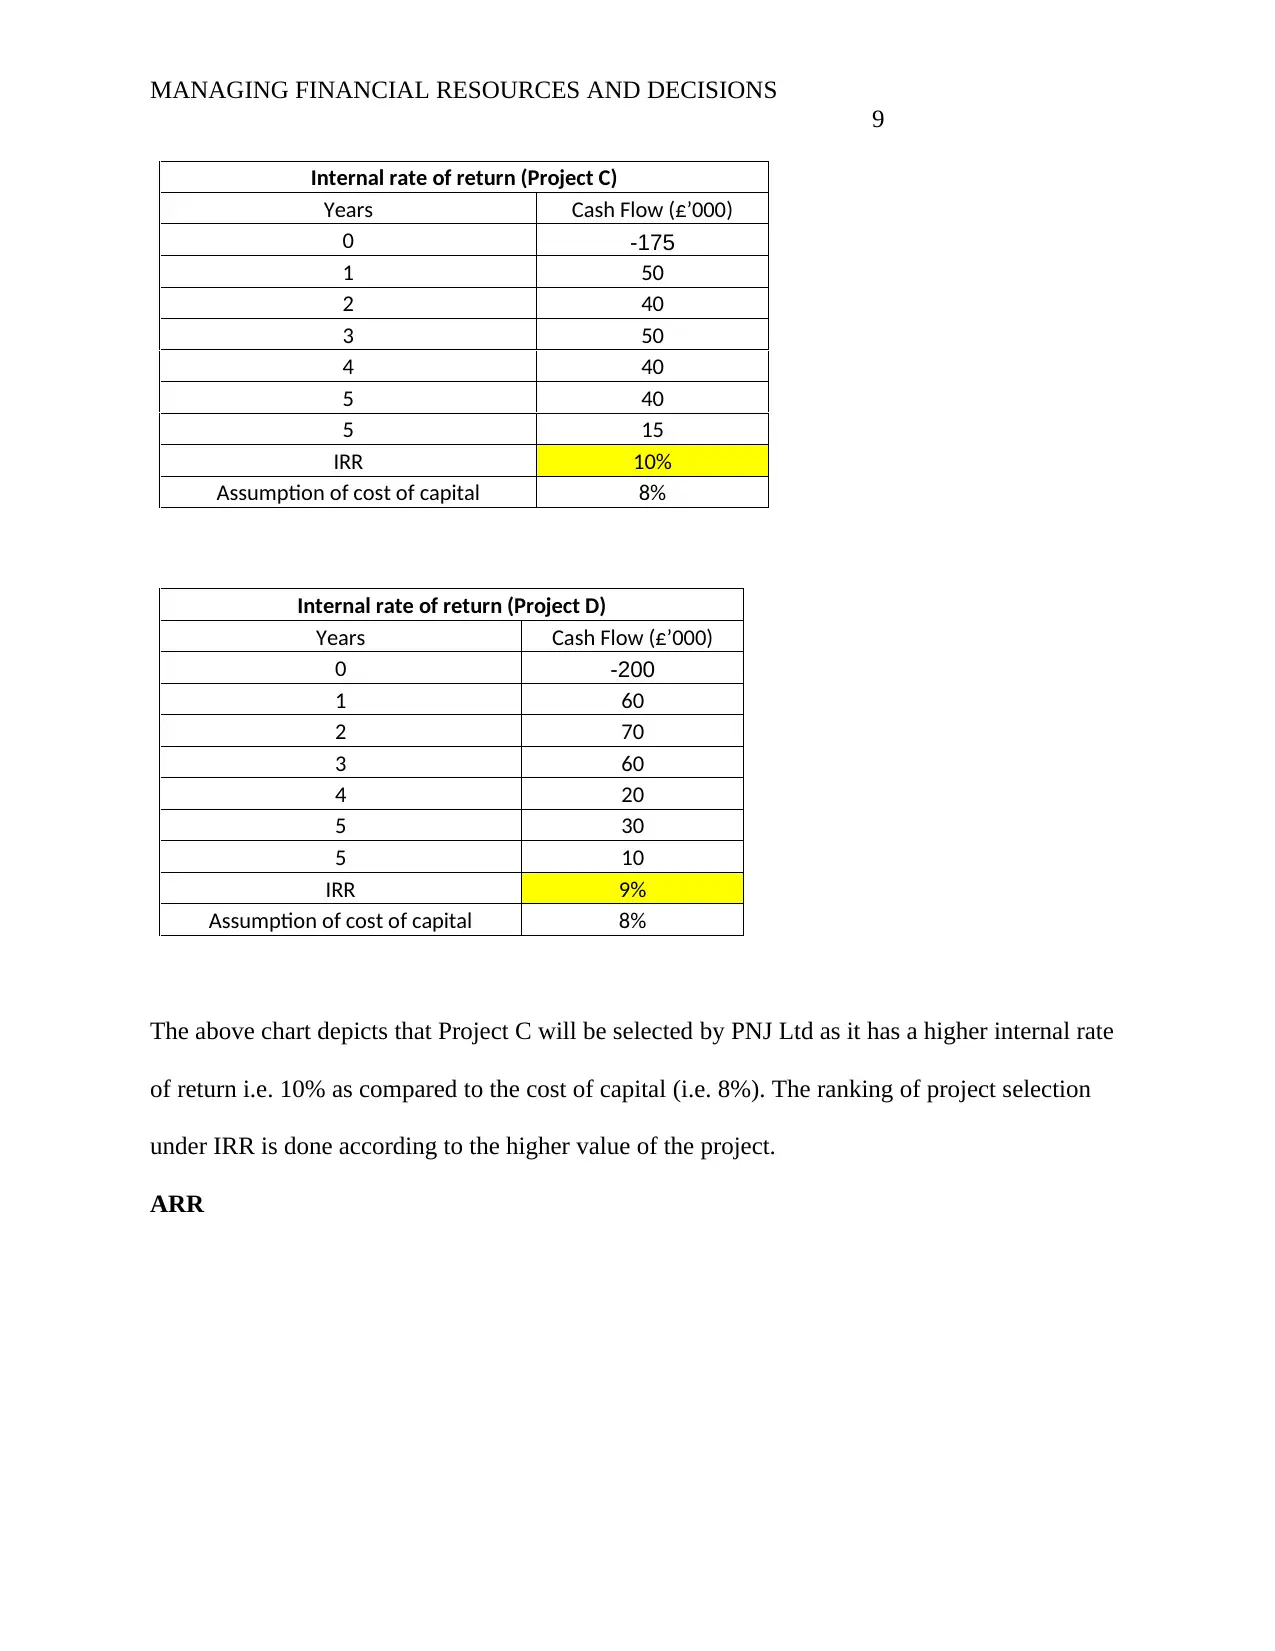
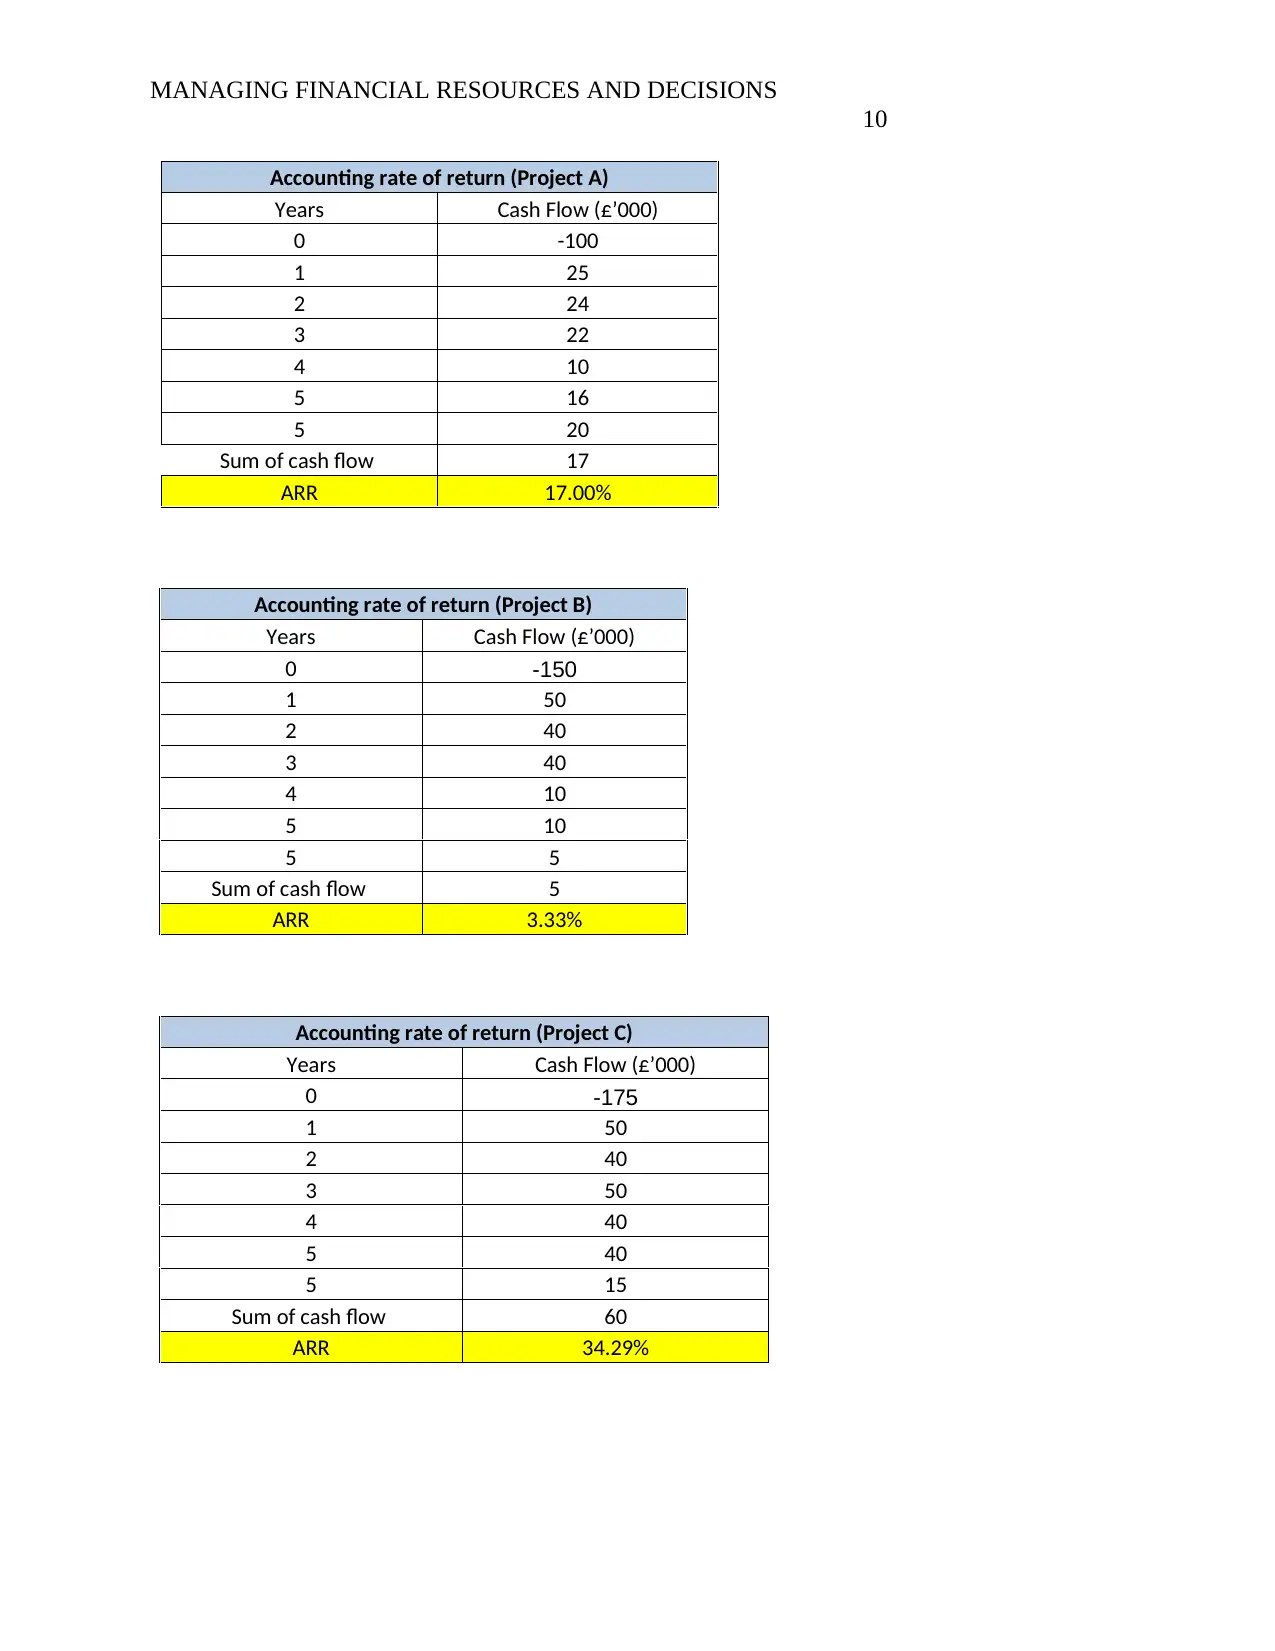
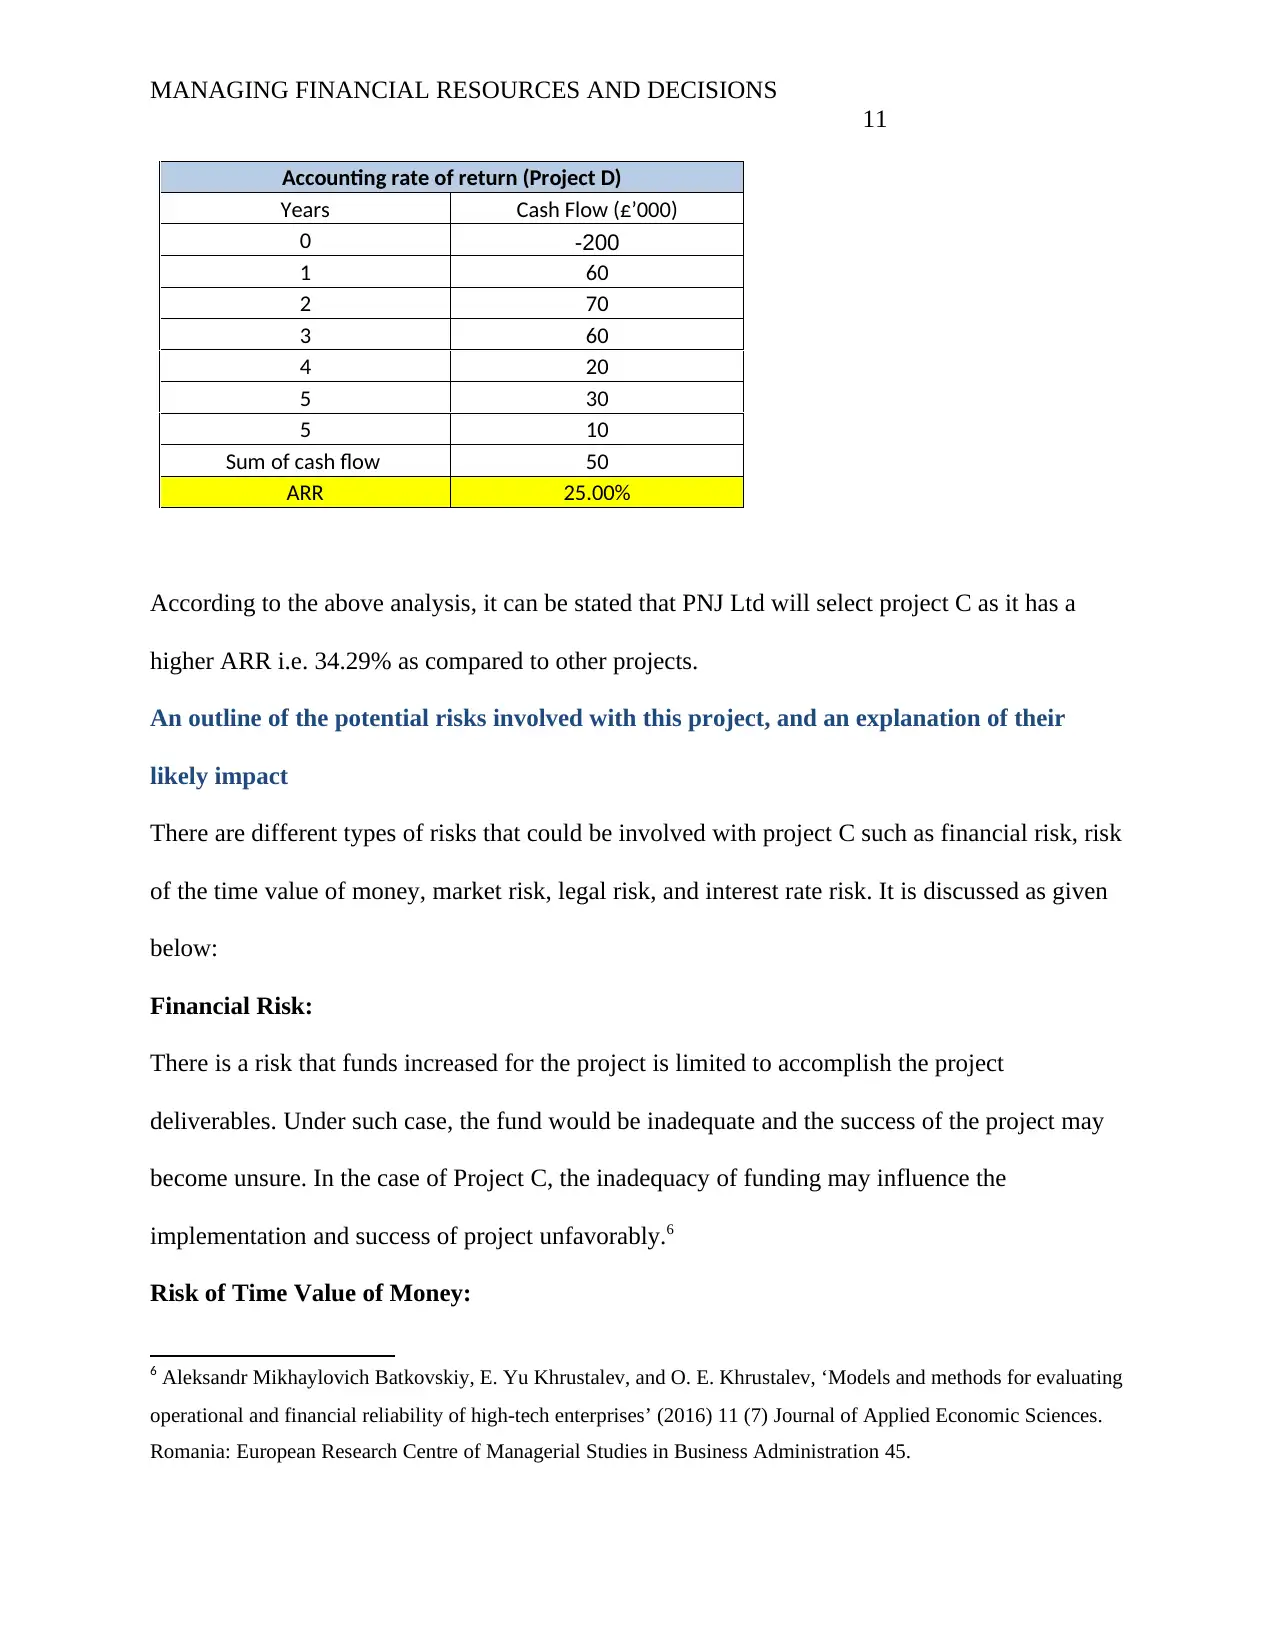
This report assesses capital investment appraisal techniques for PNJ Ltd, a wood products company evaluating replacement equipment. It explains and applies methods like Payback Period, Internal Rate of Return (IRR), Net Present Value (NPV), and Accounting Rate of Return (ARR) to four potential investment options (Projects A, B, C, and D). The analysis includes calculations and appraisals of each project, highlighting the discount rate used and its rationale. Furthermore, the report outlines potential risks associated with Project C, such as financial, market, legal, and interest rate risks, and their likely impact on management. Finally, it summarizes possible sources of funding for the project, detailing the advantages and disadvantages of each option. The document is available on Desklib, a platform offering study tools and solved assignments for students.

Running head: MANAGING FINANCIAL RESOURCES AND DECISION
Managing Financial Resources and
Decisions
Managing Financial Resources and
Decisions
Paraphrase This Document
Need a fresh take? Get an instant paraphrase of this document with our AI Paraphraser

MANAGING FINANCIAL RESOURCES AND DECISIONS
2
Table of Contents
An explanation of each of the following capital investment appraisal techniques..........................3
Calculate the four investment options using the above capital investment appraisal techniques.
Appraise the results and include an explanation of which discount rate was used and why...........5
An outline of the potential risks involved with this project, and an explanation of their likely
impact............................................................................................................................................11
A summary of possible sources of funding for the project, outlining the advantages and
disadvantages of each....................................................................................................................14
Bibliography..................................................................................................................................17
Appendices....................................................................................................................................19

MANAGING FINANCIAL RESOURCES AND DECISIONS
3
An explanation of each of the following capital investment appraisal techniques
Investment appraisal techniques are used to assess the feasibility of projects in terms of long-
term investment. This technique can be practiced by PNJ Ltd to assess new projects by using the
cash flow of projects and their present value. There is a certain technique of investment appraisal
to assess the appropriateness of projects such as NPV, IRR, ARR, and Payback period.1
Payback Period Method
Payback period is a significant criterion for choosing the project. It defines the length of time
required for recovering the cost of investment. A project can be selected while the value of PBP
is below and equal to the expectation of management. After Payback period, a company can start
to get earning profits.2
The given formula is used to calculate the Payback period.
Payback Period Method =n+ ( initial investment – a themount of cash flows )
cash inflow∈next year
Internal Rate of Return (IRR):
The internal rate of return is the interest rate at which net present value of all cash flows (both
favorable and unfavorable) from an investment equal to zero. In addition, the internal rate of
return is implemented to assess the attractiveness of the investment. The company can invest in a
1 Fadi Alkaraan, ‘Strategic investment decision-making–Scanning and screening investment opportunities: The
expansion of Guinness in West Africa’ (2016) 24 (4) Meditari Accountancy Research 505-526.
2 A Bogoviz and S. Mezhov, ‘Models and tools for research of innovation processes’ (2015) 9 (3) Modern Applied
Science 159.
⊘ This is a preview!⊘
Do you want full access?
Subscribe today to unlock all pages.

Trusted by 1+ million students worldwide

MANAGING FINANCIAL RESOURCES AND DECISIONS
4
project only when the cost of capital would be higher than the IRR.3 The given formula would be
used to calculate the IRR:
IRR=Lowerrate+ NPVatlowerrate
NPVatlowerrate−NPVatupperrate × ( Hig h errate−Lowerrate )
Net Present Value Method
Net present value can be illustrated as the differentiation between total PV of cash inflows and its
initial outlays. It indicates the value that investment will add to the business of a company. It also
defines the potential profits that a project will obtain. The decision will be made on the basis of
the favorable and unfavorable value of the project. In case, a project has a positive value of NPV
then it could be selected by the company. In addition to this, in the case of two or more projects,
the choice of project will rely on a higher positive value of NPV.4
The given formula is used to assess the net present value of the project:
NPV=Total Present Value of Cash Inflows-Initial Investment
Accounting rate of return
The accounting rate of return technique assesses the return created from the average net income
projected for each of the years. In addition, the proposed capital investment is expected to be
practiced in the operations.5
The given below formula is used to calculate the accounting rate of return:
3 Ming-Gao Dong and Shou-Yi Li, ‘Project investment decision making with fuzzy information: A literature review
of methodologies based on taxonomy’ (2016) 30 (6) Journal of Intelligent & Fuzzy Systems 3239-3252.
4 Timothy J Foxon, Catherine SE Bale, Jonathan Busch, Ruth Bush, Stephen Hall, and Katy Roelich, ‘Low carbon
infrastructure investment: extending business models for sustainability’ (2015) 2 (1) Infrastructure Complexity 4.
5 Anthony Paul Higham, Chris Fortune, and J. C. Boothman, ‘Sustainability and investment appraisal for housing
regeneration projects’ (2016) 34 (2)Structural Survey 150-167.
Paraphrase This Document
Need a fresh take? Get an instant paraphrase of this document with our AI Paraphraser

MANAGING FINANCIAL RESOURCES AND DECISIONS
5
ARR= AverageIncome
AverageInvestment
Calculate the four investment options using the above capital investment appraisal
techniques. Appraise the results and include an explanation of which discount rate was
used and why
Payback period
Payback Period (Project A)
Years Net Cash Flow (£’000) Cumulative cash Flow (£’000)
0 -100 -100
1 25 -75
2 24 -51
3 22 -29
4 10 -19
5 16 -3
5 20 17
Payback Period (Project B)
Years Net Cash Flow (£’000)
0 -150
1 50
2 40
3 40
4 10
5 10
5 5
Payback Period (Project B)
Net Cash Flow (£’000) Cumulative cash Flow (£’000)
-150 -150
50 -100
40 -60
40 -20
10 -10
10 0
5 5

MANAGING FINANCIAL RESOURCES AND DECISIONS
6
Payback Period (Project C)
Years Net Cash Flow (£’000) Cumulative cash Flow (£’000)
0 -175 -175
1 50 -125
2 40 -85
3 50 -35
4 40 5
5 40 45
5 15 60
As per the above results, it can be stated that project D will be selected by PNJ Ltdas compared
to three different projects as it takes less period i.e. 3.5 years to recover the cost of projects and
starts to earn profits.
NPV
Net Present Value (Project A)
Years
Cash Flow
(£’000) PV factor@8% PV of cash flow (£’000)
0 -100 1.000 -100
1 25 0.926 23.148
2 24 0.857 20.576
3 22 0.794 17.464
4 10 0.735 7.350
5 16 0.681 10.889
5 20 0.681 13.612
Total present value
of cash flow -6.96
Net Present Value -6.96
⊘ This is a preview!⊘
Do you want full access?
Subscribe today to unlock all pages.

Trusted by 1+ million students worldwide

MANAGING FINANCIAL RESOURCES AND DECISIONS
7
Net Present Value (Project B)
Years Cash Flow (£’000) PV factor@8% PV of cash flow (£’000)
0 -150 1.000 -150
1 50 0.926 46.296
2 40 0.857 34.294
3 40 0.794 31.753
4 10 0.735 7.350
5 10 0.681 6.806
5 5 0.681 3.403
Total present value of cash flow -20.10
Net Present Value -20.10
Net Present Value (Project C)
Years Cash Flow (£’000) PV factor@8% PV of cash flow (£’000)
0 -175 1.000 -175
1 50 0.926 46.296
2 40 0.857 34.294
3 50 0.794 39.692
4 40 0.735 29.401
5 40 0.681 27.223
5 15 0.681 10.209
Total present value of cash flow 12.11
Net Present Value 12.11
Net Present Value (Project D)
Years
Cash Flow
(£’000) PV factor@8%
PV of cash flow
(£’000)
0 -200 1.000 -200
1 60 0.926 55.556
2 70 0.857 60.014
3 60 0.794 47.630
4 20 0.735 14.701
5 30 0.681 20.417
5 10 0.681 6.806
Total present value of cash flow 5.12
Net Present Value 5.12
Paraphrase This Document
Need a fresh take? Get an instant paraphrase of this document with our AI Paraphraser

MANAGING FINANCIAL RESOURCES AND DECISIONS
8
As per the above analysis, it can be stated that project C will be selected by PNJ Ltd as it has a
higher positive value i.e. 12.11 as compared to other projects.
IRR
Internal rate of return (Project A)
Years Cash Flow (£’000)
0 -100
1 25
2 24
3 22
4 10
5 16
5 20
IRR 5%
Assumption of cost of capital 8%
Internal rate of return (Project B)
Years Cash Flow (£’000)
0 -150
1 50
2 40
3 40
4 10
5 10
5 5
IRR 1%
Assumption of cost of capital 8%

MANAGING FINANCIAL RESOURCES AND DECISIONS
9
Internal rate of return (Project C)
Years Cash Flow (£’000)
0 -175
1 50
2 40
3 50
4 40
5 40
5 15
IRR 10%
Assumption of cost of capital 8%
Internal rate of return (Project D)
Years Cash Flow (£’000)
0 -200
1 60
2 70
3 60
4 20
5 30
5 10
IRR 9%
Assumption of cost of capital 8%
The above chart depicts that Project C will be selected by PNJ Ltd as it has a higher internal rate
of return i.e. 10% as compared to the cost of capital (i.e. 8%). The ranking of project selection
under IRR is done according to the higher value of the project.
ARR
⊘ This is a preview!⊘
Do you want full access?
Subscribe today to unlock all pages.

Trusted by 1+ million students worldwide

MANAGING FINANCIAL RESOURCES AND DECISIONS
10
Accounting rate of return (Project A)
Years Cash Flow (£’000)
0 -100
1 25
2 24
3 22
4 10
5 16
5 20
Sum of cash flow 17
ARR 17.00%
Accounting rate of return (Project B)
Years Cash Flow (£’000)
0 -150
1 50
2 40
3 40
4 10
5 10
5 5
Sum of cash flow 5
ARR 3.33%
Accounting rate of return (Project C)
Years Cash Flow (£’000)
0 -175
1 50
2 40
3 50
4 40
5 40
5 15
Sum of cash flow 60
ARR 34.29%
Paraphrase This Document
Need a fresh take? Get an instant paraphrase of this document with our AI Paraphraser

MANAGING FINANCIAL RESOURCES AND DECISIONS
11
Accounting rate of return (Project D)
Years Cash Flow (£’000)
0 -200
1 60
2 70
3 60
4 20
5 30
5 10
Sum of cash flow 50
ARR 25.00%
According to the above analysis, it can be stated that PNJ Ltd will select project C as it has a
higher ARR i.e. 34.29% as compared to other projects.
An outline of the potential risks involved with this project, and an explanation of their
likely impact
There are different types of risks that could be involved with project C such as financial risk, risk
of the time value of money, market risk, legal risk, and interest rate risk. It is discussed as given
below:
Financial Risk:
There is a risk that funds increased for the project is limited to accomplish the project
deliverables. Under such case, the fund would be inadequate and the success of the project may
become unsure. In the case of Project C, the inadequacy of funding may influence the
implementation and success of project unfavorably.6
Risk of Time Value of Money:
6 Aleksandr Mikhaylovich Batkovskiy, E. Yu Khrustalev, and O. E. Khrustalev, ‘Models and methods for evaluating
operational and financial reliability of high-tech enterprises’ (2016) 11 (7) Journal of Applied Economic Sciences.
Romania: European Research Centre of Managerial Studies in Business Administration 45.

MANAGING FINANCIAL RESOURCES AND DECISIONS
12
The time value of money defines that the value of money of current times will not remain the
same after two or more ages. It indicates the value of money is depleted over time. In addition,
time value of money may affect the future cash flows of the project in a negative way. Hence, it
is required for the project manager to focus on the time value of money in making a decision of
investment.7
Market Risk:
The accomplishment of project C would rely on different external market factors such as high
rivalry, changes in demand, suppliers unable to supplied expected products and services, and the
emergence of a price war.8
Legal Risk:
The legal risk could be arisen in project C due to changes in regulatory and legal regulation and
policies in a nation. For instance, a legal ban on sand mining is a key example of a legal risk that
may affect the construction projects unfavorably in different nations. 9
Interest Rate Risk:
The rate of interest of a nation changes with the alteration in government policies such as
monetary and fiscal regulations. The high-interest rate may unfavorably influence the cost of
7 Moataz Moamen Elmassri, Elaine Pamela Harris, and David Bernard Carter, ‘Accounting for strategic investment
decision-making under extreme uncertainty’ (2016) 48 (2) The British Accounting Review 151-168.
8 Matteo Rossi, ‘The use of capital budgeting techniques: an outlook from Italy’ (2015) 8 (1) International Journal of
Management Practice 43-56.
9 M. V. Shivaani, P. K. Jain, and Surendra S. Yadav, ‘Perceptual Mapping of Capital Budgeting Techniques:
Empirical Evidence from Corporate Enterprises in India’ (2017) 42 (4) Research Bulletin 106-112.
⊘ This is a preview!⊘
Do you want full access?
Subscribe today to unlock all pages.

Trusted by 1+ million students worldwide
1 out of 26
Related Documents
Your All-in-One AI-Powered Toolkit for Academic Success.
+13062052269
info@desklib.com
Available 24*7 on WhatsApp / Email
Unlock your academic potential
Copyright © 2020–2025 A2Z Services. All Rights Reserved. Developed and managed by ZUCOL.


