Glyndwr Marketing Ltd: Investment Appraisal Techniques Report

Verified

Added on  2022/08/14

|9
|1396
|17
Report
AI Summary
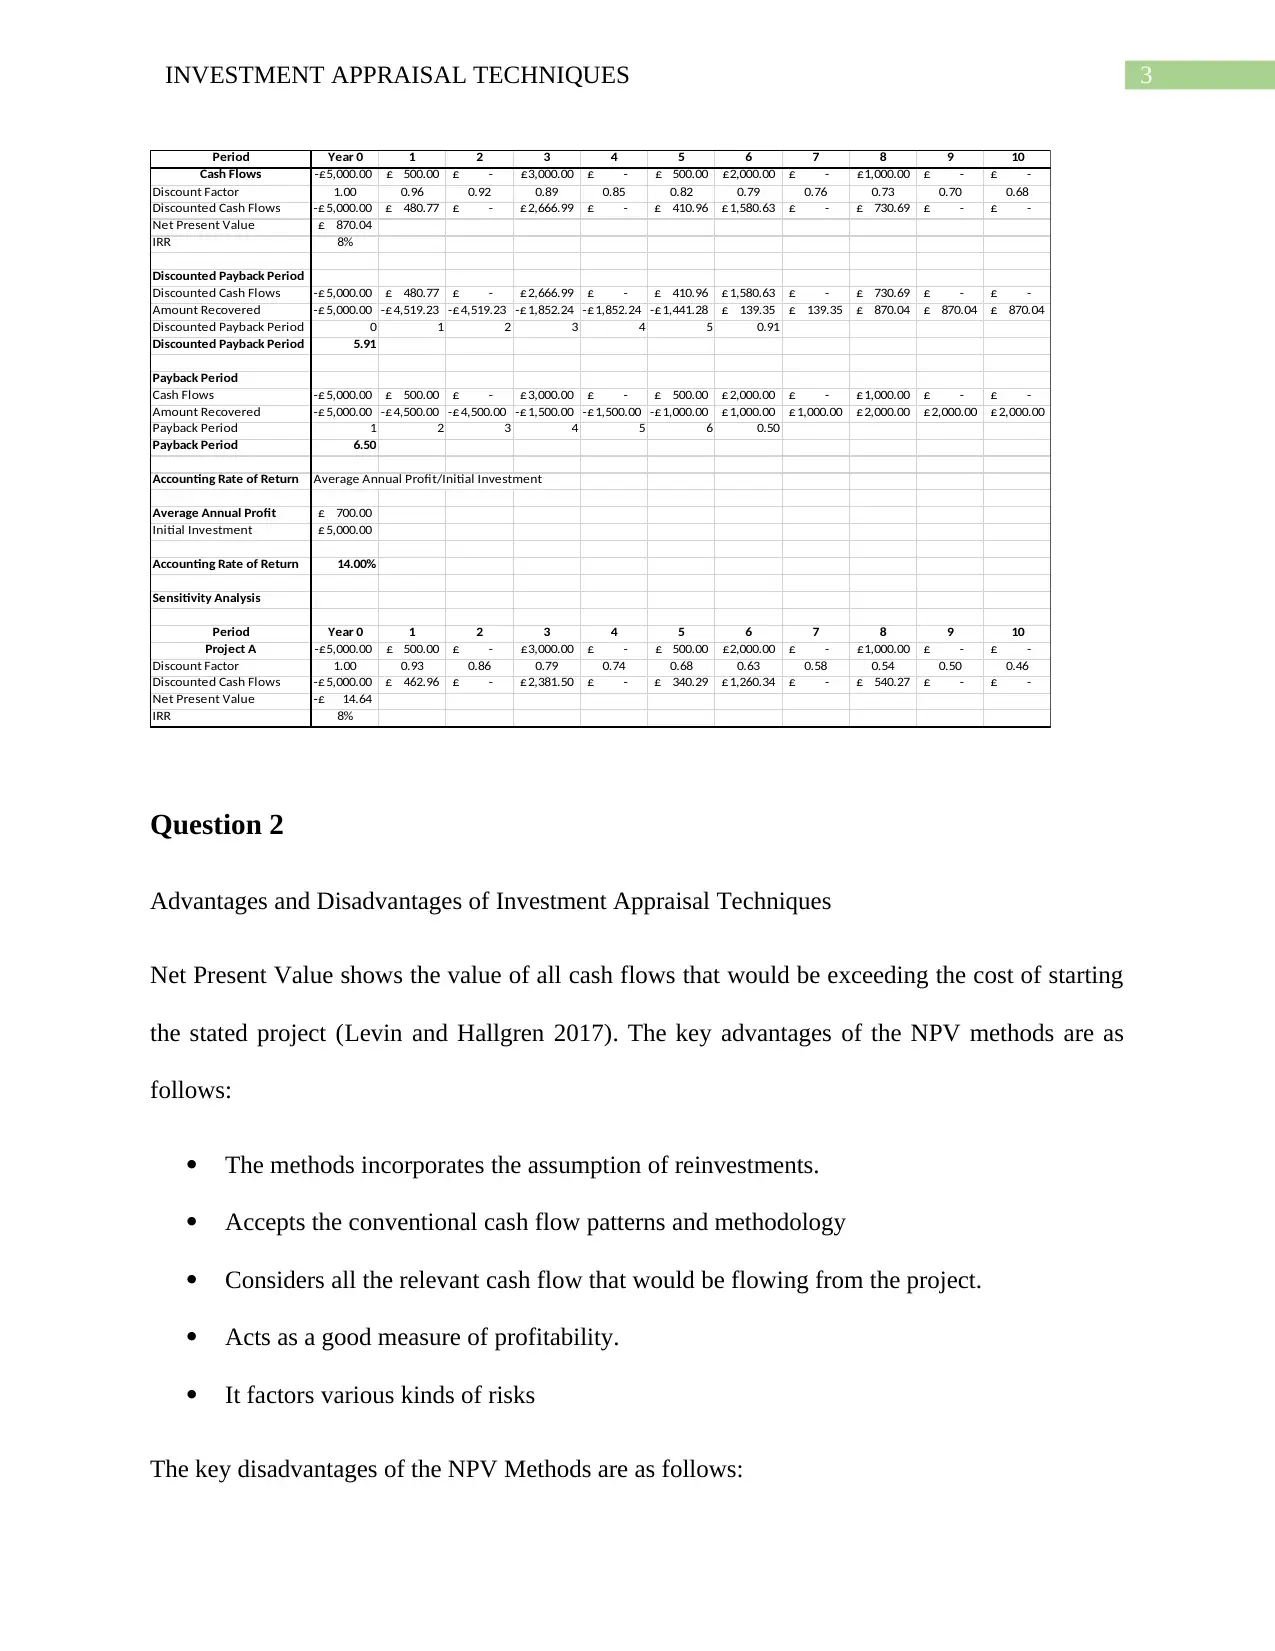
This report provides a detailed analysis of investment appraisal techniques, specifically focusing on projects A and B for Glyndwr Marketing Ltd. The report begins by defining and discussing the advantages and disadvantages of various techniques including Net Present Value (NPV), Internal Rate of Return (IRR), Payback Period, Discounted Payback Period, and Accounting Rate of Return (ARR). It then applies these techniques to evaluate the financial viability of the two projects, comparing their respective NPV, IRR, payback periods, and ARR. Furthermore, the report includes a sensitivity analysis to assess the impact of changes in the discount rate on the project outcomes. The analysis concludes with recommendations on which project offers a better return, considering both financial metrics and risk factors, to maximize investment returns. The report is intended to provide critical advice on the best investment decision for the client.
Document Page
Running head: INVESTMENT APPRAISAL TECHNIQUES
Financial Analysis
Name of the Student:
Name of the University:
Author’s Note:
tabler-icon-diamond-filled.svg

Paraphrase This Document

Need a fresh take? Get an instant paraphrase of this document with our AI Paraphraser
Document Page
1INVESTMENT APPRAISAL TECHNIQUES
Table of Contents
Question 1........................................................................................................................................2
Question 2........................................................................................................................................3
Question 3........................................................................................................................................6
Question 4........................................................................................................................................7
References........................................................................................................................................8
Document Page
2INVESTMENT APPRAISAL TECHNIQUES
Question 1
a) Project A
Period Year 0 1 2 3 4 5 6 7 8 9 10
Cash Flows 5,000.00 700.00£ 800.00£ 900.00£ 1,000.00£ 1,100.00£ 1,200.00£ 1,300.00£ 1,400.00£ 1,500.00£ 1,600.00£
Discount Factor 1.00 0.96 0.92 0.89 0.85 0.82 0.79 0.76 0.73 0.70 0.68
Discounted Cash Flows 5,000.00 673.08£ 739.64£ 800.10£ 854.80£ 904.12£ 948.38£ 987.89£ 1,022.97£ 1,053.88£ 1,080.90£
Net Present Value 4,065.76£
IRR 16%
Discounted Payback Period
Discounted Cash Flows 5,000.00 673.08£ 739.64£ 800.10£ 854.80£ 904.12£ 948.38£ 987.89£ 1,022.97£ 1,053.88£ 1,080.90£
Amount Recovered 5,000.00 4,326.92 3,587.28 2,787.18 1,932.38 1,028.26 79.88 908.01£ 1,930.98£ 2,984.86£ 4,065.76£
Discounted Payback Period 0 1 2 3 4 5 6 0.08
Discounted Payback Period 6.08
Payback Period
Cash Flows 5,000.00 700.00£ 800.00£ 900.00£ 1,000.00£ 1,100.00£ 1,200.00£ 1,300.00£ 1,400.00£ 1,500.00£ 1,600.00£
Amount Recovered 5,000.00 4,300.00 3,500.00 2,600.00 1,600.00 500.00 700.00£ 2,000.00£ 3,400.00£ 4,900.00£ 6,500.00£
Payback Period 1 2 3 4 5 6 0.42
Payback Period 6.42
Accounting Rate of Return Average Annual Profit/Initial Investment
Average Annual Profit 1,150.00£
Initial Investment 5,000.00£
Accounting Rate of Return 23.00%
Sensitivity Analysis
Period Year 0 1 2 3 4 5 6 7 8 9 10
Project A 5,000.00 700.00£ 800.00£ 900.00£ 1,000.00£ 1,100.00£ 1,200.00£ 1,300.00£ 1,400.00£ 1,500.00£ 1,600.00£
Discount Factor 1.00 0.93 0.86 0.79 0.74 0.68 0.63 0.58 0.54 0.50 0.46
Discounted Cash Flows 5,000.00 648.15£ 685.87£ 714.45£ 735.03£ 748.64£ 756.20£ 758.54£ 756.38£ 750.37£ 741.11£
Net Present Value 2,294.74£
IRR 16%
b) Project B
Document Page
3INVESTMENT APPRAISAL TECHNIQUES
Period Year 0 1 2 3 4 5 6 7 8 9 10
Cash Flows 5,000.00 500.00£ -£ 3,000.00£ -£ 500.00£ 2,000.00£ -£ 1,000.00£ -£ -£
Discount Factor 1.00 0.96 0.92 0.89 0.85 0.82 0.79 0.76 0.73 0.70 0.68
Discounted Cash Flows 5,000.00 480.77£ -£ 2,666.99£ -£ 410.96£ 1,580.63£ -£ 730.69£ -£ -£
Net Present Value 870.04£
IRR 8%
Discounted Payback Period
Discounted Cash Flows 5,000.00 480.77£ -£ 2,666.99£ -£ 410.96£ 1,580.63£ -£ 730.69£ -£ -£
Amount Recovered 5,000.00 4,519.23 4,519.23 1,852.24 1,852.24 1,441.28 139.35£ 139.35£ 870.04£ 870.04£ 870.04£
Discounted Payback Period 0 1 2 3 4 5 0.91
Discounted Payback Period 5.91
Payback Period
Cash Flows 5,000.00 500.00£ -£ 3,000.00£ -£ 500.00£ 2,000.00£ -£ 1,000.00£ -£ -£
Amount Recovered 5,000.00 4,500.00 4,500.00 1,500.00 1,500.00 1,000.00 1,000.00£ 1,000.00£ 2,000.00£ 2,000.00£ 2,000.00£
Payback Period 1 2 3 4 5 6 0.50
Payback Period 6.50
Accounting Rate of Return Average Annual Profit/Initial Investment
Average Annual Profit 700.00£
Initial Investment 5,000.00£
Accounting Rate of Return 14.00%
Sensitivity Analysis
Period Year 0 1 2 3 4 5 6 7 8 9 10
Project A 5,000.00 500.00£ -£ 3,000.00£ -£ 500.00£ 2,000.00£ -£ 1,000.00£ -£ -£
Discount Factor 1.00 0.93 0.86 0.79 0.74 0.68 0.63 0.58 0.54 0.50 0.46
Discounted Cash Flows 5,000.00 462.96£ -£ 2,381.50£ -£ 340.29£ 1,260.34£ -£ 540.27£ -£ -£
Net Present Value 14.64
IRR 8%
Question 2
Advantages and Disadvantages of Investment Appraisal Techniques
Net Present Value shows the value of all cash flows that would be exceeding the cost of starting
the stated project (Levin and Hallgren 2017). The key advantages of the NPV methods are as
follows:
The methods incorporates the assumption of reinvestments.
Accepts the conventional cash flow patterns and methodology
Considers all the relevant cash flow that would be flowing from the project.
Acts as a good measure of profitability.
It factors various kinds of risks
The key disadvantages of the NPV Methods are as follows:
tabler-icon-diamond-filled.svg

Paraphrase This Document

Need a fresh take? Get an instant paraphrase of this document with our AI Paraphraser
Document Page
4INVESTMENT APPRAISAL TECHNIQUES
Estimating the Opportunity Cost
Ignoring the Sunk Cost
The required rate of return that is required from the project is difficult to compute via this
approach.
The projections done for the project can be optimistic in order to increase the viability of
the project (Su et al., 2018).
Acceptance of the project might not increase the wealth of the shareholders as the same is
just based on the projected cash flows for the company.
Differences in the timing and size of project cannot be easily tackled by the NPV
Method.
Internal Rate of Return
The return generated from the project in percentage return is well depicted in the form of IRR
Approach (Siziba and Hall 2019). The advantages of the IRR Approach are as follows:
The value derived from the method is simple and easy to interpret and calculate.
The requirement for the hurdle rate or the minimum set of required rate of return is not
necessary in this case.
The key disadvantage of the IRR Method are as follows:
The economies of scale flowing from the project is generally ignored.
There is an impractical set of implicit assumption of the reinvestment rate at the IRR
itself for the remaining period of the project (Al-Mutairi, Naser and Saeid 2018).
Contingent and dependent set of project are generally ignored while following the
calculation of IRR Method.
Document Page
5INVESTMENT APPRAISAL TECHNIQUES
Various mutually exclusive projects are generally ignored while following this approach.
If the project term is of different term the same is not considered by IRR Approach.
Payback Period
The payback period shows the total time taken by the project for recovering the cash
flows of the project by taking the cash flows. The key advantages of the method are as follows:
The payback period shows the total time in years for the project in returning the initial
amount invested.
It helps in easy interpretation and analysis.
The key disadvantages of the method are as follows:
The investment technique does not considers the factor of time value of money or
discount factor into account.
Discounted Payback Period
The discounted payback period shows the total time taken by the project for recovering
the cash flows of the project by taking the cash flows after taking the discount factor into
account. The key advantages of the method are as follows:
The investment technique does considers the factor of time value of money or discount
factor into account.
The key disadvantages of the method are as follows:
The discounting rate or the factor used for calculation may be inappropriate which may
increase the financial viability of the project.
Document Page
6INVESTMENT APPRAISAL TECHNIQUES
Accounting Rate of Return
The ARR is a financial ratio which is well used in the capital budgeting process, which
calculates the return generated from the project with the help of annual income generated and
total investment done. The key advantages of the method are as follows:
The Application of ARR is simple and easy to calculate incorporating the annual cash
flows flowing from the project.
The approach recognizes the concept of net earnings method that is the earnings after tax
and depreciation method.
The key disadvantages of the method are as follows:
The results for the project would be different if one well calculates the ROI and another
well calculates with the ARR Approach. It would be creating a conflict in making
decisions.
Determining a fair rate of return would not be possible with the ARR, as the same would
be with the discretion of the management.
Sensitivity Analysis
The analysis for the project has been specifically done in order to assess the value of the
project if a key variable changes. In this case for the project the discount rate has been changed
from 4% to around 8% in order to well asses the financial viability of the project. The key
disadvantage of the project is that the key factor which is about to change is uncertain.
tabler-icon-diamond-filled.svg

Paraphrase This Document

Need a fresh take? Get an instant paraphrase of this document with our AI Paraphraser
Document Page
7INVESTMENT APPRAISAL TECHNIQUES
Question 3
The stability of the project has been well assessed with the help of various investment
appraisal techniques that have been deployed. The net present value flowing from Project A for
the company has been around £4,065.76 and the Internal Rate of Return for the project is around
16%. The discounted payback period for the project is around 6.08 Years and the payback period
for the project is around 6.42 Years (Nawaiseh et al., 2017). The accounting rate of return
calculated for the Project A is around 23.00%. On the other hand, the net present value flowing
from Project B for the company has been around £870.04 and the Internal Rate of Return for the
project is around 8%. The discounted payback period for the project is around 5.91 Years and the
payback period for the project is around 6.50 Years. The accounting rate of return calculated for
the Project B is around 23.00%. Thus, based on the financial viability of the Project A offers a
higher set of return, while Project B does not on a comparative basis.
Question 4
In order to well asses the different outcomes flowing to the company from Project A are
well done with the help of sensitivity analysis where it was clearly seen that even if the required
rate of return changes from 4% to 8% if the project risks changes then also Project A would be
viable. In terms of return Project A is much more favorable however in terms of recovery of cash
flows Project B is efficient. However, keeping NPV and Return as the sole criteria ProjectA
should be accepted.
Document Page
8INVESTMENT APPRAISAL TECHNIQUES
References
Al-Mutairi, A., Naser, K. and Saeid, M., 2018. Capital budgeting practices by non-financial
companies listed on Kuwait Stock Exchange (KSE). Cogent Economics & Finance, 6(1),
p.1468232.
Chadha, S. and Sharma, S.K., 2019. Capital budgeting practices: a survey in the selected Indian
manufacturing firms. International Journal of Indian Culture and Business Management, 18(4),
pp.381-390.
Levin, V. and Hallgren, A., 2017. The choice of capital budgeting techniques: a human capital
approach.
Nawaiseh, M.E., Al-nawaiseh, H., Attar, M.D. and Al-nidawy, A., 2017, September. The Use of
Capital Budgeting Techniques as a Tool for Management Decisions: Evidence from Jordan.
In International Conference on Engineering, Project, and Product Management (pp. 301-309).
Springer, Cham.
Siziba, S. and Hall, J.H., 2019. The evolution of the application of capital budgeting techniques
in enterprises. Global Finance Journal, p.100504.
Su, S.H., Lee, H.L., Chou, J.J., Yeh, J.Y. and Thi, M.H.V., 2018. Application and effects of
capital budgeting among the manufacturing companies in Vietnam. International Journal of
Organizational Innovation (Online), 10(4), pp.111-120.
chevron_up_icon
1 out of 9
circle_padding
hide_on_mobile
zoom_out_icon
[object Object]