Investment Appraisal Techniques: Risk Analysis, CAPM, and Allocation
VerifiedAdded on 2023/06/15
|11
|2025
|195
Report
AI Summary
This report provides a detailed analysis of investment appraisal techniques, including payback period, internal rate of return (IRR), net present value (NPV), and profitability index. It examines the merits and demerits of the IRR rule, determines the optimal allocation of an investment budget among different projects, and discusses the distinction between hard and soft capital rationing. Furthermore, the report calculates the systematic risk, non-systematic risk, and total risk of equity shares, assessing which company's returns are better explained by market returns and calculating the expected equilibrium risk-premium for each share. The analysis concludes that these techniques are crucial for making informed investment decisions.
Investment Appraisal
Techniques Risk and the
CAPM
Techniques Risk and the
CAPM
Paraphrase This Document
Need a fresh take? Get an instant paraphrase of this document with our AI Paraphraser


Contents
INTRODUCTION...........................................................................................................................................3
QUESTION 1.................................................................................................................................................3
(a) Calculation..........................................................................................................................................3
(b) Briefly discuss the merits and demerits of the internal rate of return rule........................................4
QUESTION 2.................................................................................................................................................5
Determine the optimal allocation of the investment budget among these projects...............................5
(b) Discuss the distinction between hard and soft capital rationing........................................................5
QUESTION 3.................................................................................................................................................6
(a) Calculate the systematic risk, the non-systematic risk and the total risk (𝜎𝑖 2 ) of the equity shares
of Vodafone Group and BT Group...........................................................................................................6
(b) Which company’s returns are better explained by the market’s returns?.........................................9
(c) Calculate the expected equilibrium risk-premium for each of the two shares. Comment on the
results......................................................................................................................................................9
CONCLUSION...............................................................................................................................................9
REFERENCES..............................................................................................................................................10
⊘ This is a preview!⊘
Do you want full access?
Subscribe today to unlock all pages.
Trusted by 1+ million students worldwide

INTRODUCTION
Investment decisions are critical for all enterprises even though they affect both their
potential to succeed and their eventual business model. Investments typically involve large initial
financial expenditures, locking up substantial amounts of money. Payback period, internal rate of
return, net present value, profitability index, and net profit ratio are investment assessment
approaches. They are generally intended to assess the success of a new initiative. Whenever
embarking on any new Endeavour, the first thing to know is, "Is it sustainable or financially
viable?" These strategies provide excellent answers to this question. Every approach assesses the
topic from a distinct perspective and delivers a unique perspective. Let's take a quick look at
these strategies. This report based on the different investment appraisal techniques which is used
by various organisation with investment purpose.
QUESTION 1
(a) Calculation
(1) NPV of proposed project
Year CF*DR NPV
0 1450,000 1450000
1 20000*0.909 181800
2 200000*0.826 165200
3 200000*0.751 150200
4 200000*0.683 136600
5 200000*621 124200
Evidence that was presented above, it has been determined that the organisation will accept the
project since it will success. Some of the factors that might affect sales profits are as follows:
(2) Sales price of apartment: 200000*6 = 1200000
Paraphrase This Document
Need a fresh take? Get an instant paraphrase of this document with our AI Paraphraser
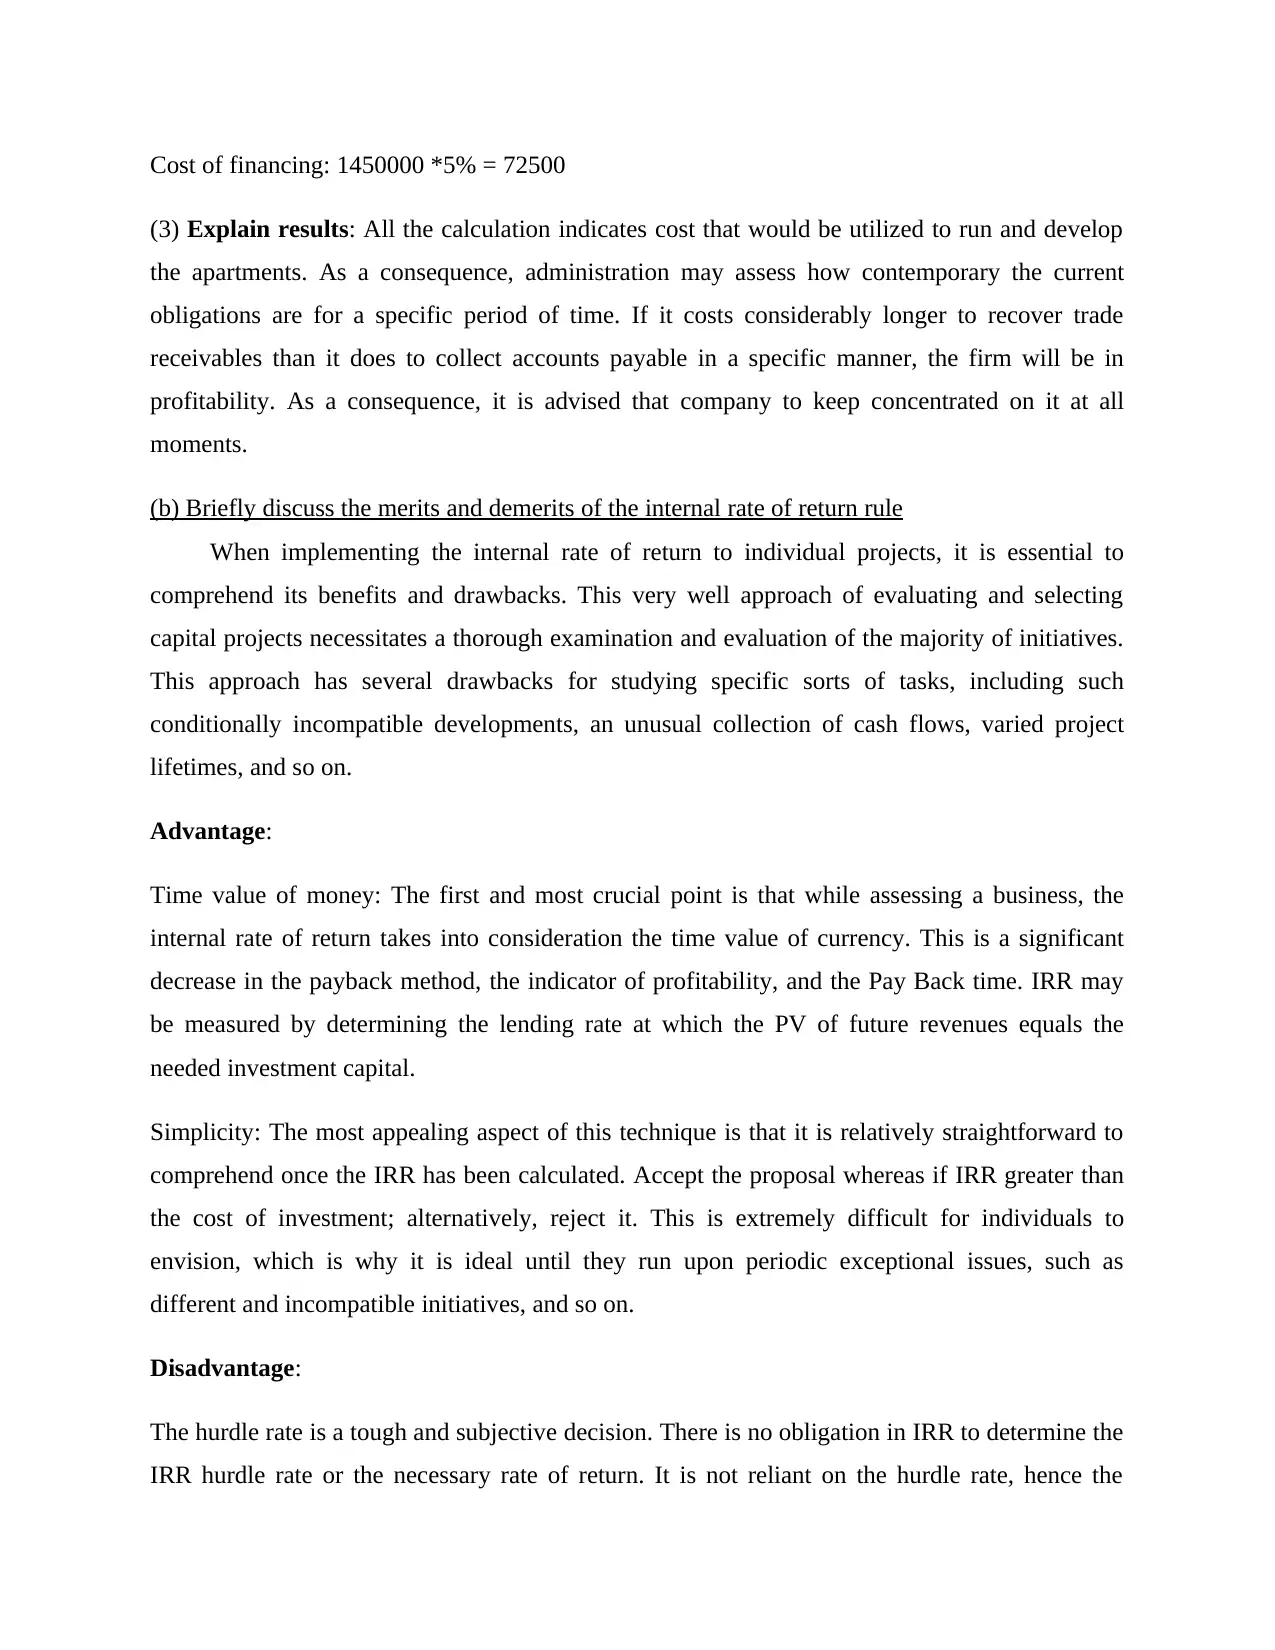
Cost of financing: 1450000 *5% = 72500
(3) Explain results: All the calculation indicates cost that would be utilized to run and develop
the apartments. As a consequence, administration may assess how contemporary the current
obligations are for a specific period of time. If it costs considerably longer to recover trade
receivables than it does to collect accounts payable in a specific manner, the firm will be in
profitability. As a consequence, it is advised that company to keep concentrated on it at all
moments.
(b) Briefly discuss the merits and demerits of the internal rate of return rule
When implementing the internal rate of return to individual projects, it is essential to
comprehend its benefits and drawbacks. This very well approach of evaluating and selecting
capital projects necessitates a thorough examination and evaluation of the majority of initiatives.
This approach has several drawbacks for studying specific sorts of tasks, including such
conditionally incompatible developments, an unusual collection of cash flows, varied project
lifetimes, and so on.
Advantage:
Time value of money: The first and most crucial point is that while assessing a business, the
internal rate of return takes into consideration the time value of currency. This is a significant
decrease in the payback method, the indicator of profitability, and the Pay Back time. IRR may
be measured by determining the lending rate at which the PV of future revenues equals the
needed investment capital.
Simplicity: The most appealing aspect of this technique is that it is relatively straightforward to
comprehend once the IRR has been calculated. Accept the proposal whereas if IRR greater than
the cost of investment; alternatively, reject it. This is extremely difficult for individuals to
envision, which is why it is ideal until they run upon periodic exceptional issues, such as
different and incompatible initiatives, and so on.
Disadvantage:
The hurdle rate is a tough and subjective decision. There is no obligation in IRR to determine the
IRR hurdle rate or the necessary rate of return. It is not reliant on the hurdle rate, hence the
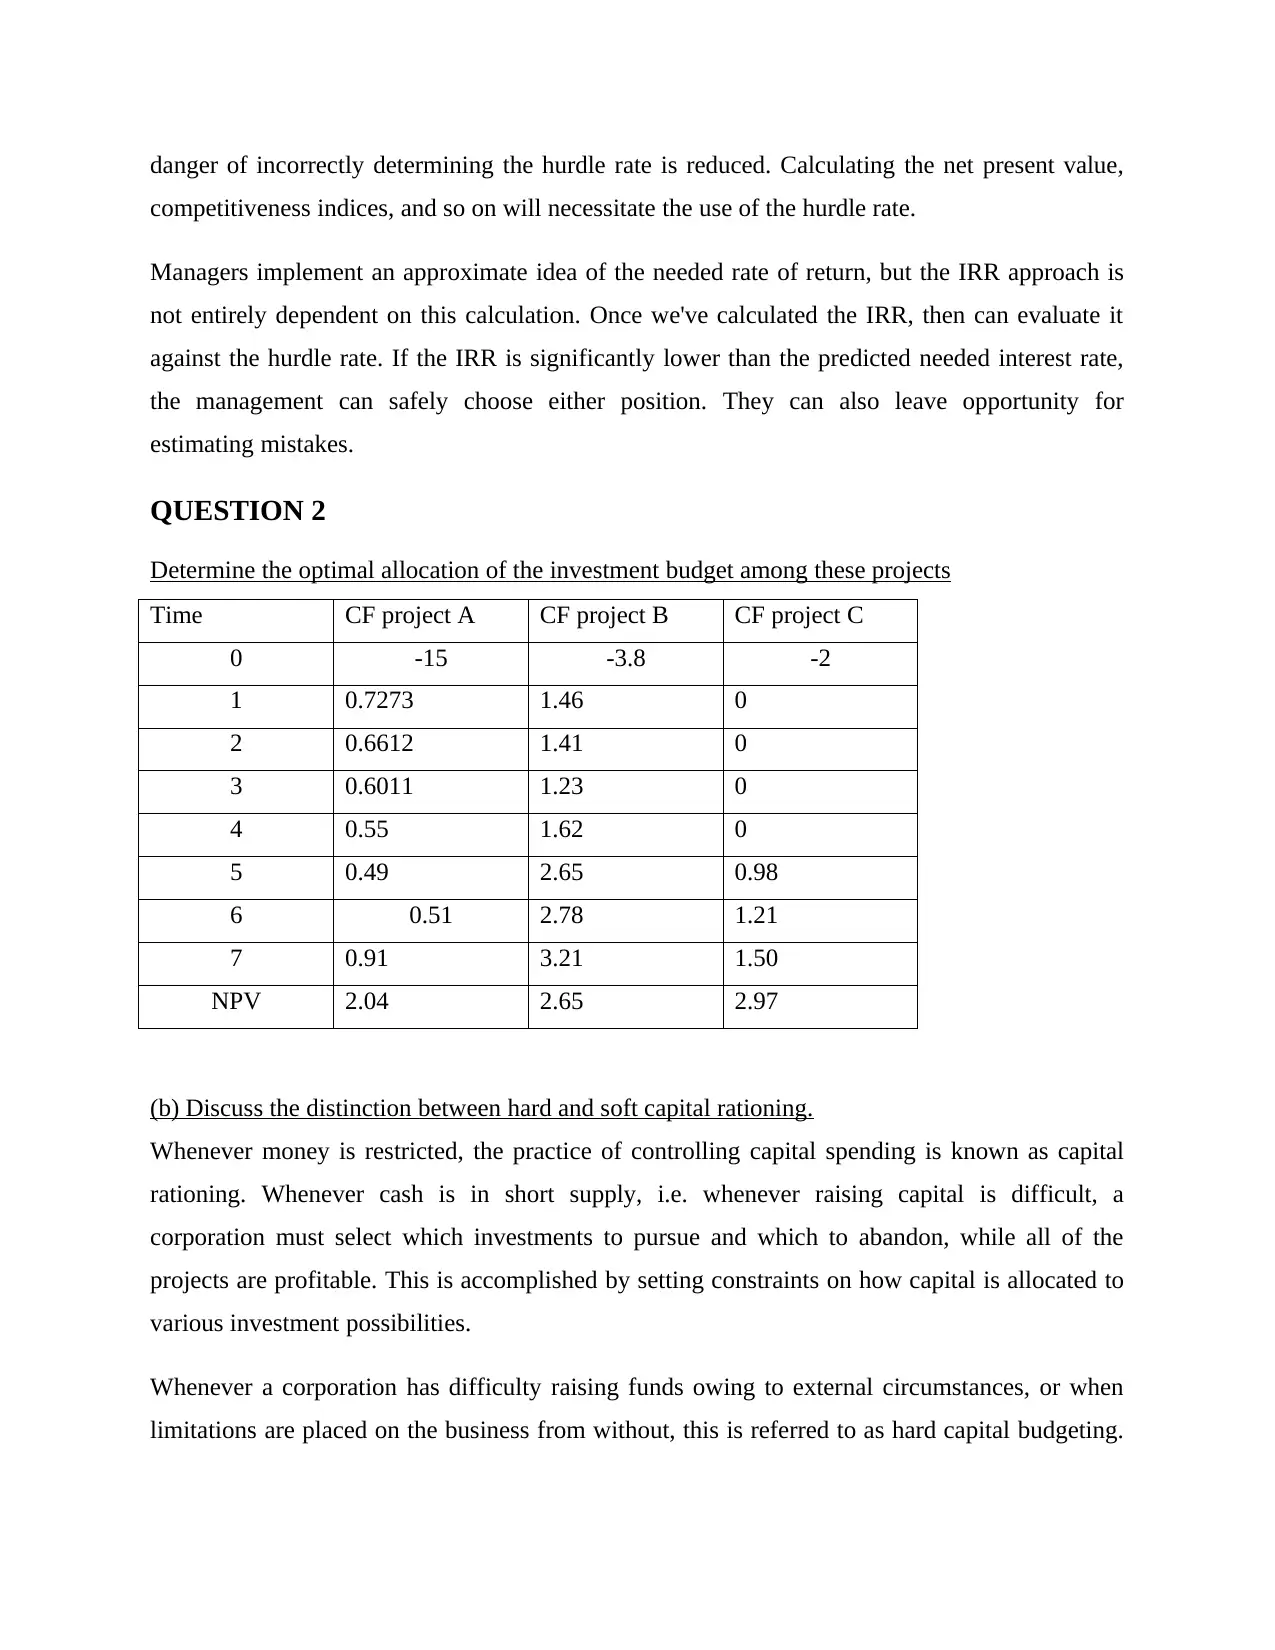
danger of incorrectly determining the hurdle rate is reduced. Calculating the net present value,
competitiveness indices, and so on will necessitate the use of the hurdle rate.
Managers implement an approximate idea of the needed rate of return, but the IRR approach is
not entirely dependent on this calculation. Once we've calculated the IRR, then can evaluate it
against the hurdle rate. If the IRR is significantly lower than the predicted needed interest rate,
the management can safely choose either position. They can also leave opportunity for
estimating mistakes.
QUESTION 2
Determine the optimal allocation of the investment budget among these projects
Time CF project A CF project B CF project C
0 -15 -3.8 -2
1 0.7273 1.46 0
2 0.6612 1.41 0
3 0.6011 1.23 0
4 0.55 1.62 0
5 0.49 2.65 0.98
6 0.51 2.78 1.21
7 0.91 3.21 1.50
NPV 2.04 2.65 2.97
(b) Discuss the distinction between hard and soft capital rationing.
Whenever money is restricted, the practice of controlling capital spending is known as capital
rationing. Whenever cash is in short supply, i.e. whenever raising capital is difficult, a
corporation must select which investments to pursue and which to abandon, while all of the
projects are profitable. This is accomplished by setting constraints on how capital is allocated to
various investment possibilities.
Whenever a corporation has difficulty raising funds owing to external circumstances, or when
limitations are placed on the business from without, this is referred to as hard capital budgeting.
⊘ This is a preview!⊘
Do you want full access?
Subscribe today to unlock all pages.
Trusted by 1+ million students worldwide
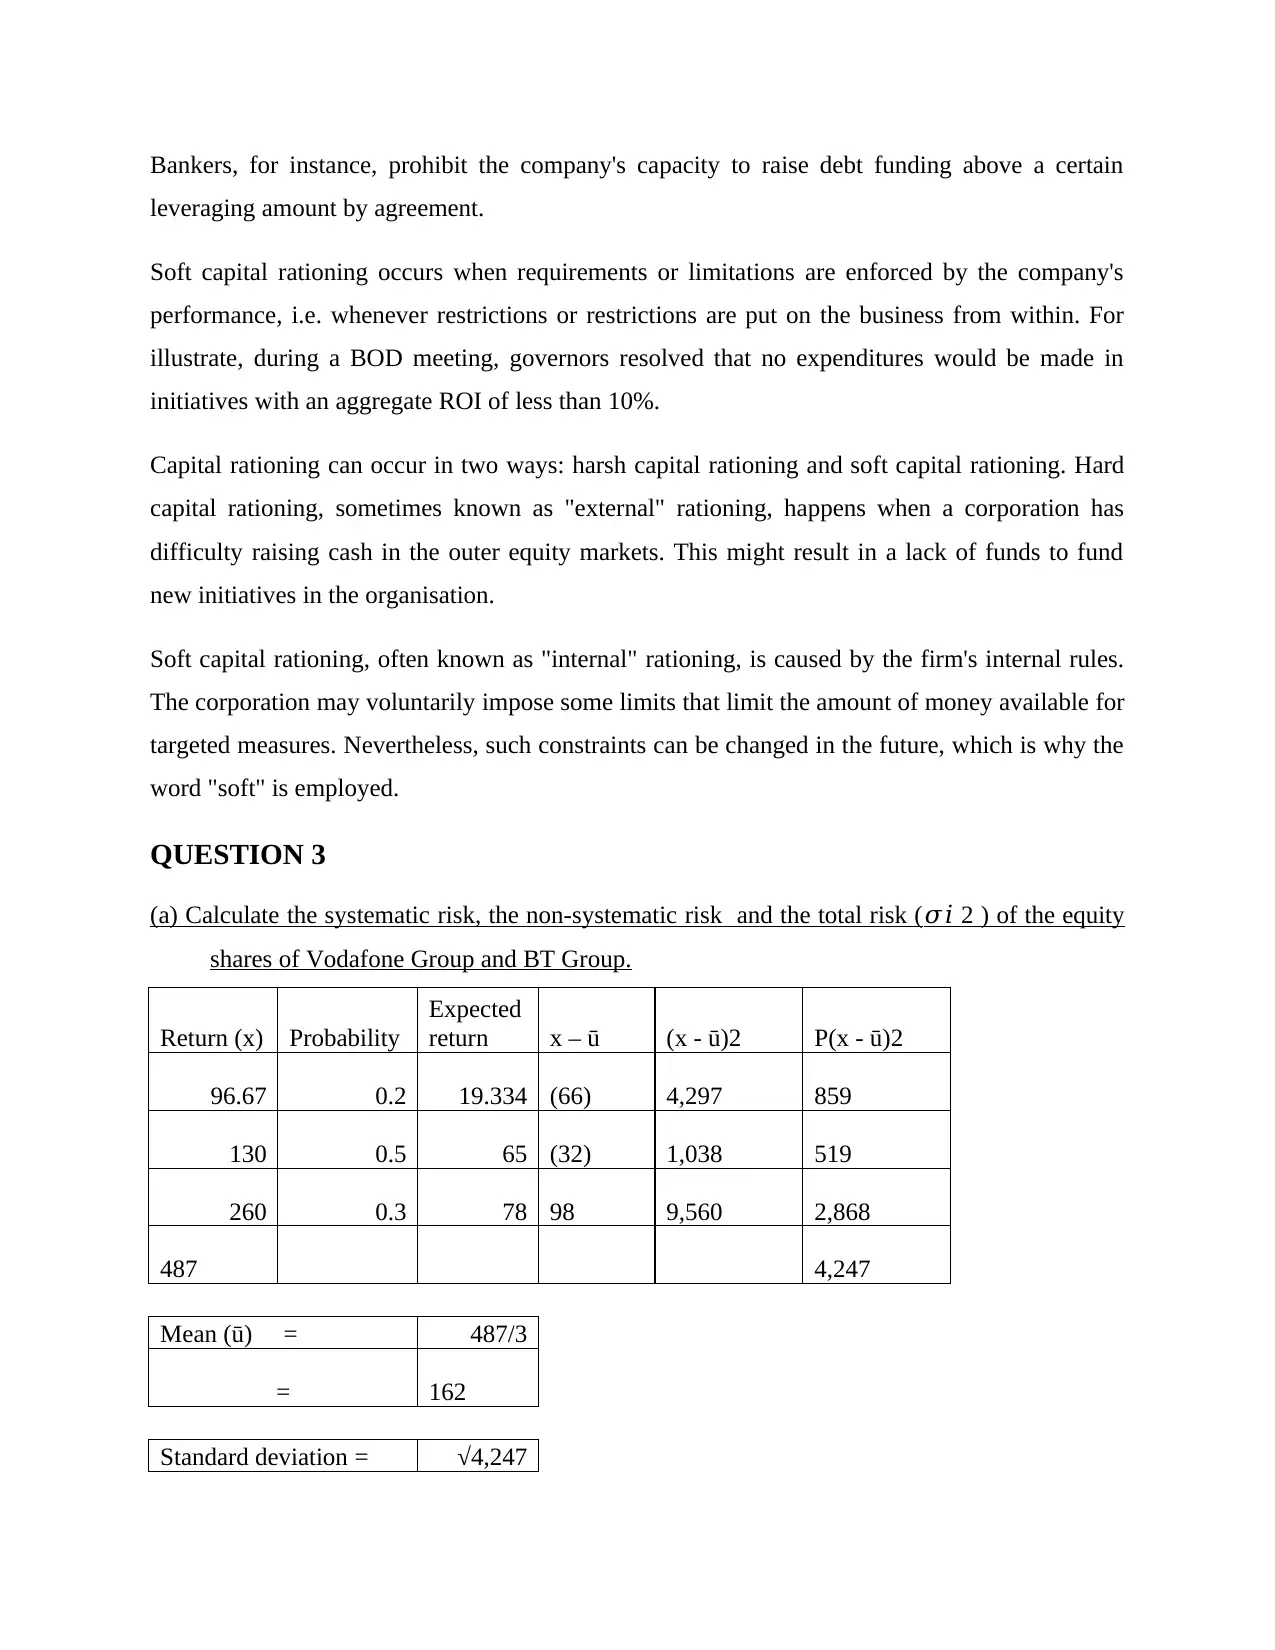
Bankers, for instance, prohibit the company's capacity to raise debt funding above a certain
leveraging amount by agreement.
Soft capital rationing occurs when requirements or limitations are enforced by the company's
performance, i.e. whenever restrictions or restrictions are put on the business from within. For
illustrate, during a BOD meeting, governors resolved that no expenditures would be made in
initiatives with an aggregate ROI of less than 10%.
Capital rationing can occur in two ways: harsh capital rationing and soft capital rationing. Hard
capital rationing, sometimes known as "external" rationing, happens when a corporation has
difficulty raising cash in the outer equity markets. This might result in a lack of funds to fund
new initiatives in the organisation.
Soft capital rationing, often known as "internal" rationing, is caused by the firm's internal rules.
The corporation may voluntarily impose some limits that limit the amount of money available for
targeted measures. Nevertheless, such constraints can be changed in the future, which is why the
word "soft" is employed.
QUESTION 3
(a) Calculate the systematic risk, the non-systematic risk and the total risk (𝜎𝑖 2 ) of the equity
shares of Vodafone Group and BT Group.
Return (x) Probability
Expected
return x – ū (x - ū)2 P(x - ū)2
96.67 0.2 19.334 (66) 4,297 859
130 0.5 65 (32) 1,038 519
260 0.3 78 98 9,560 2,868
487 4,247
Mean (ū) = 487/3
= 162
Standard deviation = √4,247
Paraphrase This Document
Need a fresh take? Get an instant paraphrase of this document with our AI Paraphraser
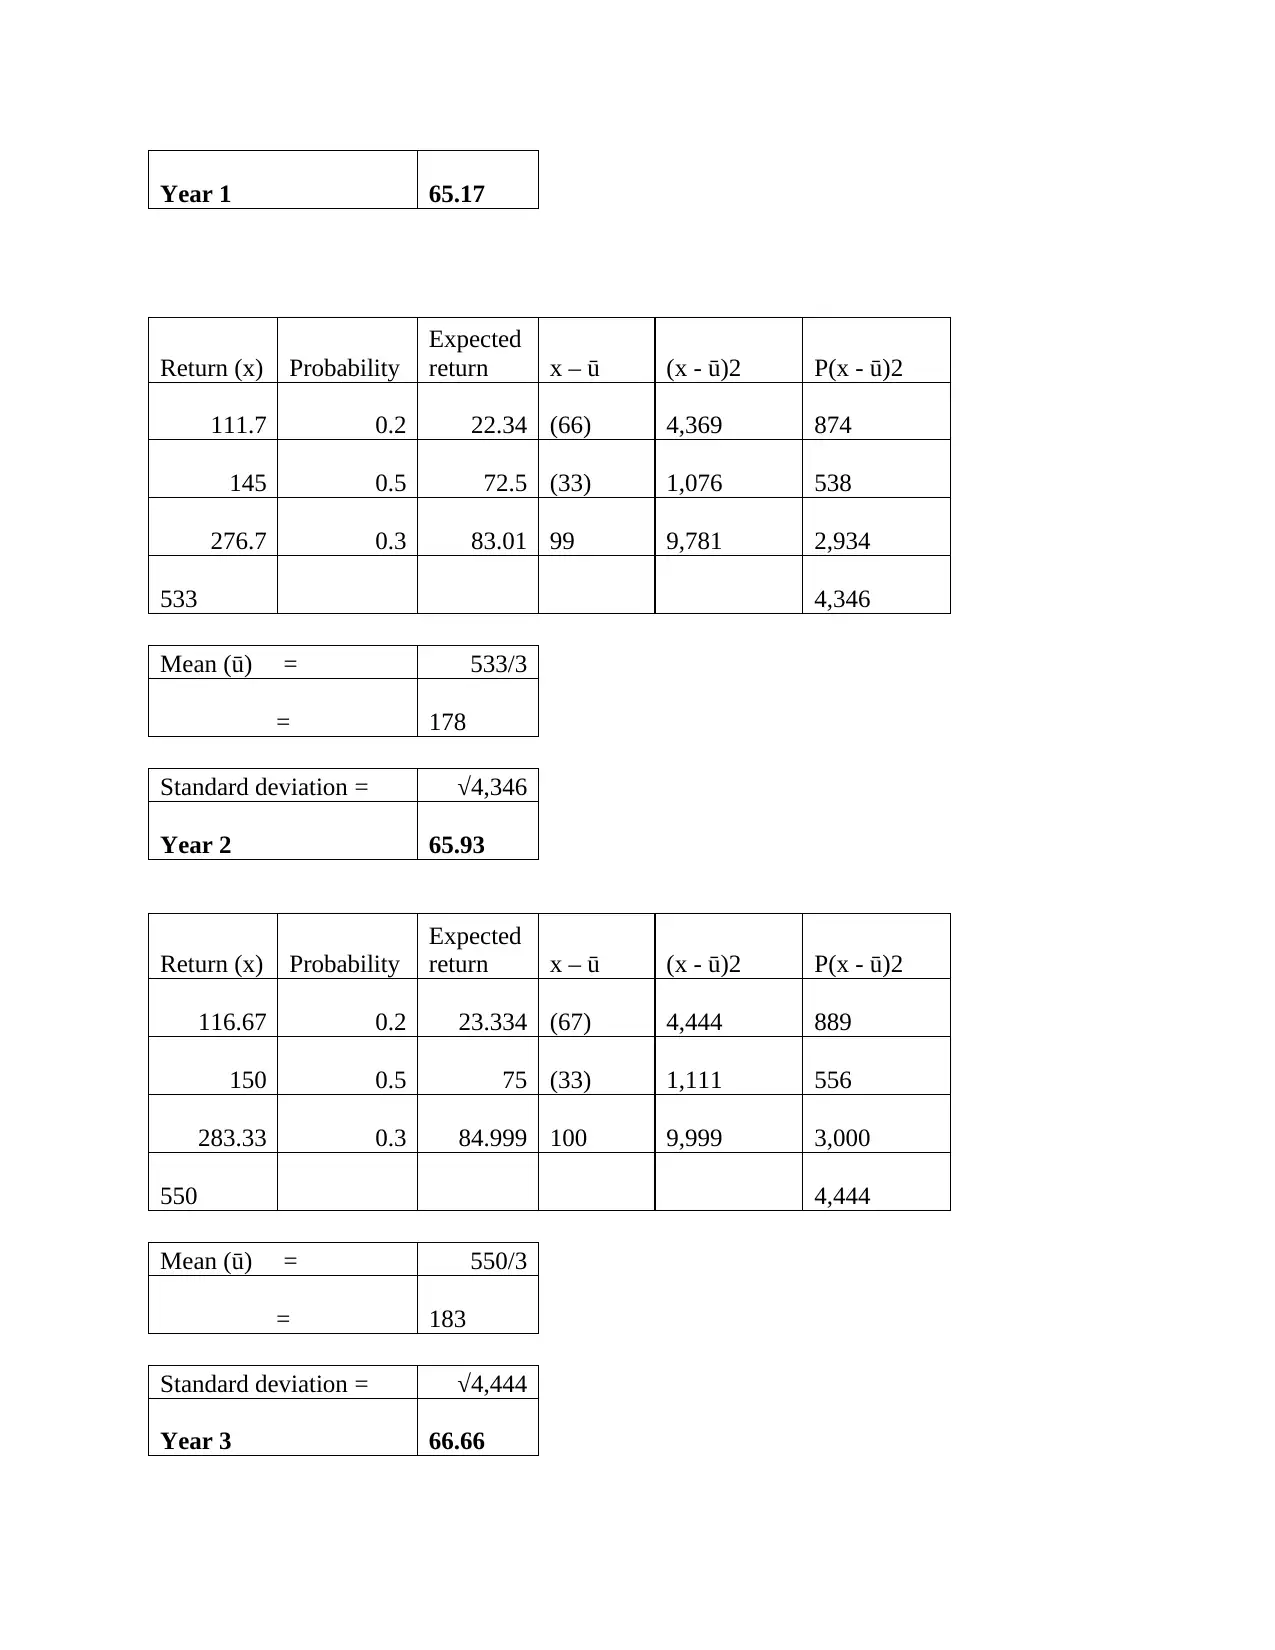
Year 1 65.17
Return (x) Probability
Expected
return x – ū (x - ū)2 P(x - ū)2
111.7 0.2 22.34 (66) 4,369 874
145 0.5 72.5 (33) 1,076 538
276.7 0.3 83.01 99 9,781 2,934
533 4,346
Mean (ū) = 533/3
= 178
Standard deviation = √4,346
Year 2 65.93
Return (x) Probability
Expected
return x – ū (x - ū)2 P(x - ū)2
116.67 0.2 23.334 (67) 4,444 889
150 0.5 75 (33) 1,111 556
283.33 0.3 84.999 100 9,999 3,000
550 4,444
Mean (ū) = 550/3
= 183
Standard deviation = √4,444
Year 3 66.66
Return (x) Probability
Expected
return x – ū (x - ū)2 P(x - ū)2
111.7 0.2 22.34 (66) 4,369 874
145 0.5 72.5 (33) 1,076 538
276.7 0.3 83.01 99 9,781 2,934
533 4,346
Mean (ū) = 533/3
= 178
Standard deviation = √4,346
Year 2 65.93
Return (x) Probability
Expected
return x – ū (x - ū)2 P(x - ū)2
116.67 0.2 23.334 (67) 4,444 889
150 0.5 75 (33) 1,111 556
283.33 0.3 84.999 100 9,999 3,000
550 4,444
Mean (ū) = 550/3
= 183
Standard deviation = √4,444
Year 3 66.66
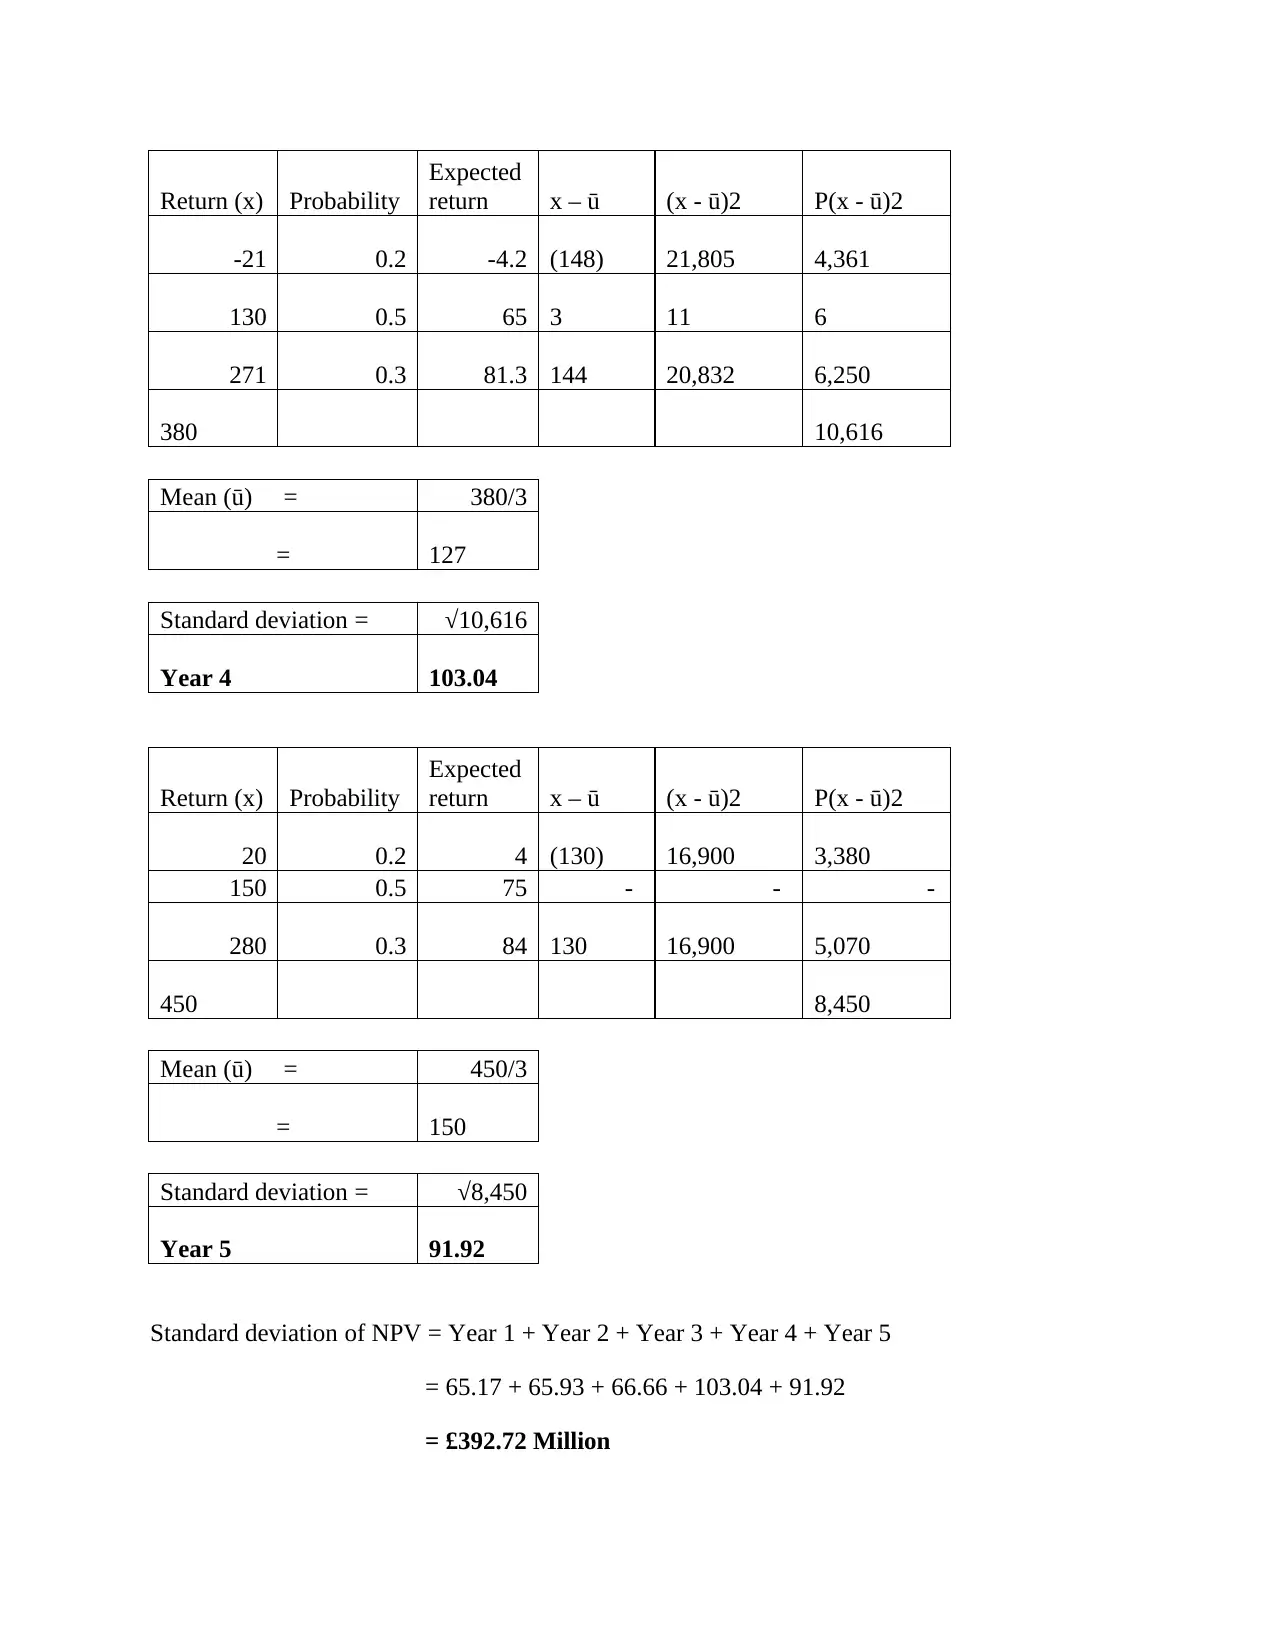
Return (x) Probability
Expected
return x – ū (x - ū)2 P(x - ū)2
-21 0.2 -4.2 (148) 21,805 4,361
130 0.5 65 3 11 6
271 0.3 81.3 144 20,832 6,250
380 10,616
Mean (ū) = 380/3
= 127
Standard deviation = √10,616
Year 4 103.04
Return (x) Probability
Expected
return x – ū (x - ū)2 P(x - ū)2
20 0.2 4 (130) 16,900 3,380
150 0.5 75 - - -
280 0.3 84 130 16,900 5,070
450 8,450
Mean (ū) = 450/3
= 150
Standard deviation = √8,450
Year 5 91.92
Standard deviation of NPV = Year 1 + Year 2 + Year 3 + Year 4 + Year 5
= 65.17 + 65.93 + 66.66 + 103.04 + 91.92
= £392.72 Million
Expected
return x – ū (x - ū)2 P(x - ū)2
-21 0.2 -4.2 (148) 21,805 4,361
130 0.5 65 3 11 6
271 0.3 81.3 144 20,832 6,250
380 10,616
Mean (ū) = 380/3
= 127
Standard deviation = √10,616
Year 4 103.04
Return (x) Probability
Expected
return x – ū (x - ū)2 P(x - ū)2
20 0.2 4 (130) 16,900 3,380
150 0.5 75 - - -
280 0.3 84 130 16,900 5,070
450 8,450
Mean (ū) = 450/3
= 150
Standard deviation = √8,450
Year 5 91.92
Standard deviation of NPV = Year 1 + Year 2 + Year 3 + Year 4 + Year 5
= 65.17 + 65.93 + 66.66 + 103.04 + 91.92
= £392.72 Million
⊘ This is a preview!⊘
Do you want full access?
Subscribe today to unlock all pages.
Trusted by 1+ million students worldwide
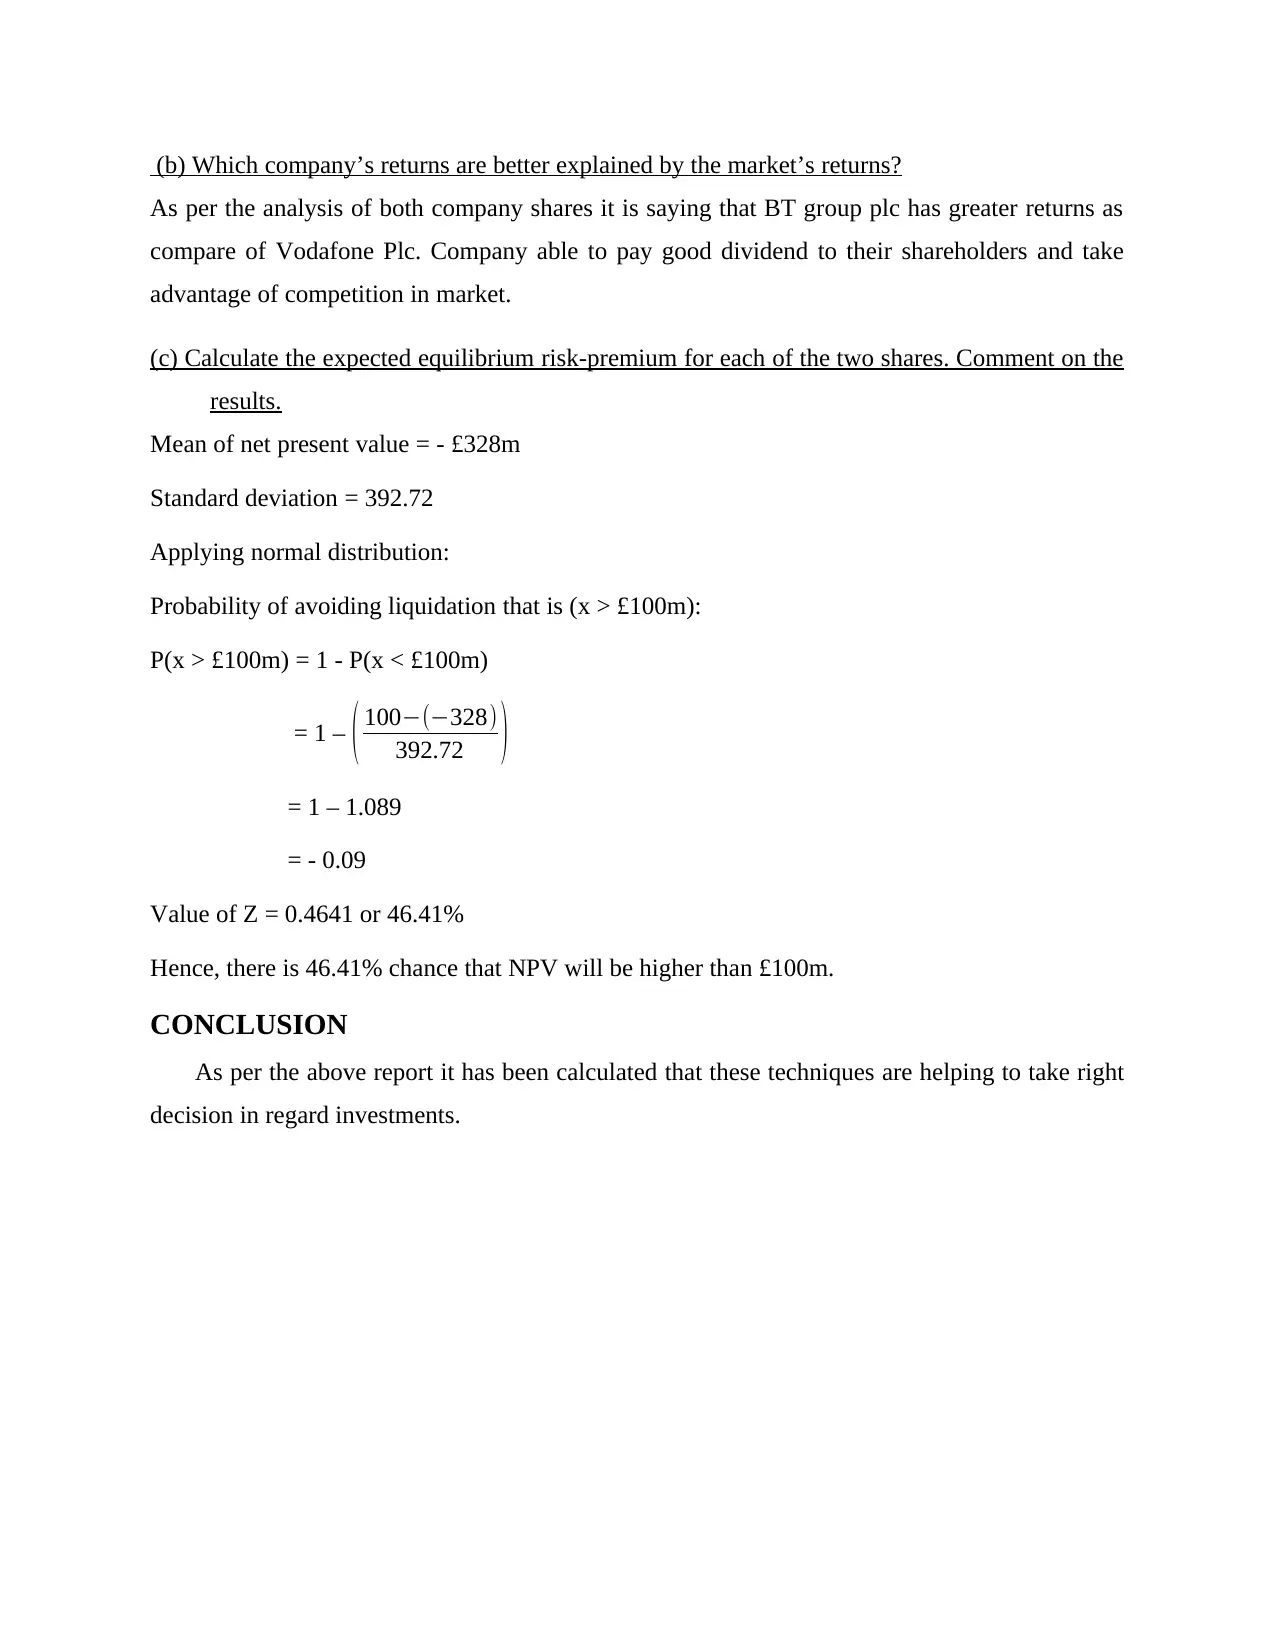
(b) Which company’s returns are better explained by the market’s returns?
As per the analysis of both company shares it is saying that BT group plc has greater returns as
compare of Vodafone Plc. Company able to pay good dividend to their shareholders and take
advantage of competition in market.
(c) Calculate the expected equilibrium risk-premium for each of the two shares. Comment on the
results.
Mean of net present value = - £328m
Standard deviation = 392.72
Applying normal distribution:
Probability of avoiding liquidation that is (x > £100m):
P(x > £100m) = 1 - P(x < £100m)
= 1 – ( 100−(−328)
392.72 )
= 1 – 1.089
= - 0.09
Value of Z = 0.4641 or 46.41%
Hence, there is 46.41% chance that NPV will be higher than £100m.
CONCLUSION
As per the above report it has been calculated that these techniques are helping to take right
decision in regard investments.
Paraphrase This Document
Need a fresh take? Get an instant paraphrase of this document with our AI Paraphraser
REFERENCES
Books and Journal
Baker, C. R. and Persson, M. E., 2021. The Concept of Measurement in Financial Reporting.
In Historical Developments in the Accountancy Profession, Financial Reporting, and
Accounting Theory. Emerald Publishing Limited.
Mohamadi, M., 2020. Quality of Financial Reporting, Family Ownership, and Investment
Performance in Companies Listed in Tehran Stock Exchange. Journal of Accounting
Research. 10(3). pp.157-184.
Dameri, R. P., Garelli, R. and Resta, M., 2020. Neural networks in accounting: clustering firm
performance using financial reporting data. Journal of Information Systems. 34(2).
pp.149-166.
McVay, S. E. and Szerwo, B., 2021. Preparers and the Financial Reporting System. Accounting
and Business Research, forthcoming.
Yeboah, B. and Pais, C., 2021. International financial reporting standards adoption and
accounting quality: evidence from Ghanaian listed firms. Afro-Asian Journal of Finance
and Accounting. 11(4). pp.490-517.
Opare, S., Houqe, M. N. and Van Zijl, T., 2021. Meta‐analysis of the Impact of Adoption of
IFRS on Financial Reporting Comparability, Market Liquidity, and Cost of
Capital. Abacus. 57(3). pp.502-556.
1 out of 11
Related Documents


Your All-in-One AI-Powered Toolkit for Academic Success.
+13062052269
info@desklib.com
Available 24*7 on WhatsApp / Email
![[object Object]](/_next/static/media/star-bottom.7253800d.svg)
Unlock your academic potential
Copyright © 2020–2026 A2Z Services. All Rights Reserved. Developed and managed by ZUCOL.