Investment Decision: NPV, IRR, MIRR, Payback Analysis for Alternatives

Verified

Added on  2023/06/15

|9
|1109
|470
Report
AI Summary
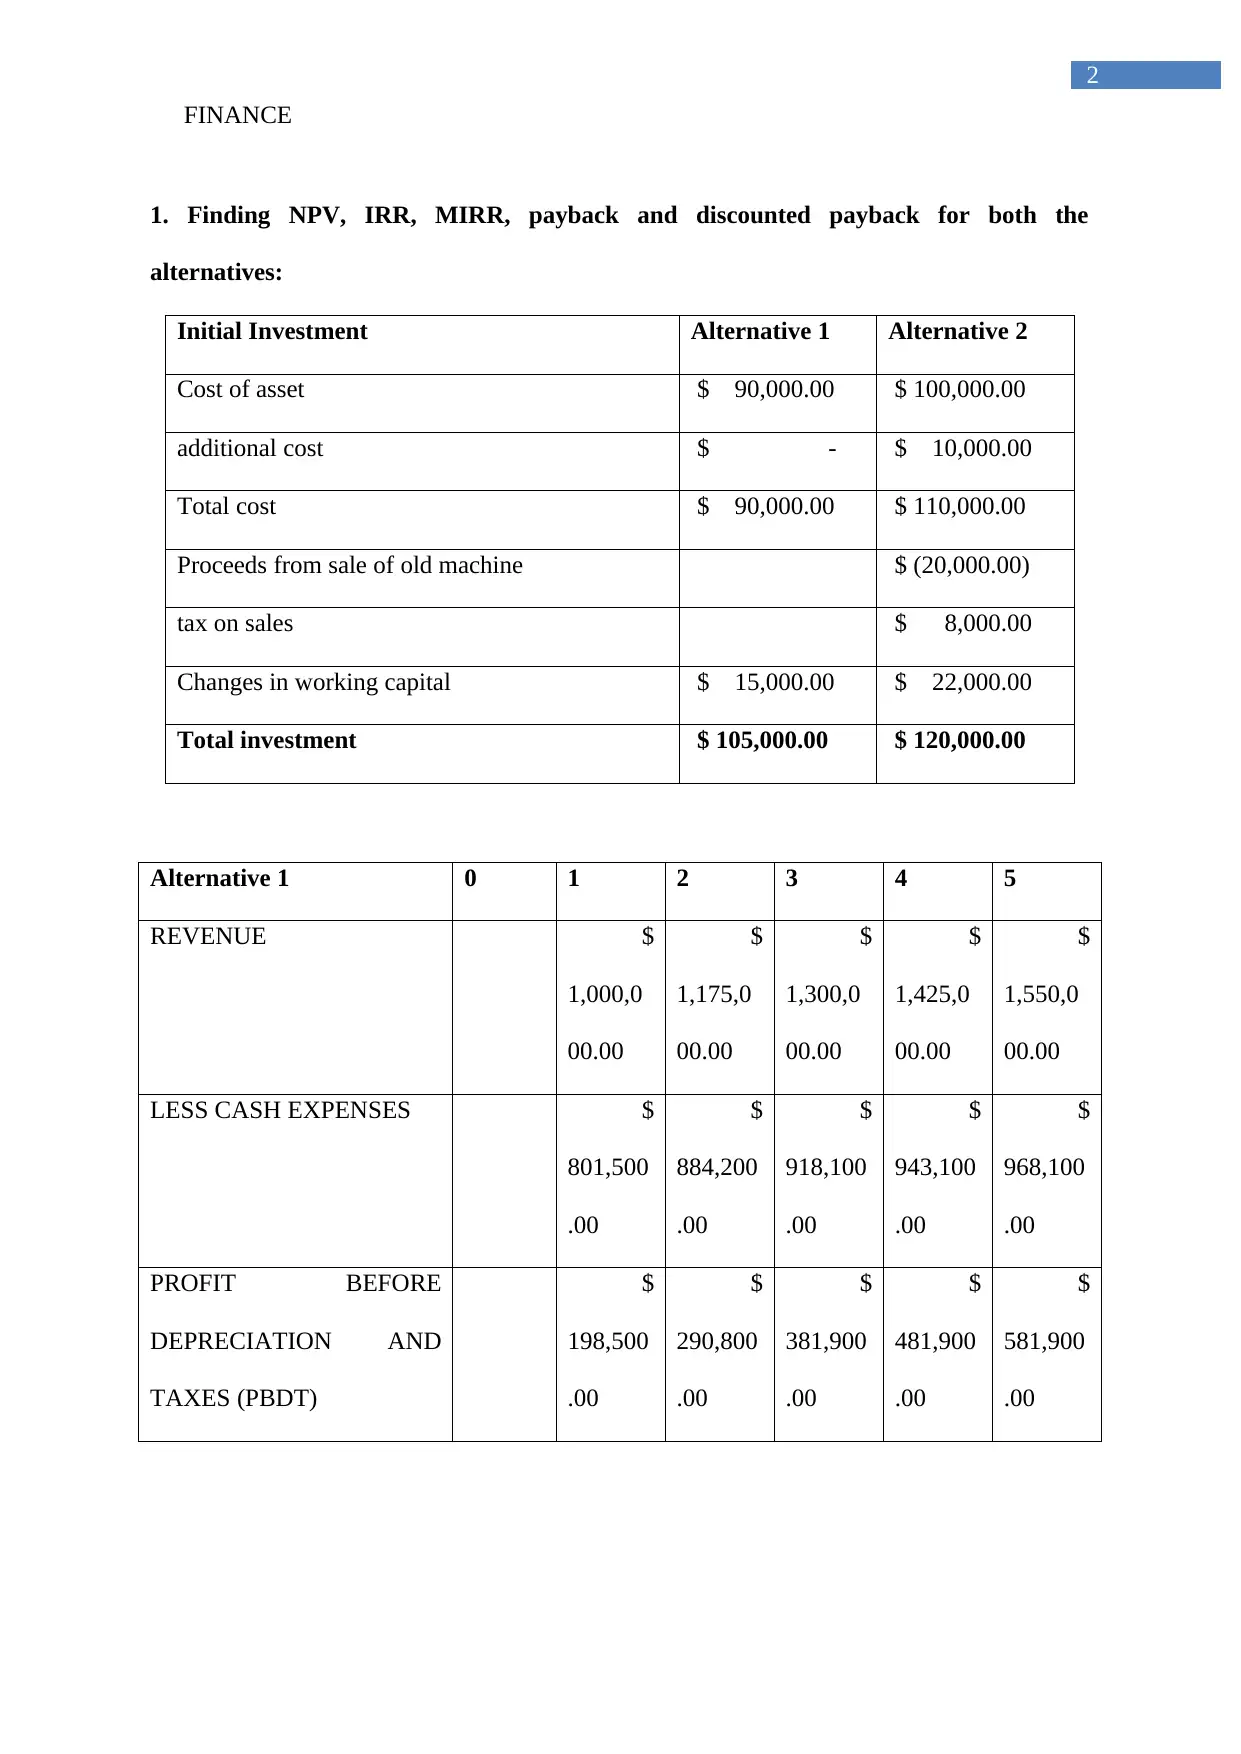
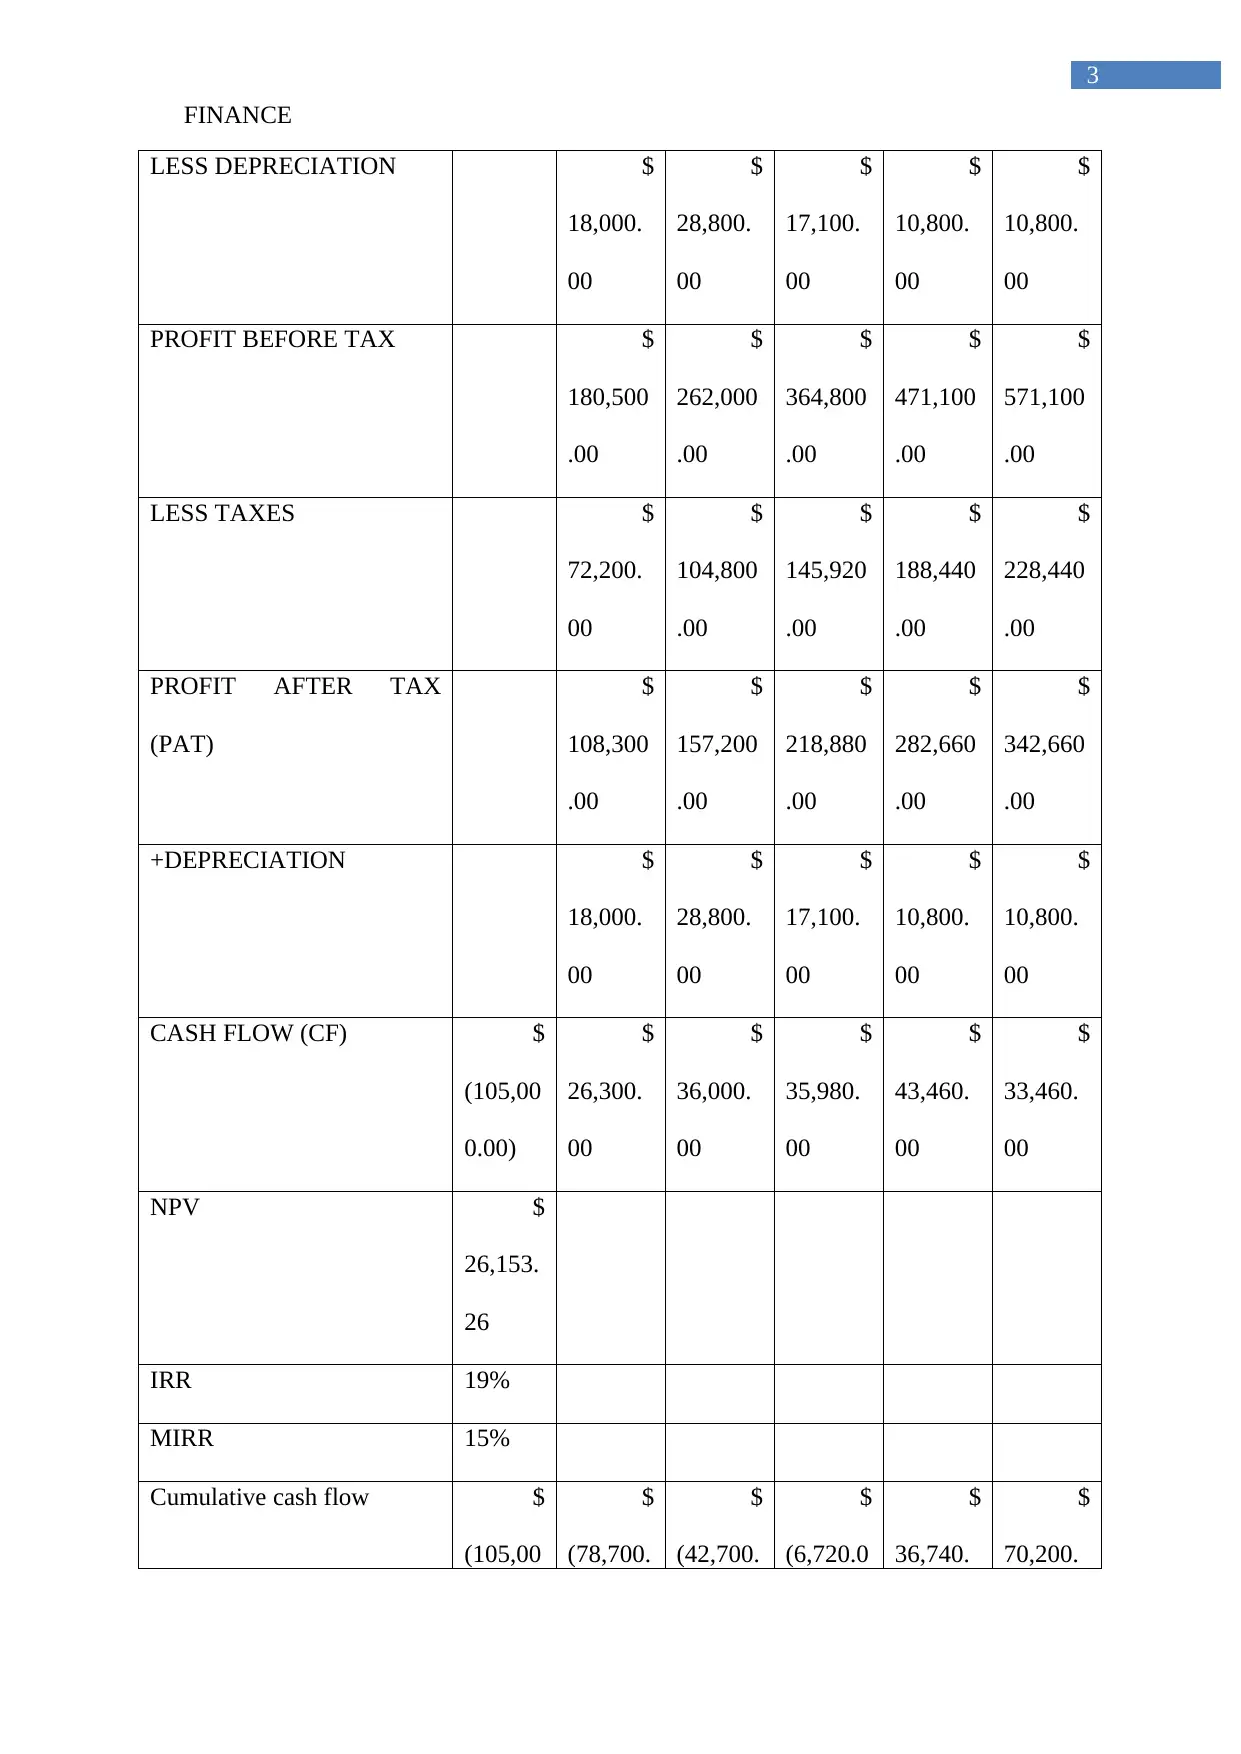
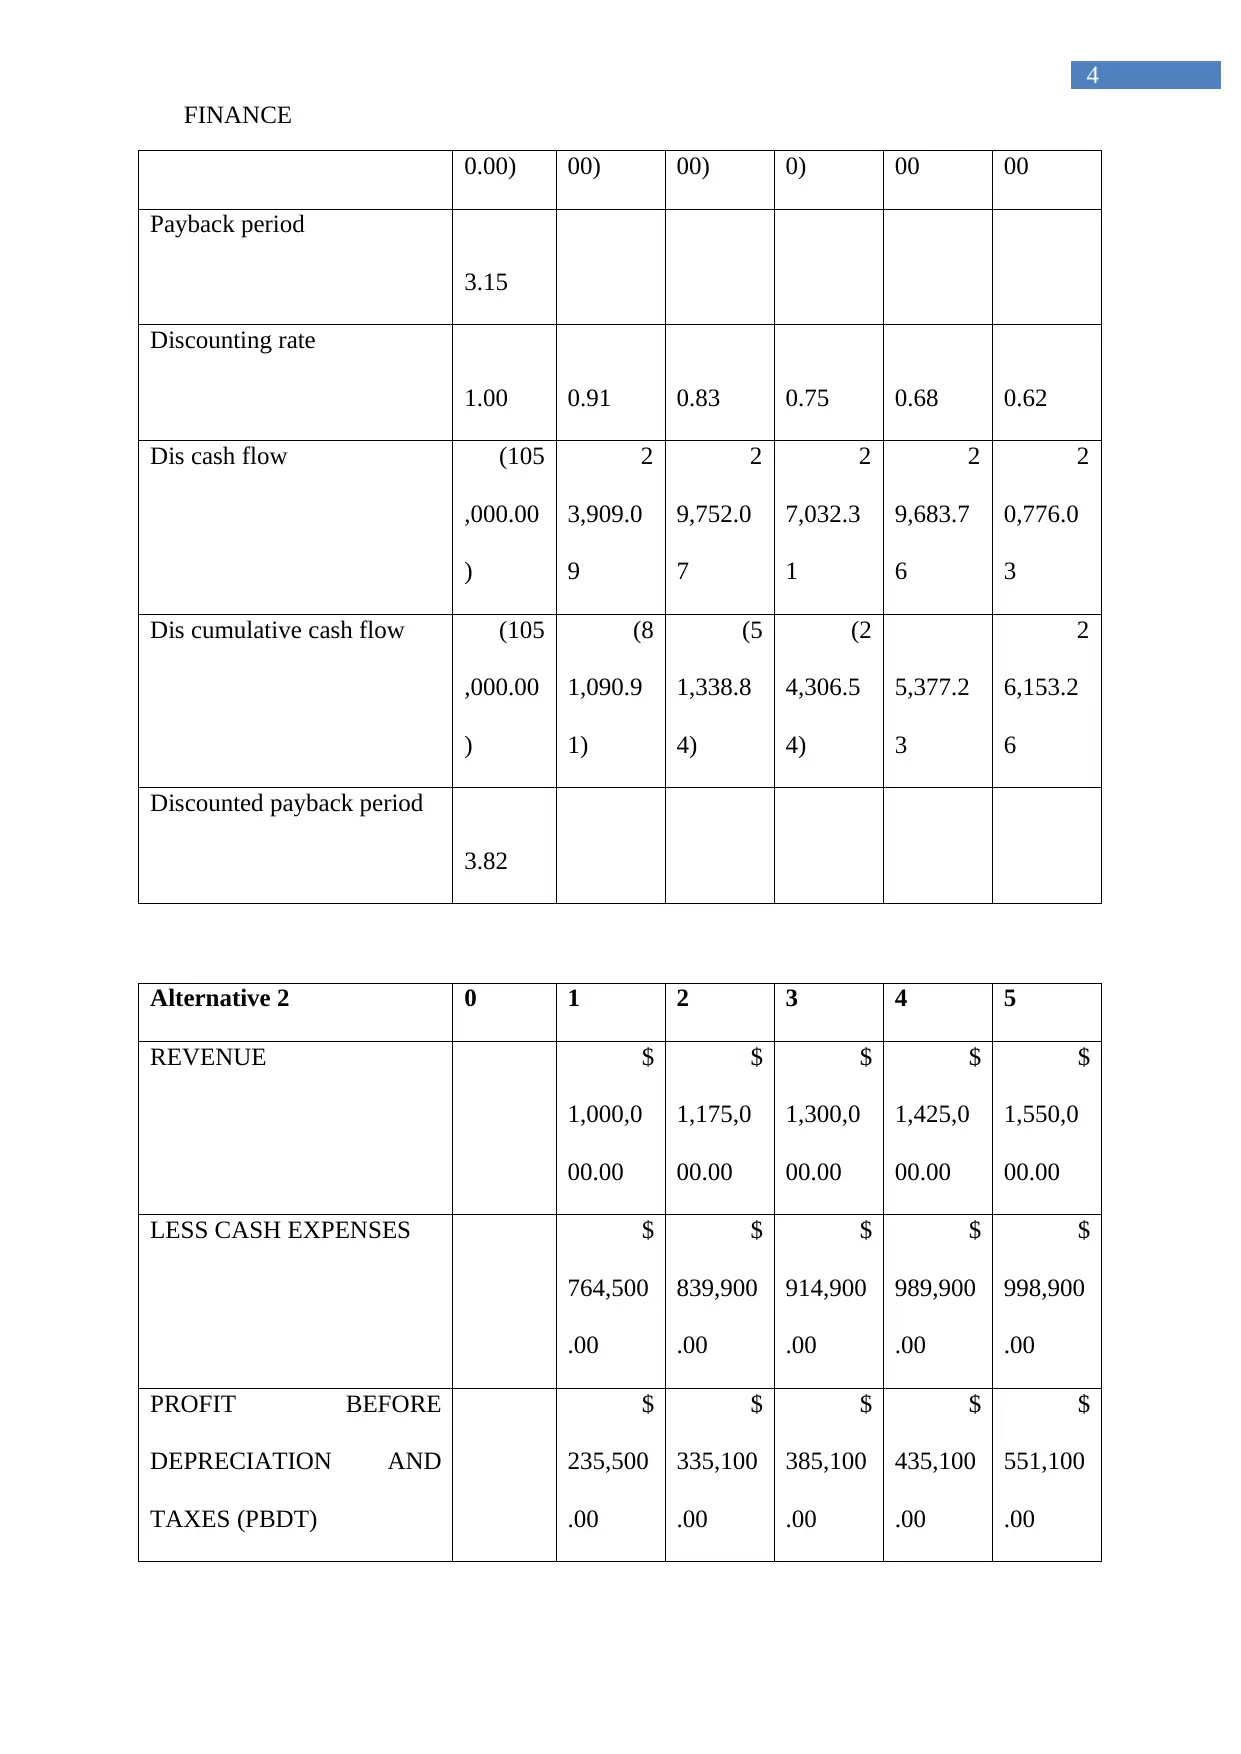
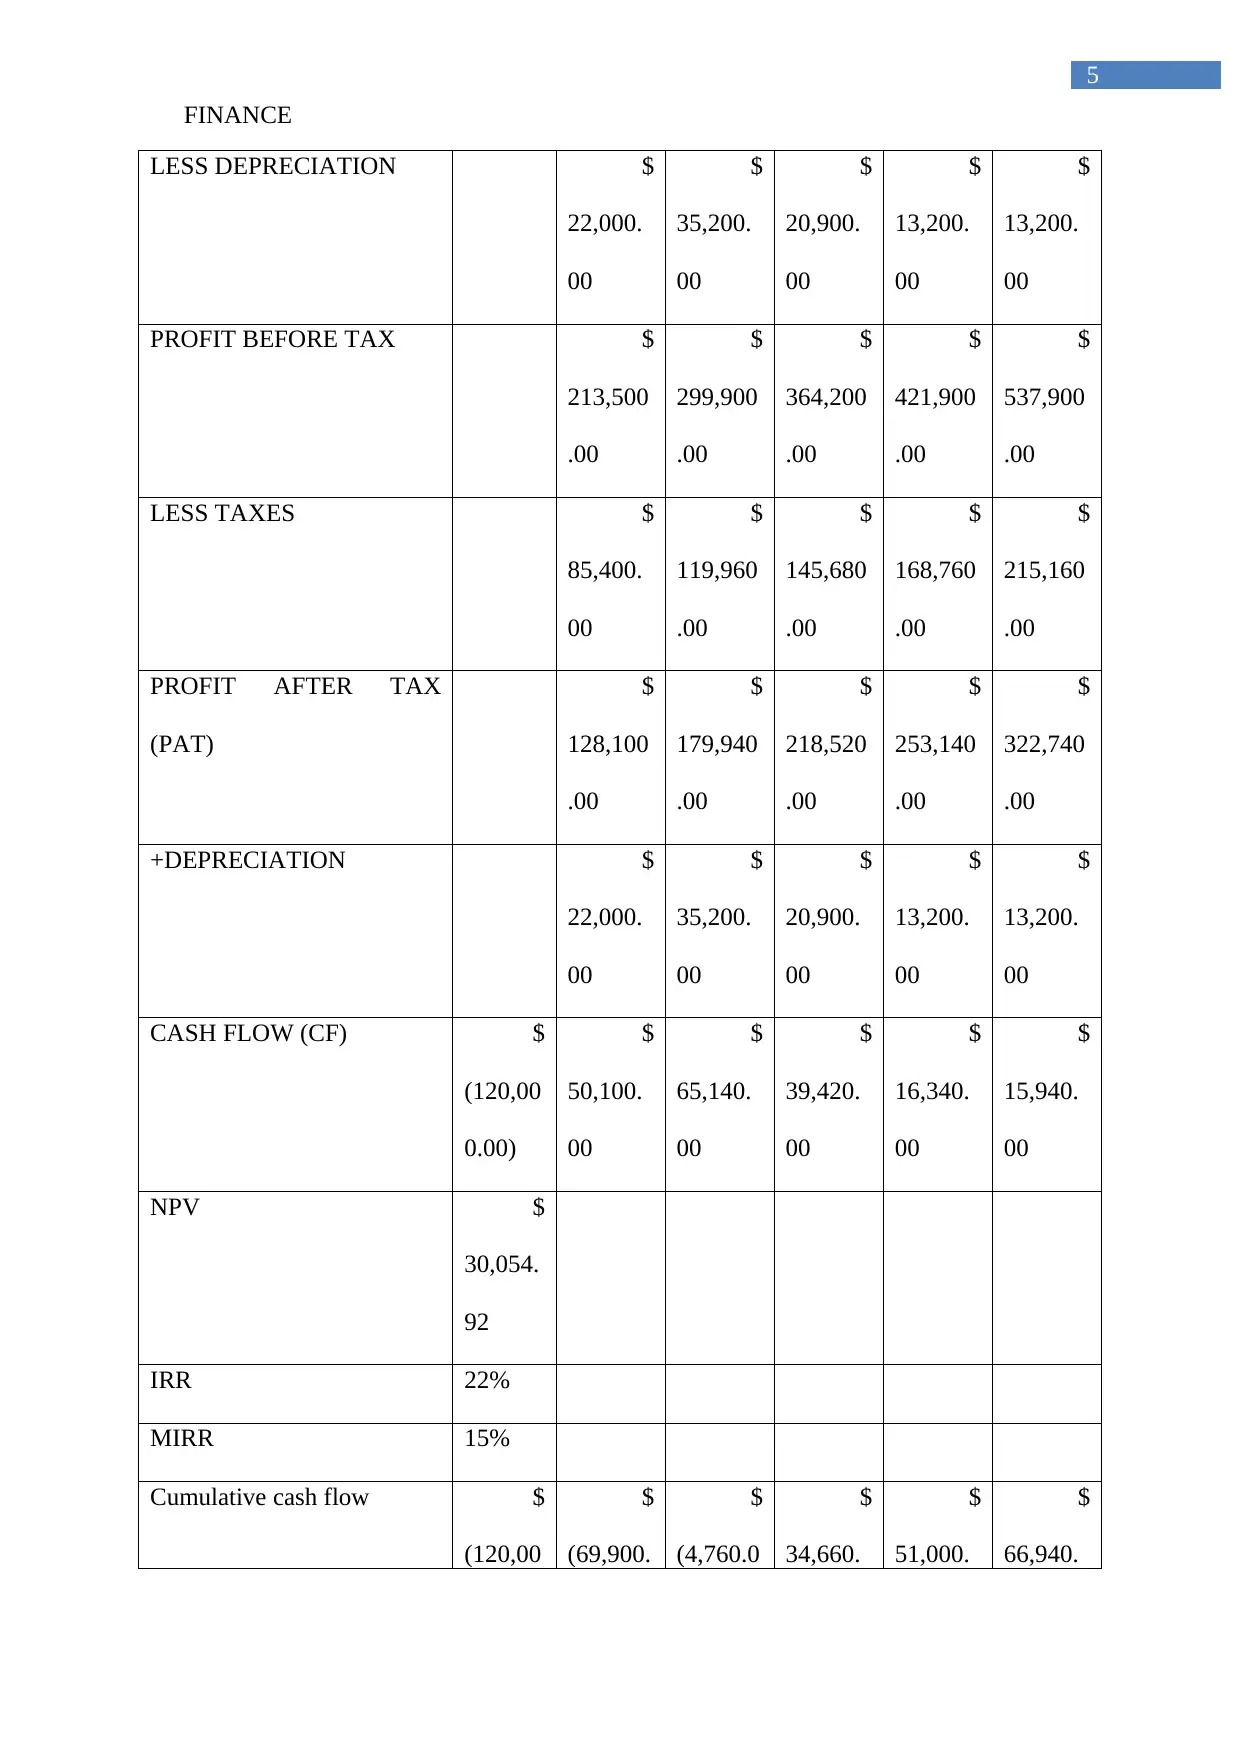
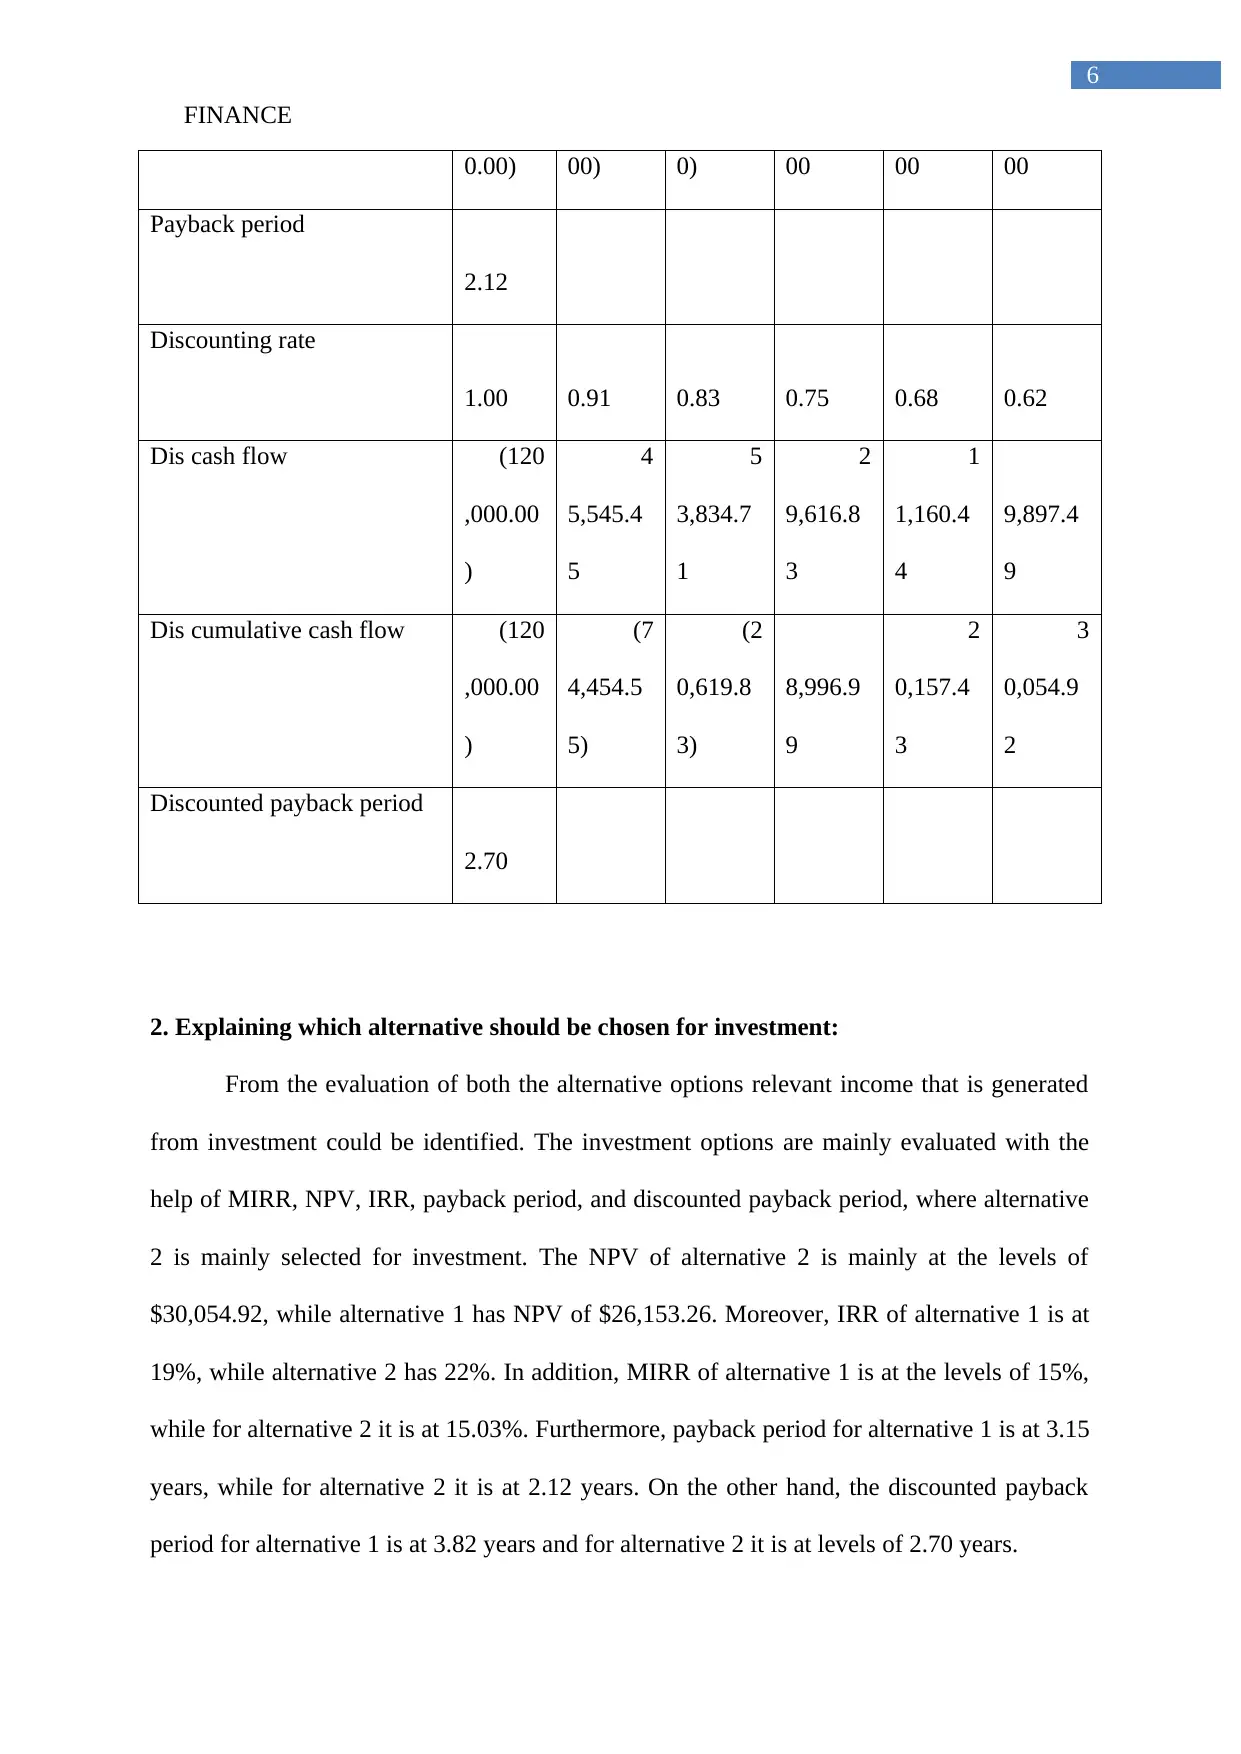
This report provides a detailed financial analysis of two investment alternatives, focusing on calculating and interpreting key metrics such as Net Present Value (NPV), Internal Rate of Return (IRR), Modified Internal Rate of Return (MIRR), payback period, and discounted payback period. The analysis involves projecting revenues, expenses, depreciation, and taxes for each alternative over a five-year period to determine cash flows. The report concludes that Alternative 2 is the more favorable investment option due to its higher NPV ($30,054.92 vs. $26,153.26), higher IRR (22% vs. 19%), and shorter payback periods (2.12 years vs. 3.15 years, and 2.70 years vs 3.82 years for discounted payback). The report recommends that Clark Upholstery Company adopt Alternative 2 to maximize returns and increase revenue, aligning with investment appraisal techniques that support higher profitability.
Document Page
\Running head: FINANCE
Finance
Name of the Student:
Name of the University:
Authors Note:
tabler-icon-diamond-filled.svg

Paraphrase This Document

Need a fresh take? Get an instant paraphrase of this document with our AI Paraphraser
Document Page
FINANCE
1
Table of Contents
1. Finding NPV, IRR, MIRR, payback and discounted payback for both the alternatives:......2
2. Explaining which alternative should be chosen for investment:............................................6
Reference:..................................................................................................................................8
Document Page
FINANCE
2
1. Finding NPV, IRR, MIRR, payback and discounted payback for both the
alternatives:
Initial Investment Alternative 1 Alternative 2
Cost of asset $ 90,000.00 $ 100,000.00
additional cost $ - $ 10,000.00
Total cost $ 90,000.00 $ 110,000.00
Proceeds from sale of old machine $ (20,000.00)
tax on sales $ 8,000.00
Changes in working capital $ 15,000.00 $ 22,000.00
Total investment $ 105,000.00 $ 120,000.00
Alternative 1 0 1 2 3 4 5
REVENUE $
1,000,0
00.00
$
1,175,0
00.00
$
1,300,0
00.00
$
1,425,0
00.00
$
1,550,0
00.00
LESS CASH EXPENSES $
801,500
.00
$
884,200
.00
$
918,100
.00
$
943,100
.00
$
968,100
.00
PROFIT BEFORE
DEPRECIATION AND
TAXES (PBDT)
$
198,500
.00
$
290,800
.00
$
381,900
.00
$
481,900
.00
$
581,900
.00
Document Page
FINANCE
3
LESS DEPRECIATION $
18,000.
00
$
28,800.
00
$
17,100.
00
$
10,800.
00
$
10,800.
00
PROFIT BEFORE TAX $
180,500
.00
$
262,000
.00
$
364,800
.00
$
471,100
.00
$
571,100
.00
LESS TAXES $
72,200.
00
$
104,800
.00
$
145,920
.00
$
188,440
.00
$
228,440
.00
PROFIT AFTER TAX
(PAT)
$
108,300
.00
$
157,200
.00
$
218,880
.00
$
282,660
.00
$
342,660
.00
+DEPRECIATION $
18,000.
00
$
28,800.
00
$
17,100.
00
$
10,800.
00
$
10,800.
00
CASH FLOW (CF) $
(105,00
0.00)
$
26,300.
00
$
36,000.
00
$
35,980.
00
$
43,460.
00
$
33,460.
00
NPV $
26,153.
26
IRR 19%
MIRR 15%
Cumulative cash flow $
(105,00
$
(78,700.
$
(42,700.
$
(6,720.0
$
36,740.
$
70,200.
tabler-icon-diamond-filled.svg

Paraphrase This Document

Need a fresh take? Get an instant paraphrase of this document with our AI Paraphraser
Document Page
FINANCE
4
0.00) 00) 00) 0) 00 00
Payback period
3.15
Discounting rate
1.00 0.91 0.83 0.75 0.68 0.62
Dis cash flow (105
,000.00
)
2
3,909.0
9
2
9,752.0
7
2
7,032.3
1
2
9,683.7
6
2
0,776.0
3
Dis cumulative cash flow (105
,000.00
)
(8
1,090.9
1)
(5
1,338.8
4)
(2
4,306.5
4)
5,377.2
3
2
6,153.2
6
Discounted payback period
3.82
Alternative 2 0 1 2 3 4 5
REVENUE $
1,000,0
00.00
$
1,175,0
00.00
$
1,300,0
00.00
$
1,425,0
00.00
$
1,550,0
00.00
LESS CASH EXPENSES $
764,500
.00
$
839,900
.00
$
914,900
.00
$
989,900
.00
$
998,900
.00
PROFIT BEFORE
DEPRECIATION AND
TAXES (PBDT)
$
235,500
.00
$
335,100
.00
$
385,100
.00
$
435,100
.00
$
551,100
.00
Document Page
FINANCE
5
LESS DEPRECIATION $
22,000.
00
$
35,200.
00
$
20,900.
00
$
13,200.
00
$
13,200.
00
PROFIT BEFORE TAX $
213,500
.00
$
299,900
.00
$
364,200
.00
$
421,900
.00
$
537,900
.00
LESS TAXES $
85,400.
00
$
119,960
.00
$
145,680
.00
$
168,760
.00
$
215,160
.00
PROFIT AFTER TAX
(PAT)
$
128,100
.00
$
179,940
.00
$
218,520
.00
$
253,140
.00
$
322,740
.00
+DEPRECIATION $
22,000.
00
$
35,200.
00
$
20,900.
00
$
13,200.
00
$
13,200.
00
CASH FLOW (CF) $
(120,00
0.00)
$
50,100.
00
$
65,140.
00
$
39,420.
00
$
16,340.
00
$
15,940.
00
NPV $
30,054.
92
IRR 22%
MIRR 15%
Cumulative cash flow $
(120,00
$
(69,900.
$
(4,760.0
$
34,660.
$
51,000.
$
66,940.
Document Page
FINANCE
6
0.00) 00) 0) 00 00 00
Payback period
2.12
Discounting rate
1.00 0.91 0.83 0.75 0.68 0.62
Dis cash flow (120
,000.00
)
4
5,545.4
5
5
3,834.7
1
2
9,616.8
3
1
1,160.4
4
9,897.4
9
Dis cumulative cash flow (120
,000.00
)
(7
4,454.5
5)
(2
0,619.8
3)
8,996.9
9
2
0,157.4
3
3
0,054.9
2
Discounted payback period
2.70
2. Explaining which alternative should be chosen for investment:
From the evaluation of both the alternative options relevant income that is generated
from investment could be identified. The investment options are mainly evaluated with the
help of MIRR, NPV, IRR, payback period, and discounted payback period, where alternative
2 is mainly selected for investment. The NPV of alternative 2 is mainly at the levels of
$30,054.92, while alternative 1 has NPV of $26,153.26. Moreover, IRR of alternative 1 is at
19%, while alternative 2 has 22%. In addition, MIRR of alternative 1 is at the levels of 15%,
while for alternative 2 it is at 15.03%. Furthermore, payback period for alternative 1 is at 3.15
years, while for alternative 2 it is at 2.12 years. On the other hand, the discounted payback
period for alternative 1 is at 3.82 years and for alternative 2 it is at levels of 2.70 years.
tabler-icon-diamond-filled.svg

Paraphrase This Document

Need a fresh take? Get an instant paraphrase of this document with our AI Paraphraser
Document Page
FINANCE
7
Hence, from the evaluation of above investment appraisal techniques alternative 2 is
mainly identified to be the most appropriate option for investment, which could help in
generating higher rate of return from investment. Clark Upholstery Company needs to adopt
alternative 2 for increasing their income form investment and raise their revenue levels. In
this context, Baum & Crosby (2014) mentioned that with the use of investment appraisal
techniques companies can generate higher rate of return from investment. However, Vesty,
Telgenkamp & Roscoe (2015) argued that investment appraisal techniques mainly lose th9ier
friction if financial managers do not estimate adequate values for the project.
Document Page
FINANCE
8
Reference:
Baum, A. E., & Crosby, N. (2014). Property investment appraisal. John Wiley & Sons.
Vesty, G. M., Telgenkamp, A., & Roscoe, P. J. (2015). Creating numbers: carbon and capital
investment. Accounting, Auditing & Accountability Journal, 28(3), 302-324.
chevron_up_icon
1 out of 9
circle_padding
hide_on_mobile
zoom_out_icon
[object Object]