Finance TMA 02: Investment Appraisal and Valuation of Tata Steel
VerifiedAdded on 2022/09/16
|10
|2870
|22
Homework Assignment
AI Summary
This assignment solution for Finance TMA 02 focuses on the financial analysis of Tata Steel Limited. It begins by discussing the importance of using cash flows over profits in investment appraisal, differentiating between relevant and irrelevant cash flows, and explaining the impact of inflation. The solution then presents a discounted cash flow (DCF) analysis to determine the company's fair value per share, including calculations for WACC, enterprise value, and terminal value. Furthermore, the assignment explores the concept of enterprise value and the adjusted book value approach for valuation, along with the application of market multiple ratios like EV/EBITDA. The document provides detailed calculations and explanations, making it a comprehensive resource for understanding financial analysis and valuation techniques within the context of a real-world company.

FINANCE
TMA 02
Tata Steel Limited
TMA 02
Tata Steel Limited
Paraphrase This Document
Need a fresh take? Get an instant paraphrase of this document with our AI Paraphraser
Answer 1
Part a
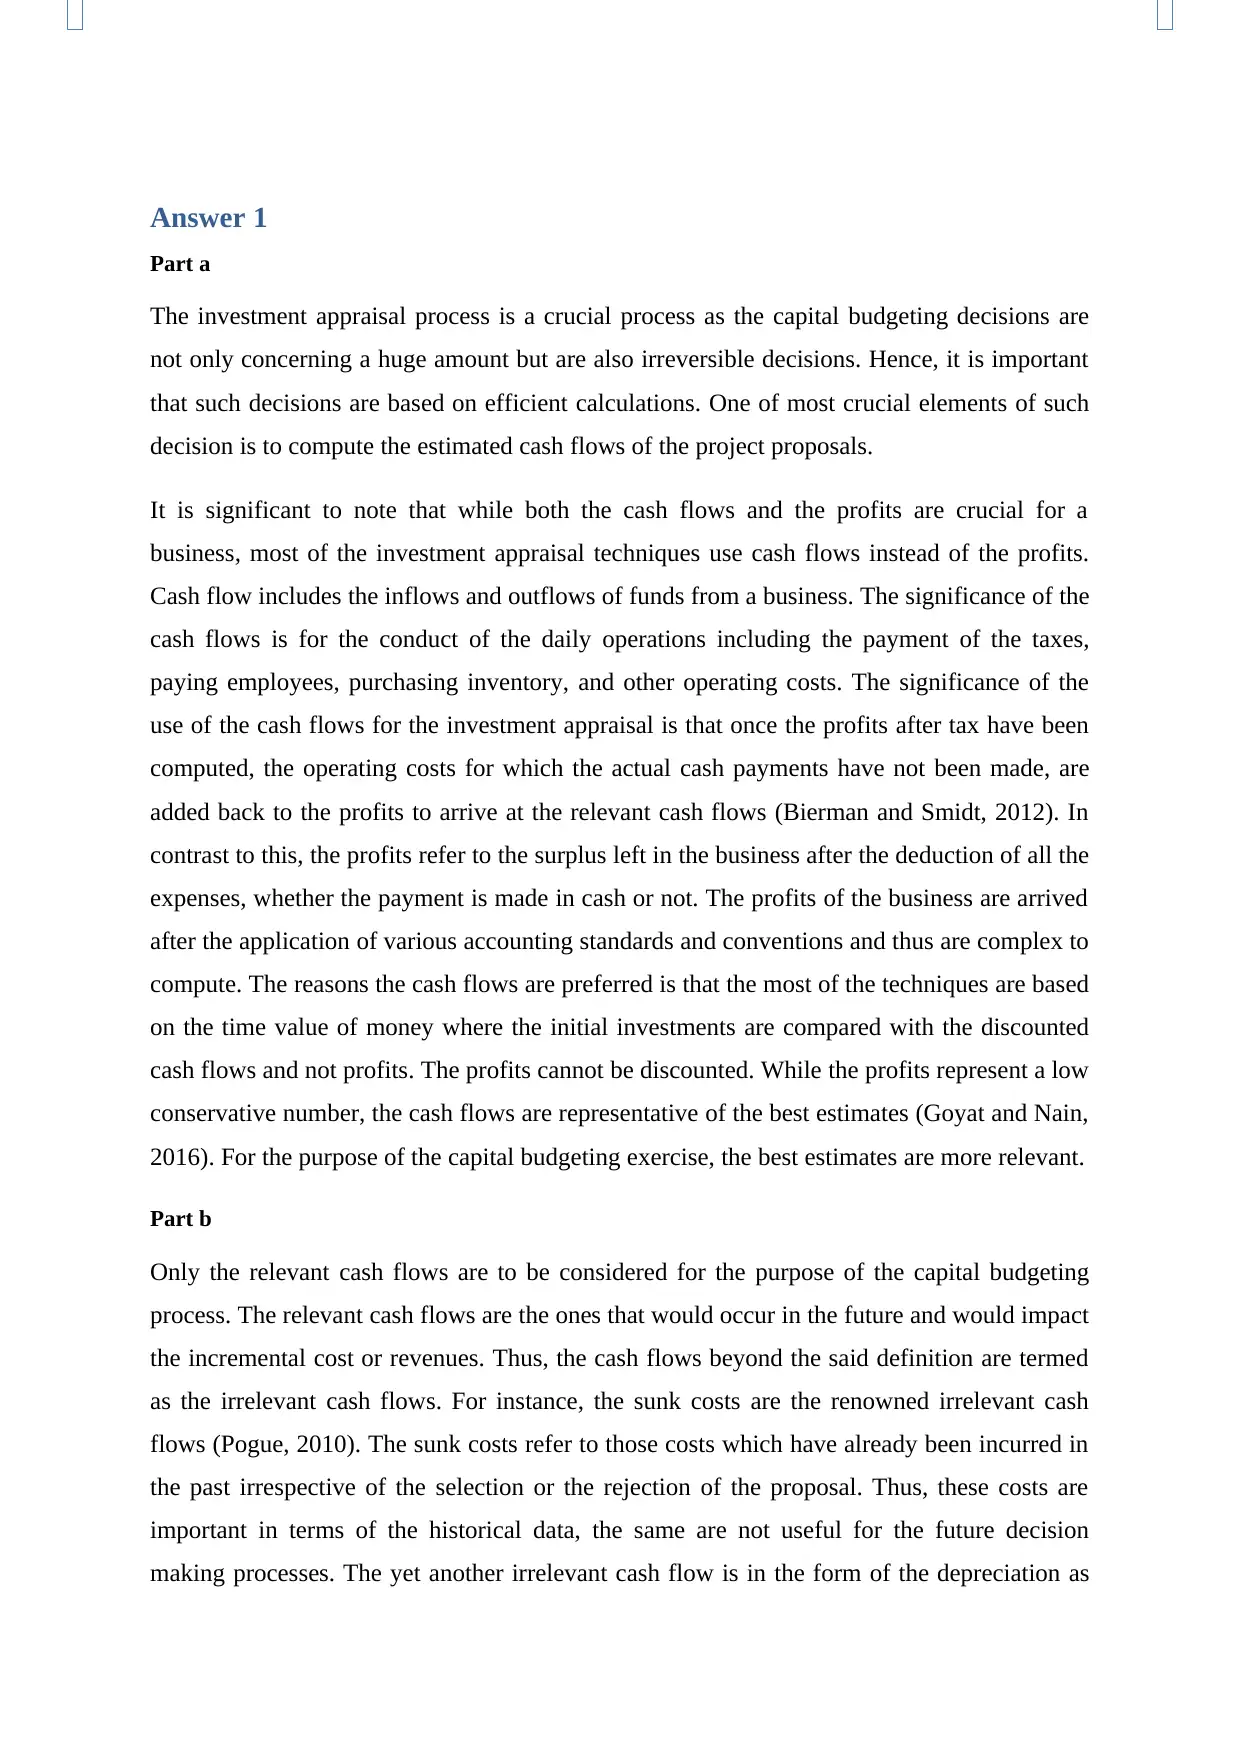
The investment appraisal process is a crucial process as the capital budgeting decisions are
not only concerning a huge amount but are also irreversible decisions. Hence, it is important
that such decisions are based on efficient calculations. One of most crucial elements of such
decision is to compute the estimated cash flows of the project proposals.
It is significant to note that while both the cash flows and the profits are crucial for a
business, most of the investment appraisal techniques use cash flows instead of the profits.
Cash flow includes the inflows and outflows of funds from a business. The significance of the
cash flows is for the conduct of the daily operations including the payment of the taxes,
paying employees, purchasing inventory, and other operating costs. The significance of the
use of the cash flows for the investment appraisal is that once the profits after tax have been
computed, the operating costs for which the actual cash payments have not been made, are
added back to the profits to arrive at the relevant cash flows (Bierman and Smidt, 2012). In
contrast to this, the profits refer to the surplus left in the business after the deduction of all the
expenses, whether the payment is made in cash or not. The profits of the business are arrived
after the application of various accounting standards and conventions and thus are complex to
compute. The reasons the cash flows are preferred is that the most of the techniques are based
on the time value of money where the initial investments are compared with the discounted
cash flows and not profits. The profits cannot be discounted. While the profits represent a low
conservative number, the cash flows are representative of the best estimates (Goyat and Nain,
2016). For the purpose of the capital budgeting exercise, the best estimates are more relevant.
Part b
Only the relevant cash flows are to be considered for the purpose of the capital budgeting
process. The relevant cash flows are the ones that would occur in the future and would impact
the incremental cost or revenues. Thus, the cash flows beyond the said definition are termed
as the irrelevant cash flows. For instance, the sunk costs are the renowned irrelevant cash
flows (Pogue, 2010). The sunk costs refer to those costs which have already been incurred in
the past irrespective of the selection or the rejection of the proposal. Thus, these costs are
important in terms of the historical data, the same are not useful for the future decision
making processes. The yet another irrelevant cash flow is in the form of the depreciation as
Part a
The investment appraisal process is a crucial process as the capital budgeting decisions are
not only concerning a huge amount but are also irreversible decisions. Hence, it is important
that such decisions are based on efficient calculations. One of most crucial elements of such
decision is to compute the estimated cash flows of the project proposals.
It is significant to note that while both the cash flows and the profits are crucial for a
business, most of the investment appraisal techniques use cash flows instead of the profits.
Cash flow includes the inflows and outflows of funds from a business. The significance of the
cash flows is for the conduct of the daily operations including the payment of the taxes,
paying employees, purchasing inventory, and other operating costs. The significance of the
use of the cash flows for the investment appraisal is that once the profits after tax have been
computed, the operating costs for which the actual cash payments have not been made, are
added back to the profits to arrive at the relevant cash flows (Bierman and Smidt, 2012). In
contrast to this, the profits refer to the surplus left in the business after the deduction of all the
expenses, whether the payment is made in cash or not. The profits of the business are arrived
after the application of various accounting standards and conventions and thus are complex to
compute. The reasons the cash flows are preferred is that the most of the techniques are based
on the time value of money where the initial investments are compared with the discounted
cash flows and not profits. The profits cannot be discounted. While the profits represent a low
conservative number, the cash flows are representative of the best estimates (Goyat and Nain,
2016). For the purpose of the capital budgeting exercise, the best estimates are more relevant.
Part b
Only the relevant cash flows are to be considered for the purpose of the capital budgeting
process. The relevant cash flows are the ones that would occur in the future and would impact
the incremental cost or revenues. Thus, the cash flows beyond the said definition are termed
as the irrelevant cash flows. For instance, the sunk costs are the renowned irrelevant cash
flows (Pogue, 2010). The sunk costs refer to those costs which have already been incurred in
the past irrespective of the selection or the rejection of the proposal. Thus, these costs are
important in terms of the historical data, the same are not useful for the future decision
making processes. The yet another irrelevant cash flow is in the form of the depreciation as
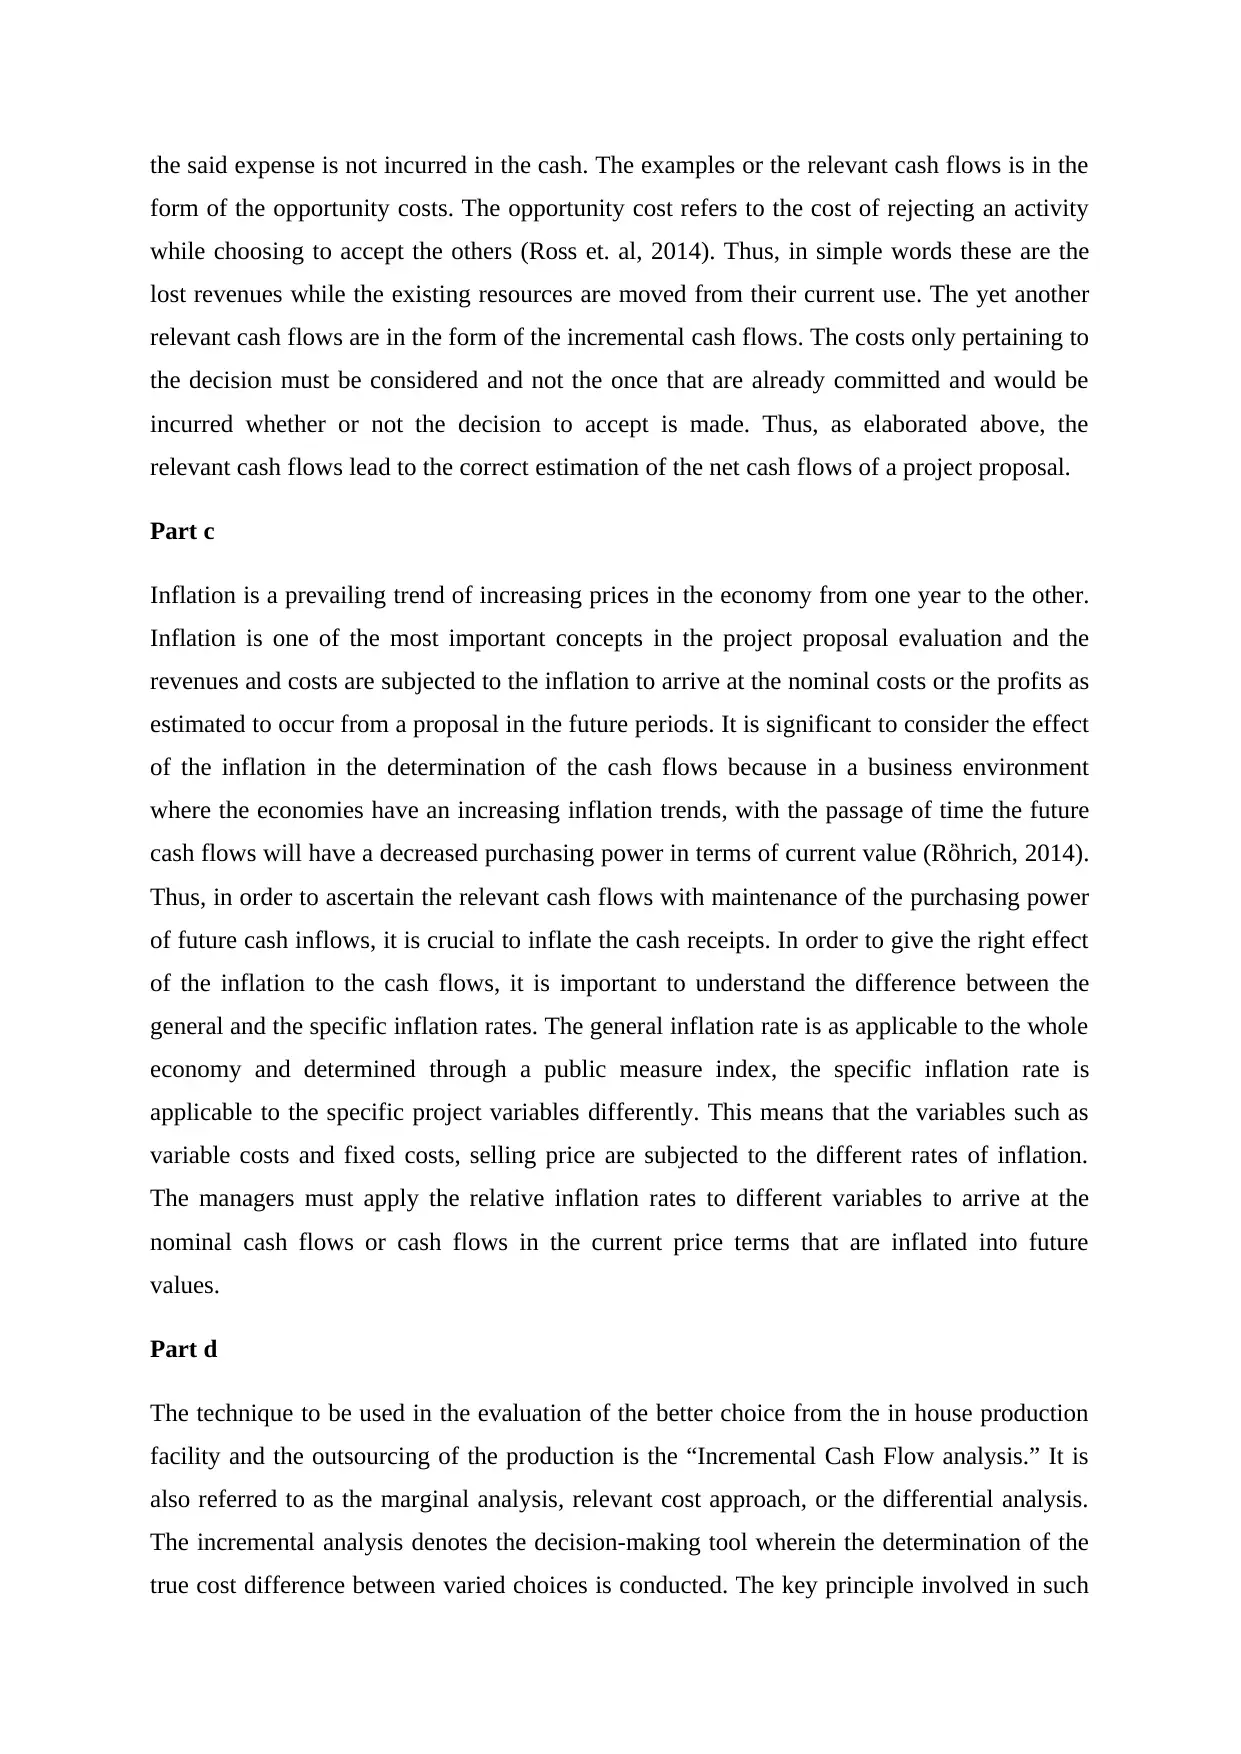
the said expense is not incurred in the cash. The examples or the relevant cash flows is in the
form of the opportunity costs. The opportunity cost refers to the cost of rejecting an activity
while choosing to accept the others (Ross et. al, 2014). Thus, in simple words these are the
lost revenues while the existing resources are moved from their current use. The yet another
relevant cash flows are in the form of the incremental cash flows. The costs only pertaining to
the decision must be considered and not the once that are already committed and would be
incurred whether or not the decision to accept is made. Thus, as elaborated above, the
relevant cash flows lead to the correct estimation of the net cash flows of a project proposal.
Part c
Inflation is a prevailing trend of increasing prices in the economy from one year to the other.
Inflation is one of the most important concepts in the project proposal evaluation and the
revenues and costs are subjected to the inflation to arrive at the nominal costs or the profits as
estimated to occur from a proposal in the future periods. It is significant to consider the effect
of the inflation in the determination of the cash flows because in a business environment
where the economies have an increasing inflation trends, with the passage of time the future
cash flows will have a decreased purchasing power in terms of current value (Rὂhrich, 2014).
Thus, in order to ascertain the relevant cash flows with maintenance of the purchasing power
of future cash inflows, it is crucial to inflate the cash receipts. In order to give the right effect
of the inflation to the cash flows, it is important to understand the difference between the
general and the specific inflation rates. The general inflation rate is as applicable to the whole
economy and determined through a public measure index, the specific inflation rate is
applicable to the specific project variables differently. This means that the variables such as
variable costs and fixed costs, selling price are subjected to the different rates of inflation.
The managers must apply the relative inflation rates to different variables to arrive at the
nominal cash flows or cash flows in the current price terms that are inflated into future
values.
Part d
The technique to be used in the evaluation of the better choice from the in house production
facility and the outsourcing of the production is the “Incremental Cash Flow analysis.” It is
also referred to as the marginal analysis, relevant cost approach, or the differential analysis.
The incremental analysis denotes the decision-making tool wherein the determination of the
true cost difference between varied choices is conducted. The key principle involved in such
⊘ This is a preview!⊘
Do you want full access?
Subscribe today to unlock all pages.
Trusted by 1+ million students worldwide
analysis is that the sunk cost or past cost are ignored. It is to be noted that such technique
involves the consideration of both the qualitative as well as the quantitative factors. The
quantitative factors to be involved are the change in the purchase cost per unit, production
cost per unit, incremental fixed costs if any, changes in the production capacity available to
the business and others (Scott, 2012). The qualitative factors involved in the evaluation are
the impact of the decision on suppliers in the form of partnership or discounts, control over
quality of the component, reliability of suppliers, and changes in the customers’ expectations
apart from the others. Thus, both the factors are evaluated in relation to the in house and the
outsourcing proposals, and accordingly the decisions are reached.
Answer 2
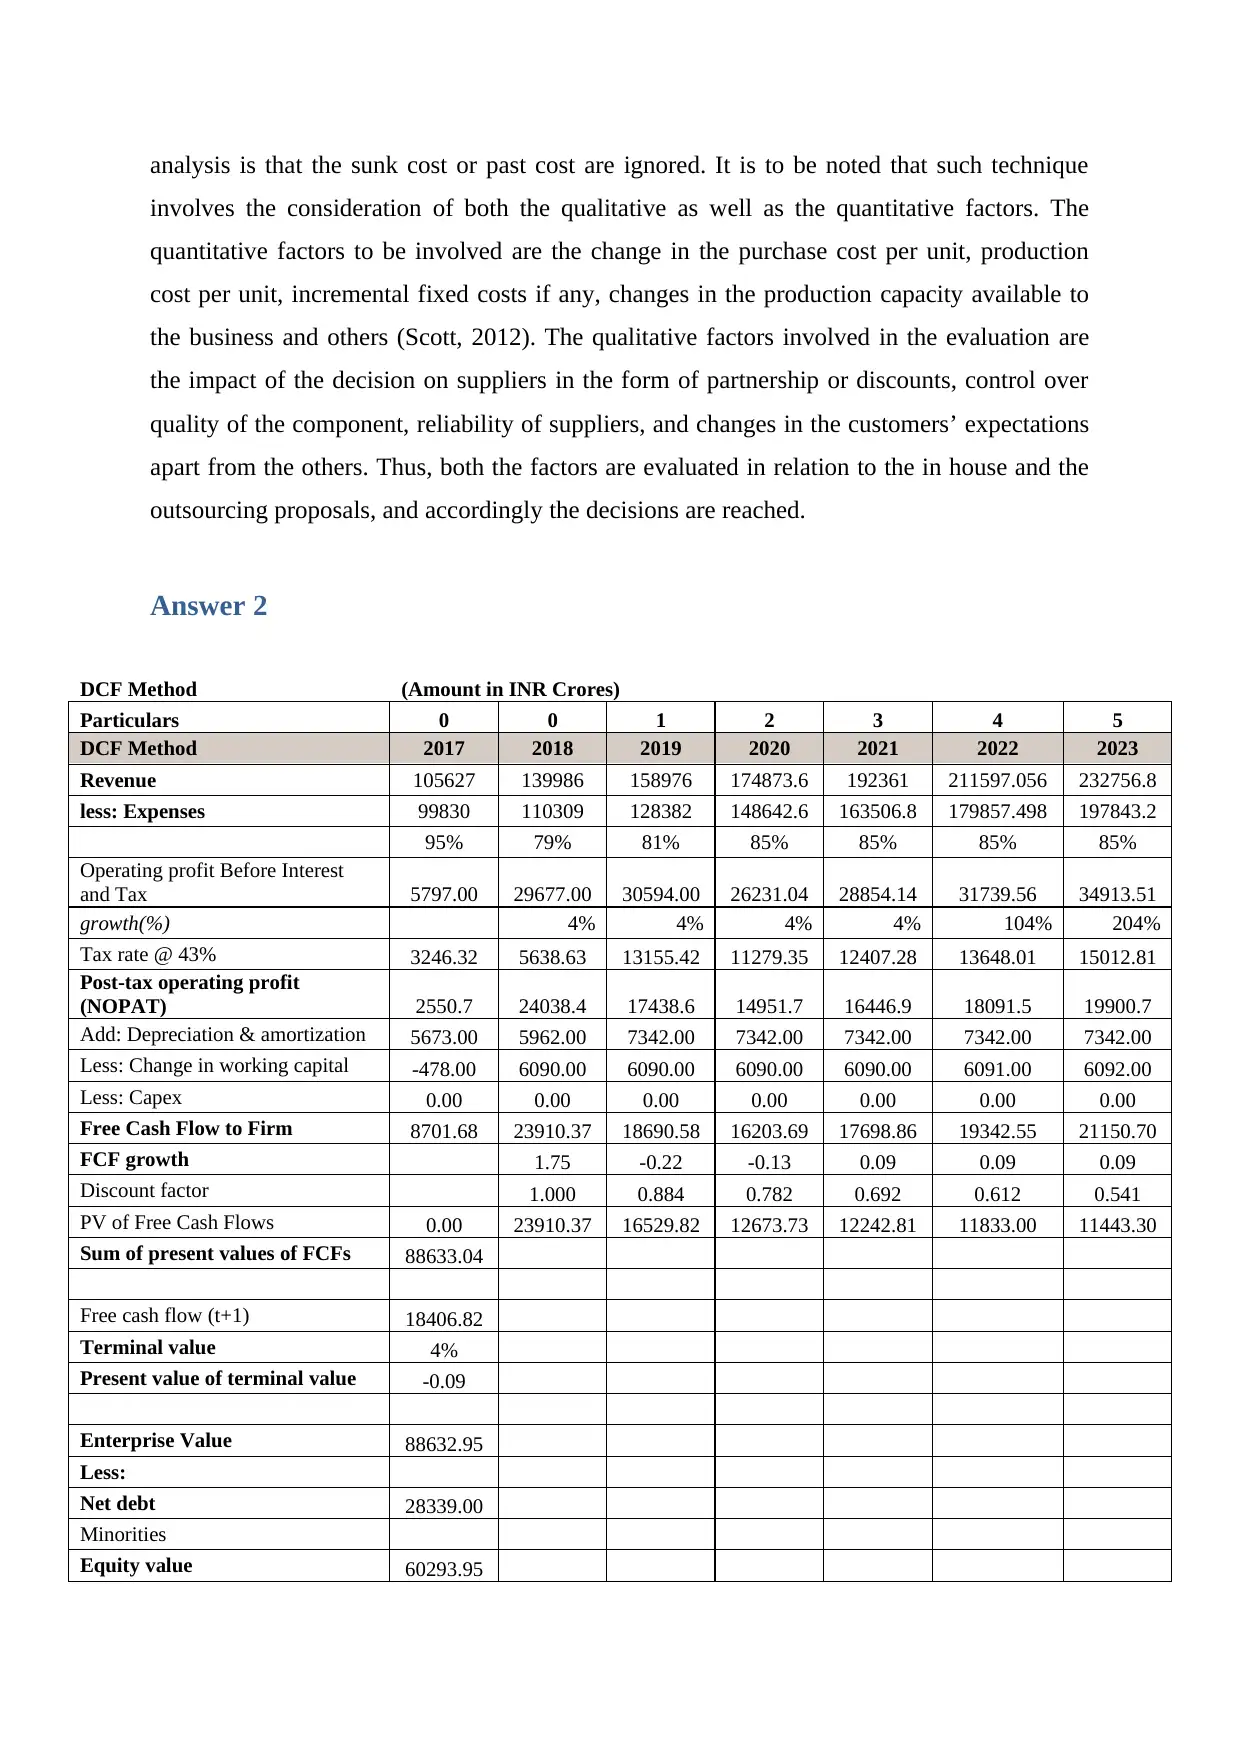
DCF Method (Amount in INR Crores)
Particulars 0 0 1 2 3 4 5
DCF Method 2017 2018 2019 2020 2021 2022 2023
Revenue 105627 139986 158976 174873.6 192361 211597.056 232756.8
less: Expenses 99830 110309 128382 148642.6 163506.8 179857.498 197843.2
95% 79% 81% 85% 85% 85% 85%
Operating profit Before Interest
and Tax 5797.00 29677.00 30594.00 26231.04 28854.14 31739.56 34913.51
growth(%) 4% 4% 4% 4% 104% 204%
Tax rate @ 43% 3246.32 5638.63 13155.42 11279.35 12407.28 13648.01 15012.81
Post-tax operating profit
(NOPAT) 2550.7 24038.4 17438.6 14951.7 16446.9 18091.5 19900.7
Add: Depreciation & amortization 5673.00 5962.00 7342.00 7342.00 7342.00 7342.00 7342.00
Less: Change in working capital -478.00 6090.00 6090.00 6090.00 6090.00 6091.00 6092.00
Less: Capex 0.00 0.00 0.00 0.00 0.00 0.00 0.00
Free Cash Flow to Firm 8701.68 23910.37 18690.58 16203.69 17698.86 19342.55 21150.70
FCF growth 1.75 -0.22 -0.13 0.09 0.09 0.09
Discount factor 1.000 0.884 0.782 0.692 0.612 0.541
PV of Free Cash Flows 0.00 23910.37 16529.82 12673.73 12242.81 11833.00 11443.30
Sum of present values of FCFs 88633.04
Free cash flow (t+1) 18406.82
Terminal value 4%
Present value of terminal value -0.09
Enterprise Value 88632.95
Less:
Net debt 28339.00
Minorities
Equity value 60293.95
involves the consideration of both the qualitative as well as the quantitative factors. The
quantitative factors to be involved are the change in the purchase cost per unit, production
cost per unit, incremental fixed costs if any, changes in the production capacity available to
the business and others (Scott, 2012). The qualitative factors involved in the evaluation are
the impact of the decision on suppliers in the form of partnership or discounts, control over
quality of the component, reliability of suppliers, and changes in the customers’ expectations
apart from the others. Thus, both the factors are evaluated in relation to the in house and the
outsourcing proposals, and accordingly the decisions are reached.
Answer 2
DCF Method (Amount in INR Crores)
Particulars 0 0 1 2 3 4 5
DCF Method 2017 2018 2019 2020 2021 2022 2023
Revenue 105627 139986 158976 174873.6 192361 211597.056 232756.8
less: Expenses 99830 110309 128382 148642.6 163506.8 179857.498 197843.2
95% 79% 81% 85% 85% 85% 85%
Operating profit Before Interest
and Tax 5797.00 29677.00 30594.00 26231.04 28854.14 31739.56 34913.51
growth(%) 4% 4% 4% 4% 104% 204%
Tax rate @ 43% 3246.32 5638.63 13155.42 11279.35 12407.28 13648.01 15012.81
Post-tax operating profit
(NOPAT) 2550.7 24038.4 17438.6 14951.7 16446.9 18091.5 19900.7
Add: Depreciation & amortization 5673.00 5962.00 7342.00 7342.00 7342.00 7342.00 7342.00
Less: Change in working capital -478.00 6090.00 6090.00 6090.00 6090.00 6091.00 6092.00
Less: Capex 0.00 0.00 0.00 0.00 0.00 0.00 0.00
Free Cash Flow to Firm 8701.68 23910.37 18690.58 16203.69 17698.86 19342.55 21150.70
FCF growth 1.75 -0.22 -0.13 0.09 0.09 0.09
Discount factor 1.000 0.884 0.782 0.692 0.612 0.541
PV of Free Cash Flows 0.00 23910.37 16529.82 12673.73 12242.81 11833.00 11443.30
Sum of present values of FCFs 88633.04
Free cash flow (t+1) 18406.82
Terminal value 4%
Present value of terminal value -0.09
Enterprise Value 88632.95
Less:
Net debt 28339.00
Minorities
Equity value 60293.95
Paraphrase This Document
Need a fresh take? Get an instant paraphrase of this document with our AI Paraphraser
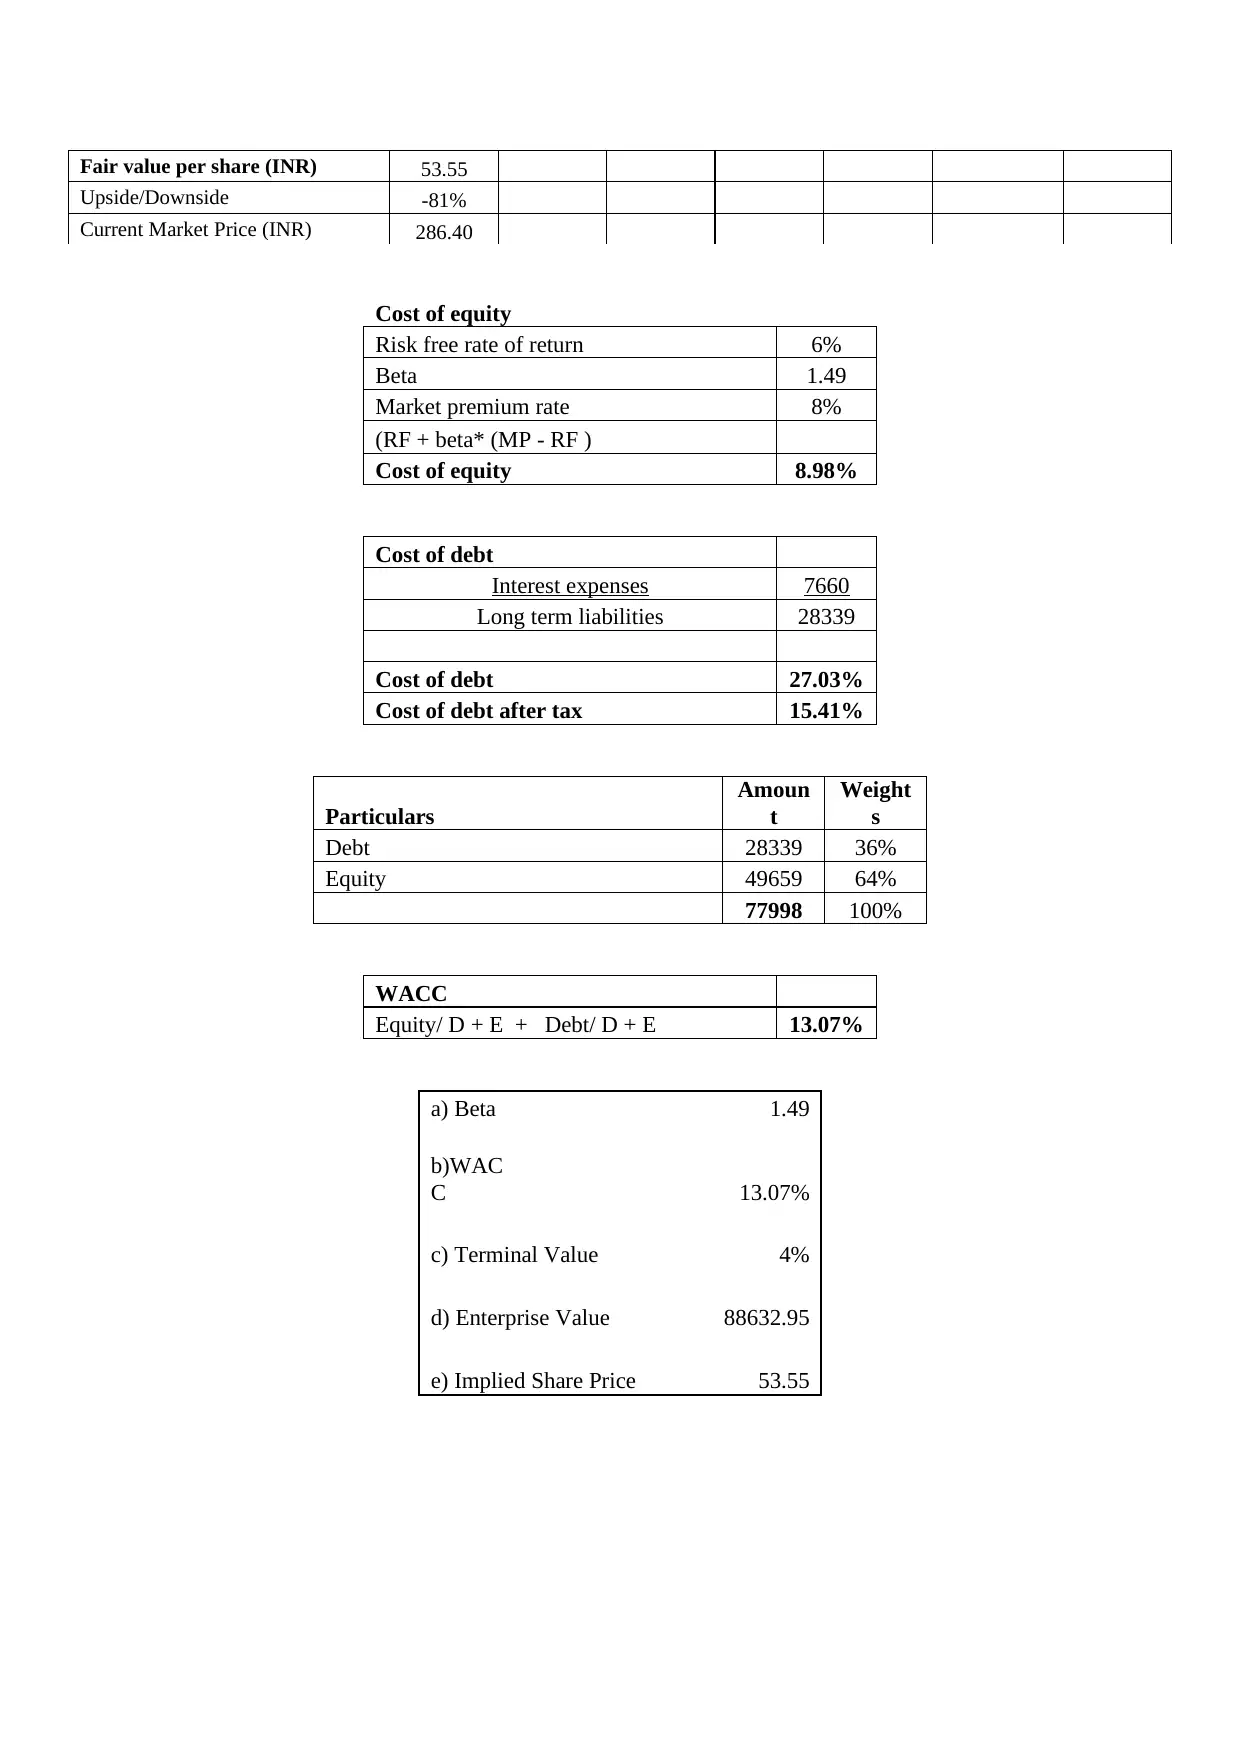
Fair value per share (INR) 53.55
Upside/Downside -81%
Current Market Price (INR) 286.40
Cost of equity
Risk free rate of return 6%
Beta 1.49
Market premium rate 8%
(RF + beta* (MP - RF )
Cost of equity 8.98%
Cost of debt
Interest expenses 7660
Long term liabilities 28339
Cost of debt 27.03%
Cost of debt after tax 15.41%
Particulars
Amoun
t
Weight
s
Debt 28339 36%
Equity 49659 64%
77998 100%
WACC
Equity/ D + E + Debt/ D + E 13.07%
a) Beta 1.49
b)WAC
C 13.07%
c) Terminal Value 4%
d) Enterprise Value 88632.95
e) Implied Share Price 53.55
Answer 3
Part a
The enterprise value, the economic value or the EV denotes an economic measure of the
value of the business in the market. It is more comprehensive measure of the valuation of the
total value of the firm than the market capitalization. This is because the market capitalization
focuses only on the equity and in contrast the enterprise value focuses on the assets as well as
the liabilities of the business. One of the approaches followed by the managers is to use the
adjusted book value approach to value the assets and liabilities of the company. It is to be
noted that the book value of any asset highlights its historical cost. It does not lead to the
correct representation of the values of the assets and liabilities of the business. Thus, to take
the assets and liabilities close to the economic values, the adjusted book value approach is
followed. Under the adjusted book value approach valuation of all the tangible assets of the
organisation including the fixed assets, Land is and others is done at current market price to
reflect the true market value of the same. For instance, the valuation of the Buildings is done
on the replacement cost, rather the purchase price under the adjusted book value method. In
addition, under this method, the appropriate allowances for depreciation and other
deterioration are to be made against the assets for the true value to be ascertained. Thus, the
assets are valued at net of depreciation and allowances, at the prevailing market prices. Thus,
it can be concluded that the adjusted book value takes the values of the assets and liabilities
close to their economic values as opposed to the existing book values.
In order to arrive at the economic value of the company Reliance for the financial year ended
on 2019, the following adjustments and information would be required. The first step is to
access the financial statements of the entity for the relevant period and go to the balance sheet
section. The next step calls for the determination of the fair value of the assets. The fixed
assets such as the Property, Plant and the Equipment which valued at INR 5,88,61,70,000
(thousands) must be valued at their market prices. The market prices of the above can be
ascertained through the information of the prices of the similar assets in the market today.
The replacement cost of the buildings as ascertained with the aid of the registered valuer can
be determined to mark it at the market price. Alternatively first the book value can be
calculated and then the adjustments can be made for the appraised value or the revaluation of
the assets. The next step calls for access of the section “Off Balance Sheet Items” of the
balance sheet. This section represents the assets that are not the part of the balance sheet and
the nature of the same. The adjustments must be made to the fair value of the assets with the
⊘ This is a preview!⊘
Do you want full access?
Subscribe today to unlock all pages.
Trusted by 1+ million students worldwide
Off Balance Sheet Items to arrive at the adjusted book values which are close to the economic
value.
Part b
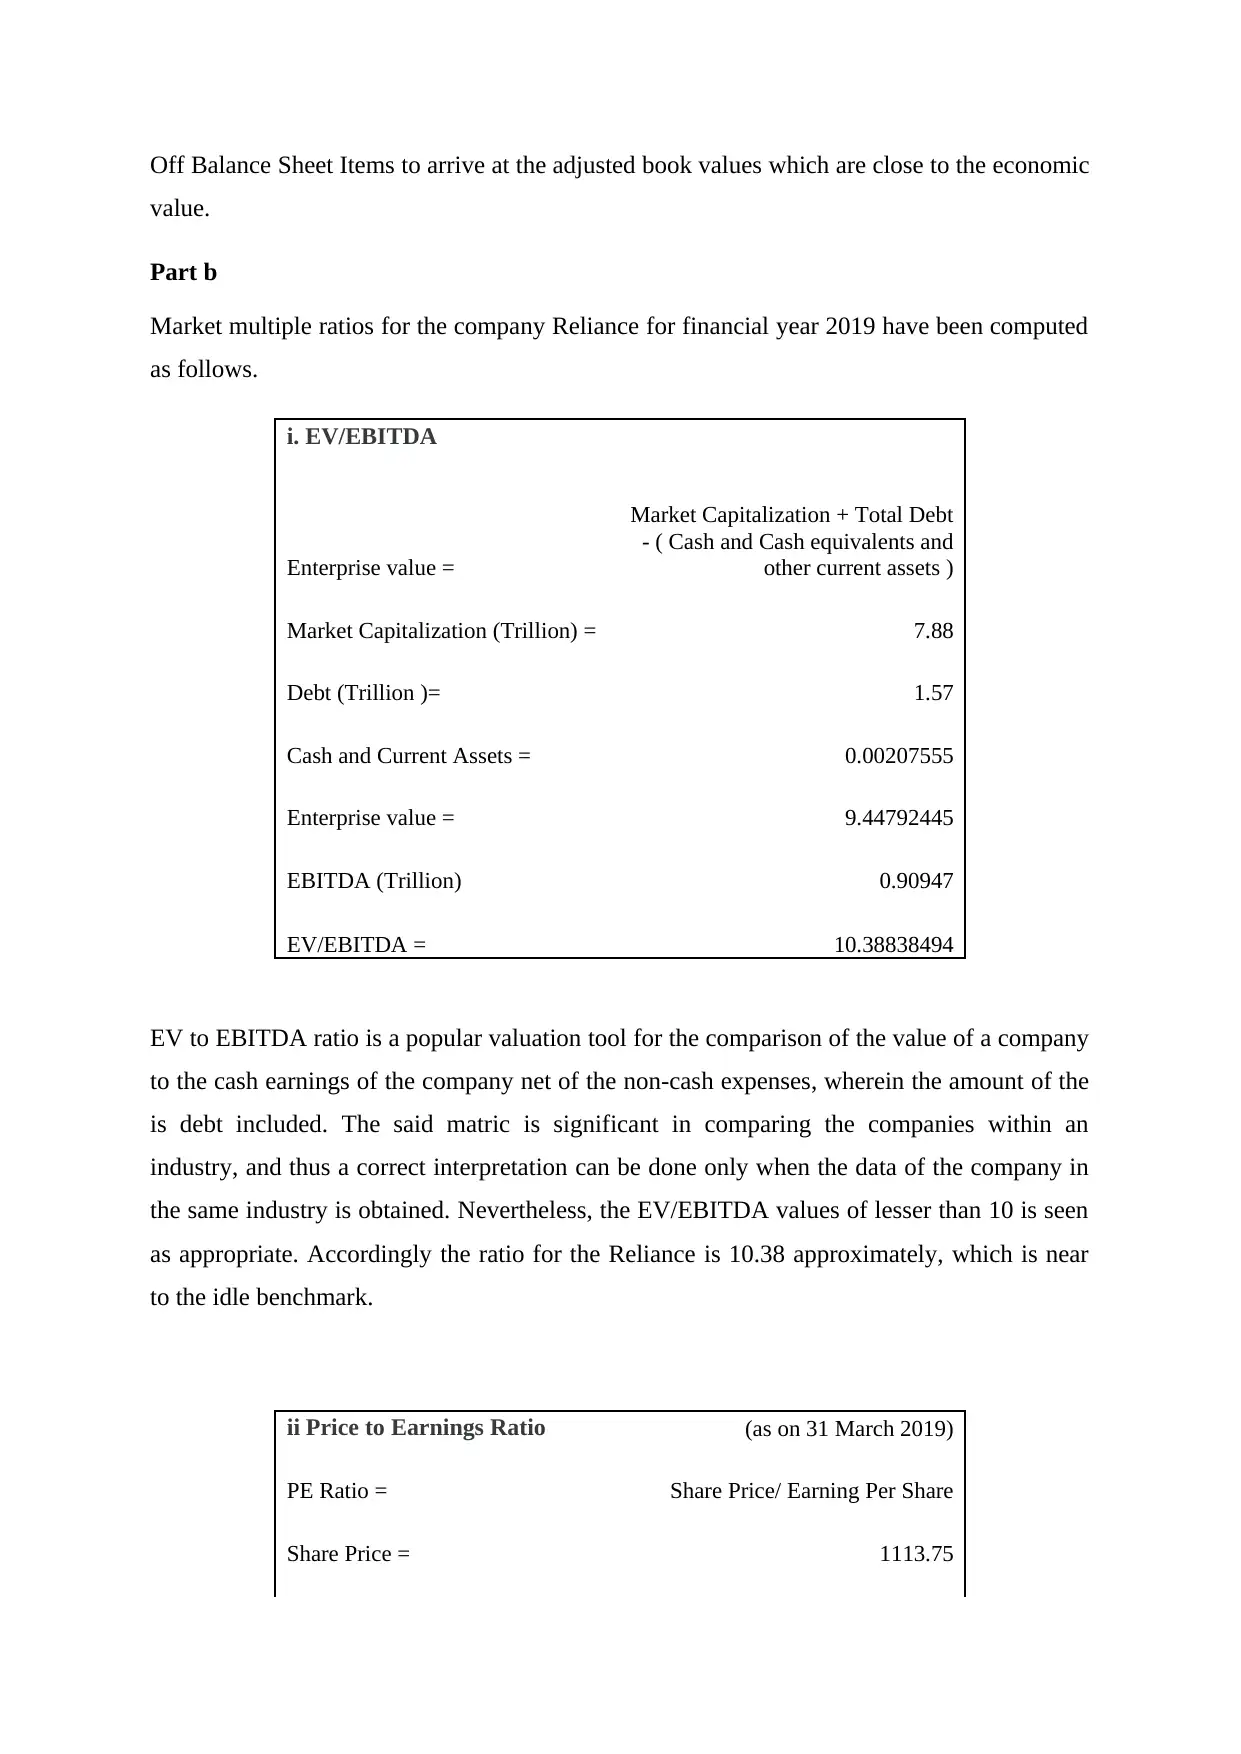
Market multiple ratios for the company Reliance for financial year 2019 have been computed
as follows.
i. EV/EBITDA
Enterprise value =
Market Capitalization + Total Debt
- ( Cash and Cash equivalents and
other current assets )
Market Capitalization (Trillion) = 7.88
Debt (Trillion )= 1.57
Cash and Current Assets = 0.00207555
Enterprise value = 9.44792445
EBITDA (Trillion) 0.90947
EV/EBITDA = 10.38838494
EV to EBITDA ratio is a popular valuation tool for the comparison of the value of a company
to the cash earnings of the company net of the non-cash expenses, wherein the amount of the
is debt included. The said matric is significant in comparing the companies within an
industry, and thus a correct interpretation can be done only when the data of the company in
the same industry is obtained. Nevertheless, the EV/EBITDA values of lesser than 10 is seen
as appropriate. Accordingly the ratio for the Reliance is 10.38 approximately, which is near
to the idle benchmark.
ii Price to Earnings Ratio (as on 31 March 2019)
PE Ratio = Share Price/ Earning Per Share
Share Price = 1113.75
value.
Part b
Market multiple ratios for the company Reliance for financial year 2019 have been computed
as follows.
i. EV/EBITDA
Enterprise value =
Market Capitalization + Total Debt
- ( Cash and Cash equivalents and
other current assets )
Market Capitalization (Trillion) = 7.88
Debt (Trillion )= 1.57
Cash and Current Assets = 0.00207555
Enterprise value = 9.44792445
EBITDA (Trillion) 0.90947
EV/EBITDA = 10.38838494
EV to EBITDA ratio is a popular valuation tool for the comparison of the value of a company
to the cash earnings of the company net of the non-cash expenses, wherein the amount of the
is debt included. The said matric is significant in comparing the companies within an
industry, and thus a correct interpretation can be done only when the data of the company in
the same industry is obtained. Nevertheless, the EV/EBITDA values of lesser than 10 is seen
as appropriate. Accordingly the ratio for the Reliance is 10.38 approximately, which is near
to the idle benchmark.
ii Price to Earnings Ratio (as on 31 March 2019)
PE Ratio = Share Price/ Earning Per Share
Share Price = 1113.75
Paraphrase This Document
Need a fresh take? Get an instant paraphrase of this document with our AI Paraphraser
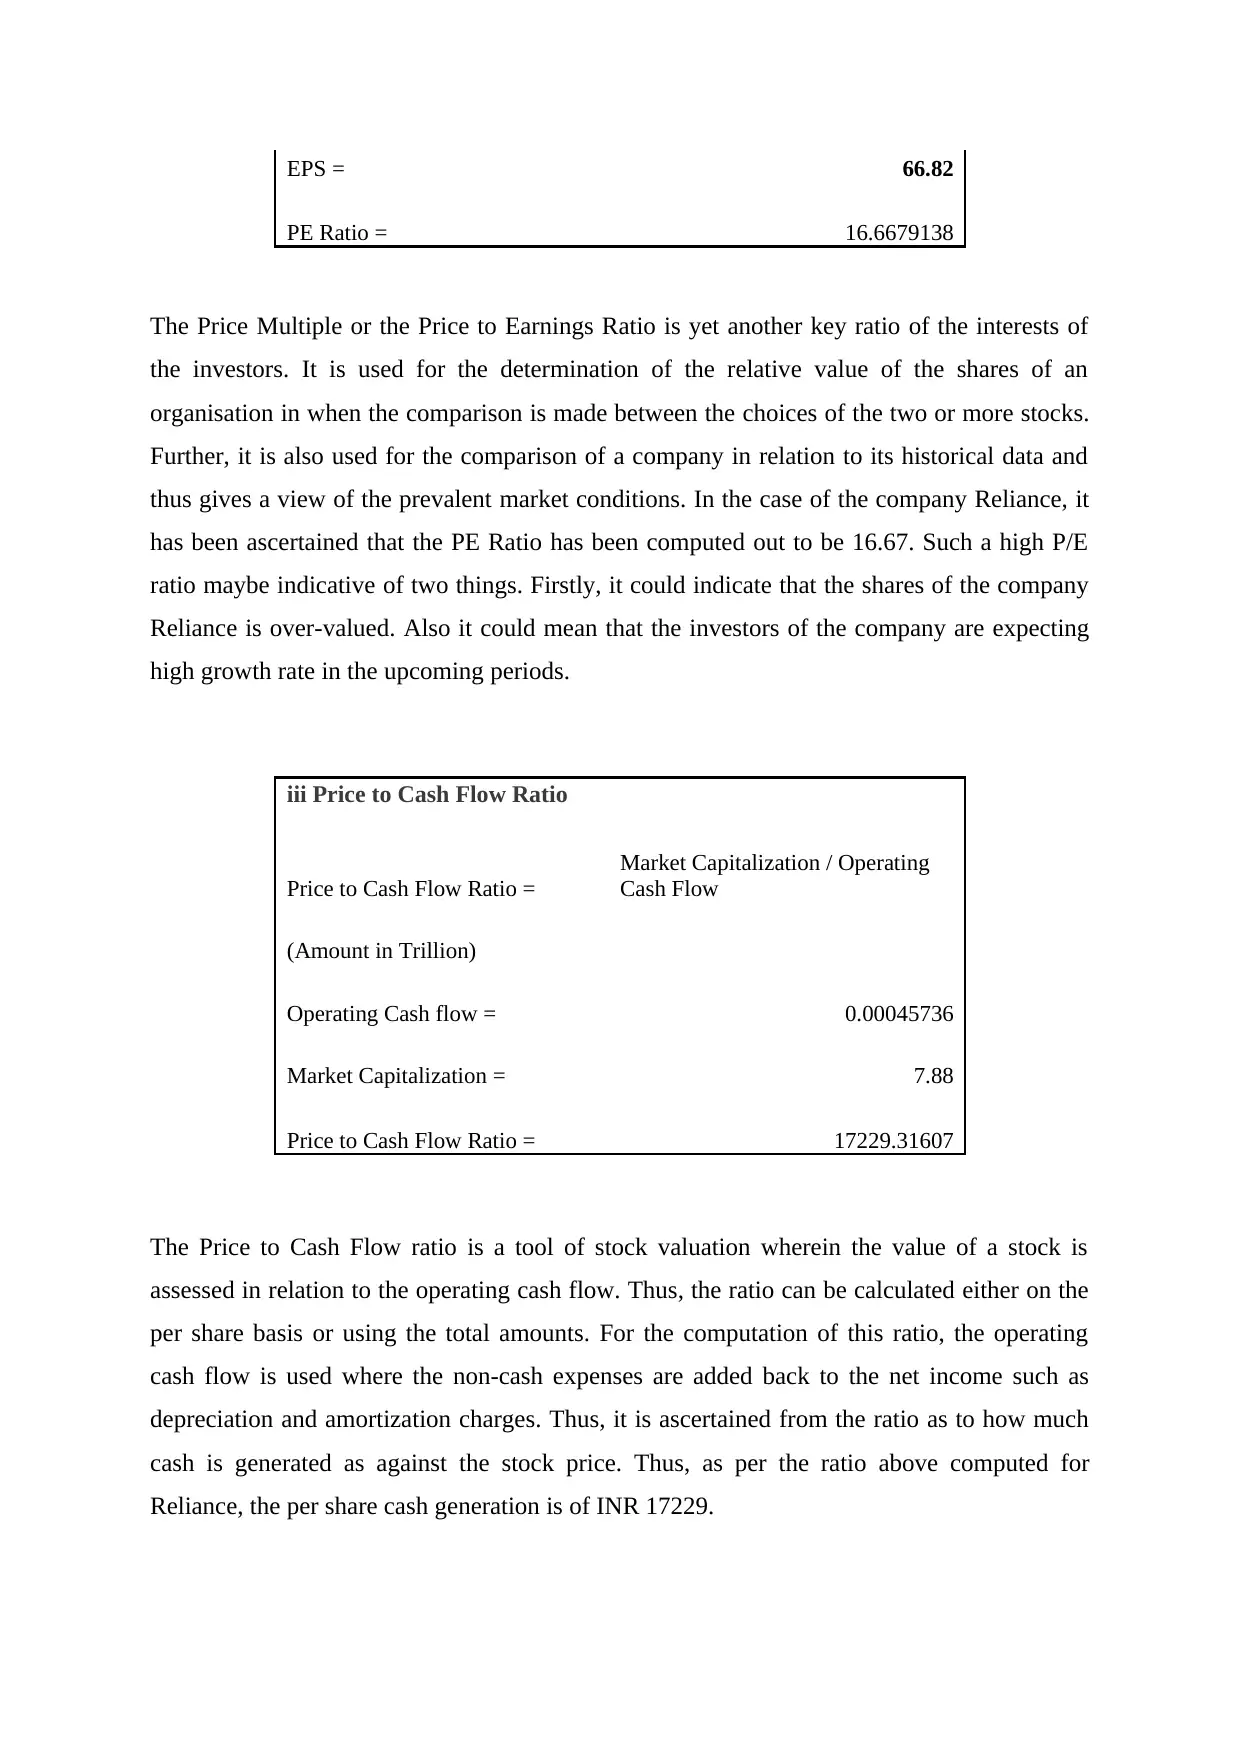
EPS = 66.82
PE Ratio = 16.6679138
The Price Multiple or the Price to Earnings Ratio is yet another key ratio of the interests of
the investors. It is used for the determination of the relative value of the shares of an
organisation in when the comparison is made between the choices of the two or more stocks.
Further, it is also used for the comparison of a company in relation to its historical data and
thus gives a view of the prevalent market conditions. In the case of the company Reliance, it
has been ascertained that the PE Ratio has been computed out to be 16.67. Such a high P/E
ratio maybe indicative of two things. Firstly, it could indicate that the shares of the company
Reliance is over-valued. Also it could mean that the investors of the company are expecting
high growth rate in the upcoming periods.
The Price to Cash Flow ratio is a tool of stock valuation wherein the value of a stock is
assessed in relation to the operating cash flow. Thus, the ratio can be calculated either on the
per share basis or using the total amounts. For the computation of this ratio, the operating
cash flow is used where the non-cash expenses are added back to the net income such as
depreciation and amortization charges. Thus, it is ascertained from the ratio as to how much
cash is generated as against the stock price. Thus, as per the ratio above computed for
Reliance, the per share cash generation is of INR 17229.
iii Price to Cash Flow Ratio
Price to Cash Flow Ratio =
Market Capitalization / Operating
Cash Flow
(Amount in Trillion)
Operating Cash flow = 0.00045736
Market Capitalization = 7.88
Price to Cash Flow Ratio = 17229.31607
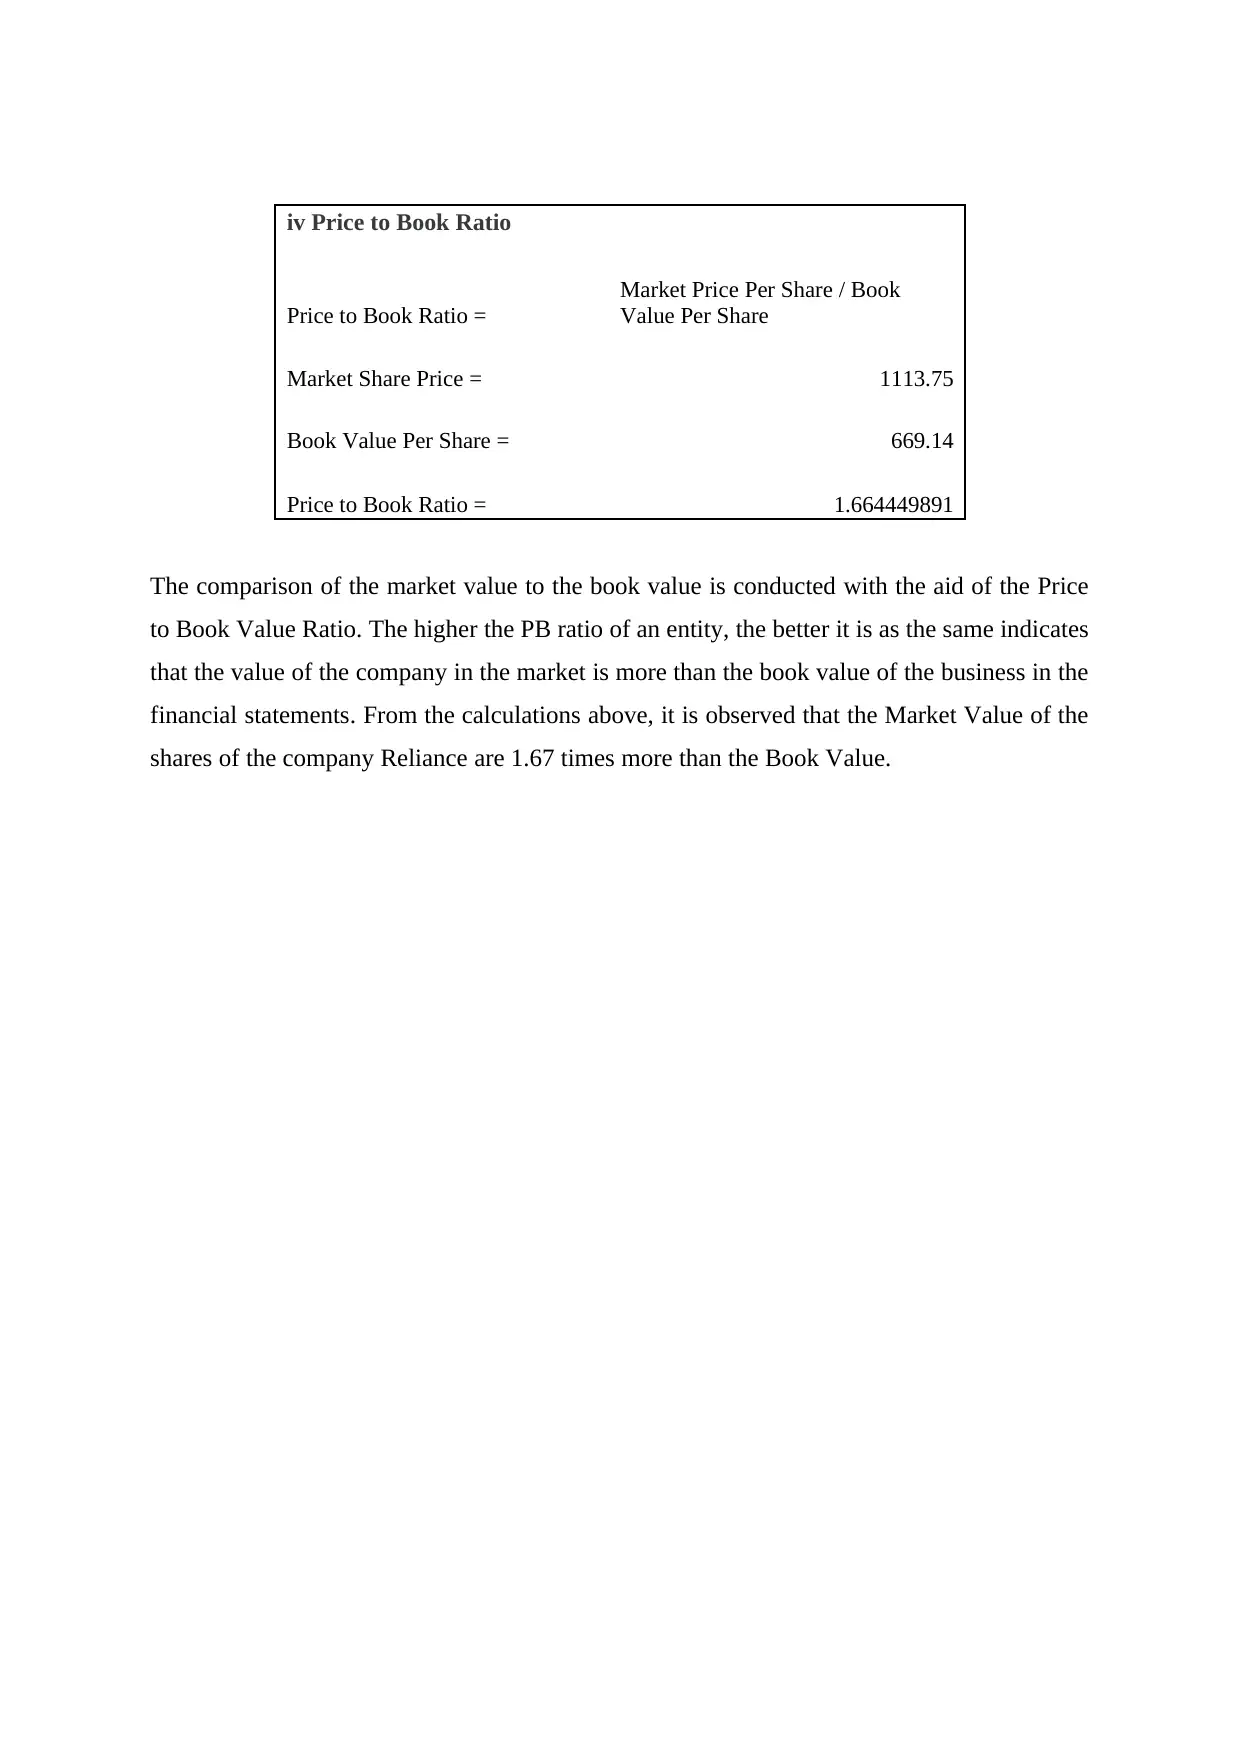
iv Price to Book Ratio
Price to Book Ratio =
Market Price Per Share / Book
Value Per Share
Market Share Price = 1113.75
Book Value Per Share = 669.14
Price to Book Ratio = 1.664449891
The comparison of the market value to the book value is conducted with the aid of the Price
to Book Value Ratio. The higher the PB ratio of an entity, the better it is as the same indicates
that the value of the company in the market is more than the book value of the business in the
financial statements. From the calculations above, it is observed that the Market Value of the
shares of the company Reliance are 1.67 times more than the Book Value.
⊘ This is a preview!⊘
Do you want full access?
Subscribe today to unlock all pages.
Trusted by 1+ million students worldwide
References
Bierman Jr, H., and Smidt, S. (2012) The capital budgeting decision: economic analysis of
investment projects. 9th ed. Oxon: Routledge.
Goyat, S., and Nain, A. (2016) Methods of Evaluating Investment Proposals. International
Journal of Engineering and Management Research (IJEMR), 6(5), p. 279.
Pogue, M. (2010) Corporate Investment Decisions: Principles and Practice. New York:
Business Expert Press, p. 53.
Ross, S. A., Westerfield, R. W., Jaffe, J., and Kakani, R. K. (2014) Corporate Finance. 8th ed.
New Delhi: Tata McGraw Hill Education Pvt Ltd.
Rὂhrich, M. (2014) Fundamentals of Investment Appraisal: An Illustration based on a Case
Study. Boston: Walter de Gruyter GmbH & Co.
Scott, P. (2012) Accounting for Business: An Integrated Print and Online Solution. Oxford:
Oxford University Press, p. 342.
1 out of 10
Related Documents


Your All-in-One AI-Powered Toolkit for Academic Success.
+13062052269
info@desklib.com
Available 24*7 on WhatsApp / Email
![[object Object]](/_next/static/media/star-bottom.7253800d.svg)
Unlock your academic potential
Copyright © 2020–2026 A2Z Services. All Rights Reserved. Developed and managed by ZUCOL.