Investment Strategy Report: Google and Ford Analysis
VerifiedAdded on 2020/04/21
|27
|6108
|356
Report
AI Summary
This report provides a comprehensive analysis of investment strategies, focusing on the performance of Google and Ford Motors. It includes company profiles, a five-year performance review, and historical return on investment calculations. The report delves into discounting cash flow analysis and rate of return for both companies. Furthermore, it explores investment strategies, considering macroeconomic factors and their impact on financial markets, along with an examination of asset allocation and risk factors. The analysis incorporates mutual fund performance, portfolio construction, and performance-weighting strategies. The report also explores the relationship between macroeconomic factors and mutual funds and provides detailed financial data and performance metrics to support its conclusions, offering insights into investment decision-making.
Investment Strategy
Paraphrase This Document
Need a fresh take? Get an instant paraphrase of this document with our AI Paraphraser
TABLE OF CONTENTS
Question -1.......................................................................................................................................4
Company Profile..........................................................................................................................4
Five Year Performance of the Company.....................................................................................4
Historical return on investment.................................................................................................10
Discounting cash flow analysis and rate of return.....................................................................11
Discounting cash flow analysis and rate of return.....................................................................11
Question-2......................................................................................................................................12
Investment Strategy...................................................................................................................12
Macro economic factors and its impact on financial market.....................................................13
Macroeconomic factors and their relationship with mutual funds............................................15
Asset Allocation.........................................................................................................................16
Risk Factors to be assessed........................................................................................................23
Question-3......................................................................................................................................24
References......................................................................................................................................26
TABLE OF FIGURES
Figure 1: Five year Share price of the Google.................................................................................5
Figure 2: Five Year Share Price of Ford Motors.............................................................................6
Figure 3: Trailing Total Returns of Google.....................................................................................7
Figure 4: 10 Year performance of Google.......................................................................................8
Figure 5: Ten Year Financial Performance of Ford Motors............................................................9
Figure 6: Financial Health Ratios of Ford Motors.........................................................................10
Figure 7: Financial Health Ratios of Google.................................................................................10
Figure 8: Macro economic factors and their sign of relationship with mutual funds....................15
Figure 9: Portfolio profile of Picet- Timber R USD......................................................................17
Figure 10: Graph representing the performance............................................................................18
Figure 11: Associated Risk of the Fund........................................................................................19
Figure 12: Performance History of Schroder ISF Asian Total Ret A1..........................................20
Figure 13: Five Year Performance in %........................................................................................20
Figure 14: Performance History of Fidelity Euro Bond A-Acc-EUR...........................................21
Figure 15: Performance History of BNPP L1 Equity Best Sell Euro Classic (EUR)....................22
Figure 16: Performance Statistics of Templeton Global Bond A Acc (EUR)...............................23
Figure 17: Regression Analysis of Gazprom’s Eurobonds............................................................25
⊘ This is a preview!⊘
Do you want full access?
Subscribe today to unlock all pages.
Trusted by 1+ million students worldwide
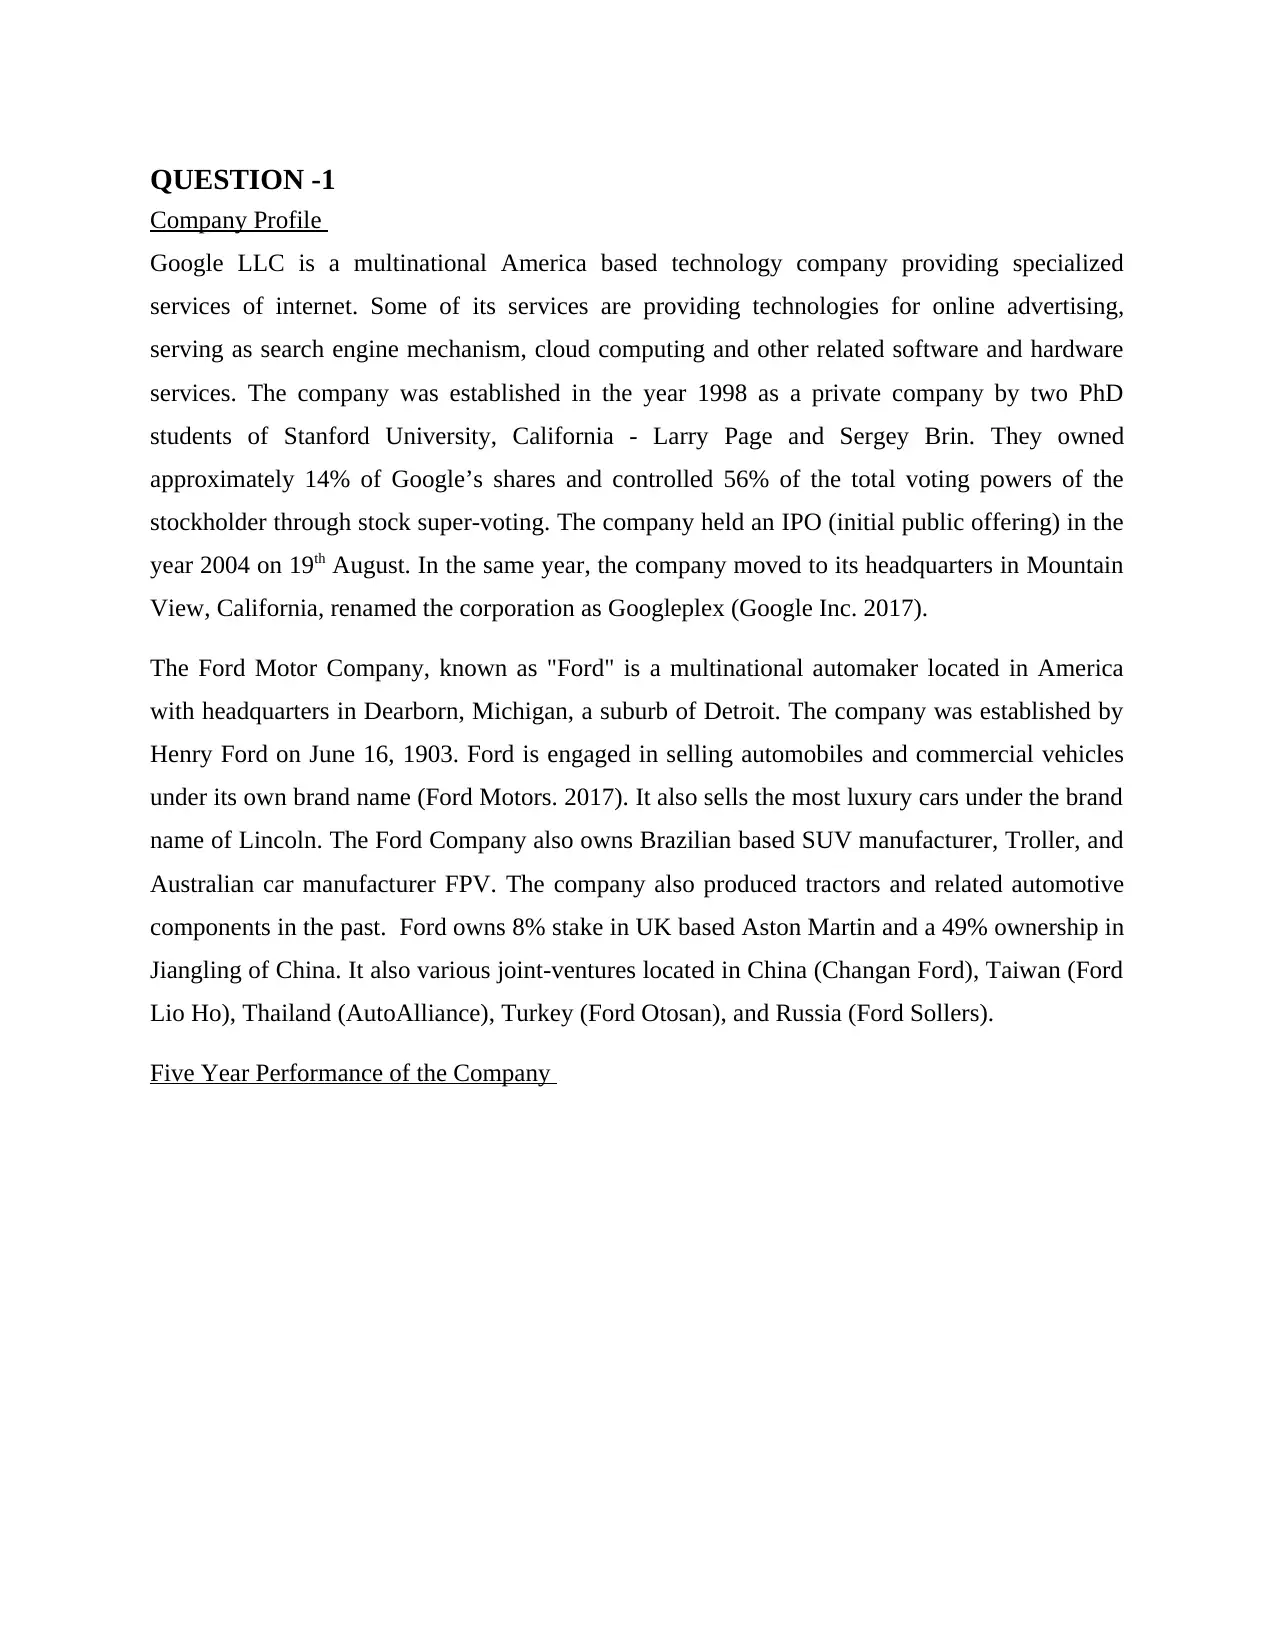
QUESTION -1
Company Profile
Google LLC is a multinational America based technology company providing specialized
services of internet. Some of its services are providing technologies for online advertising,
serving as search engine mechanism, cloud computing and other related software and hardware
services. The company was established in the year 1998 as a private company by two PhD
students of Stanford University, California - Larry Page and Sergey Brin. They owned
approximately 14% of Google’s shares and controlled 56% of the total voting powers of the
stockholder through stock super-voting. The company held an IPO (initial public offering) in the
year 2004 on 19th August. In the same year, the company moved to its headquarters in Mountain
View, California, renamed the corporation as Googleplex (Google Inc. 2017).
The Ford Motor Company, known as "Ford" is a multinational automaker located in America
with headquarters in Dearborn, Michigan, a suburb of Detroit. The company was established by
Henry Ford on June 16, 1903. Ford is engaged in selling automobiles and commercial vehicles
under its own brand name (Ford Motors. 2017). It also sells the most luxury cars under the brand
name of Lincoln. The Ford Company also owns Brazilian based SUV manufacturer, Troller, and
Australian car manufacturer FPV. The company also produced tractors and related automotive
components in the past. Ford owns 8% stake in UK based Aston Martin and a 49% ownership in
Jiangling of China. It also various joint-ventures located in China (Changan Ford), Taiwan (Ford
Lio Ho), Thailand (AutoAlliance), Turkey (Ford Otosan), and Russia (Ford Sollers).
Five Year Performance of the Company
Paraphrase This Document
Need a fresh take? Get an instant paraphrase of this document with our AI Paraphraser
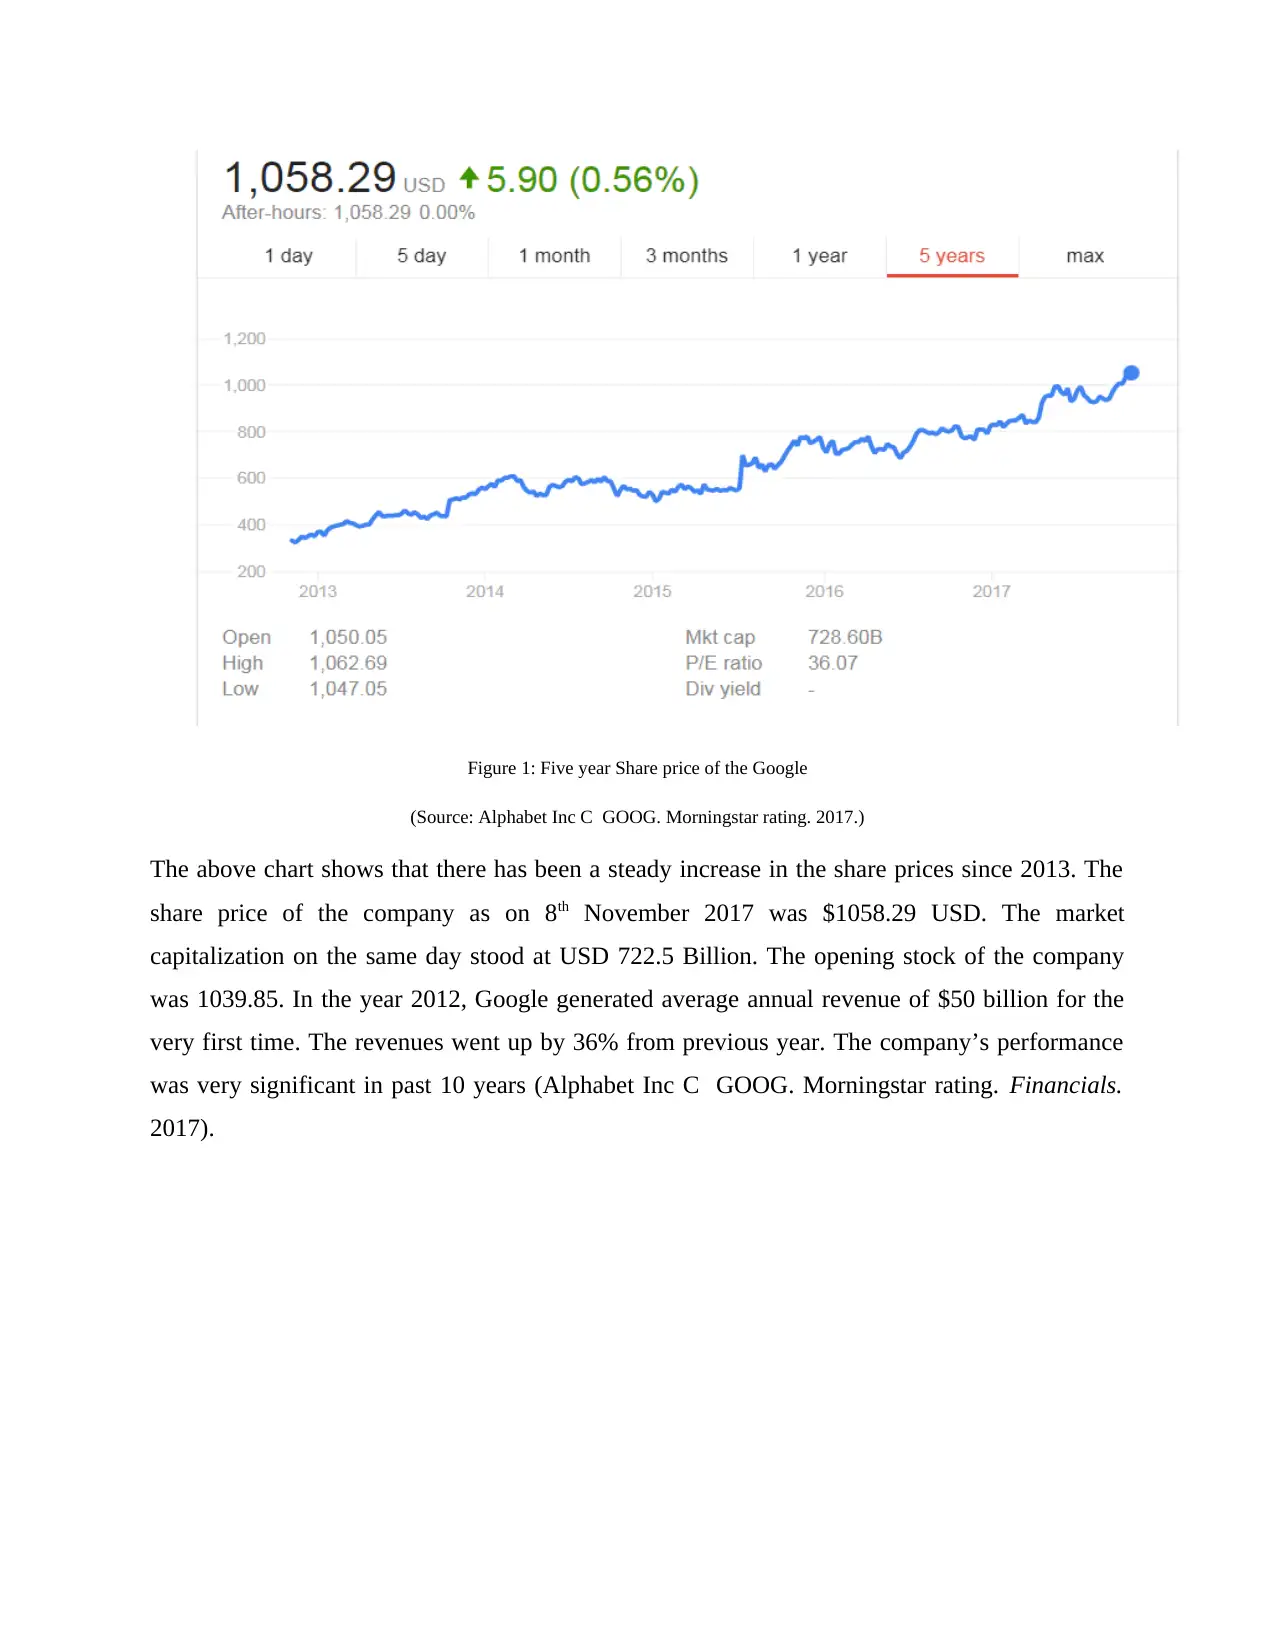
Figure 1: Five year Share price of the Google
(Source: Alphabet Inc C GOOG. Morningstar rating. 2017.)
The above chart shows that there has been a steady increase in the share prices since 2013. The
share price of the company as on 8th November 2017 was $1058.29 USD. The market
capitalization on the same day stood at USD 722.5 Billion. The opening stock of the company
was 1039.85. In the year 2012, Google generated average annual revenue of $50 billion for the
very first time. The revenues went up by 36% from previous year. The company’s performance
was very significant in past 10 years (Alphabet Inc C GOOG. Morningstar rating. Financials.
2017).
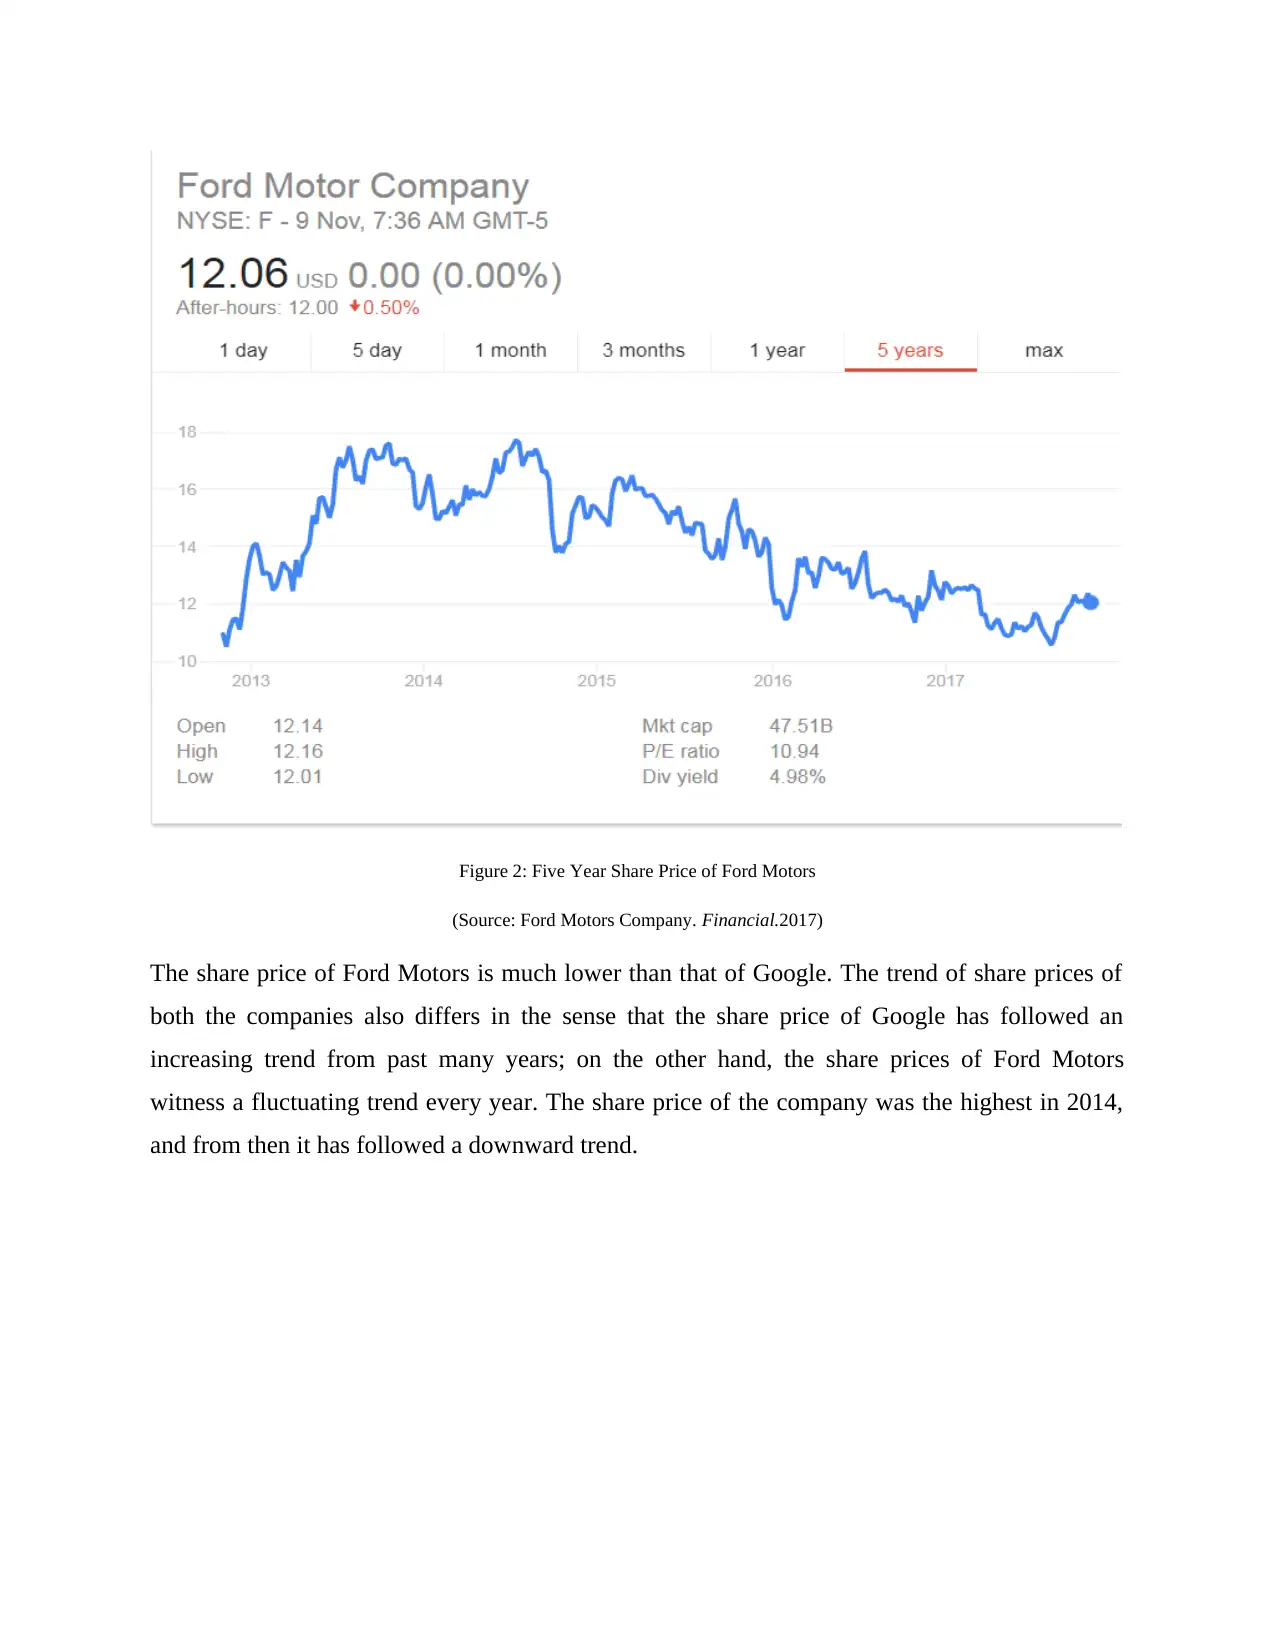
Figure 2: Five Year Share Price of Ford Motors
(Source: Ford Motors Company. Financial.2017)
The share price of Ford Motors is much lower than that of Google. The trend of share prices of
both the companies also differs in the sense that the share price of Google has followed an
increasing trend from past many years; on the other hand, the share prices of Ford Motors
witness a fluctuating trend every year. The share price of the company was the highest in 2014,
and from then it has followed a downward trend.
⊘ This is a preview!⊘
Do you want full access?
Subscribe today to unlock all pages.
Trusted by 1+ million students worldwide
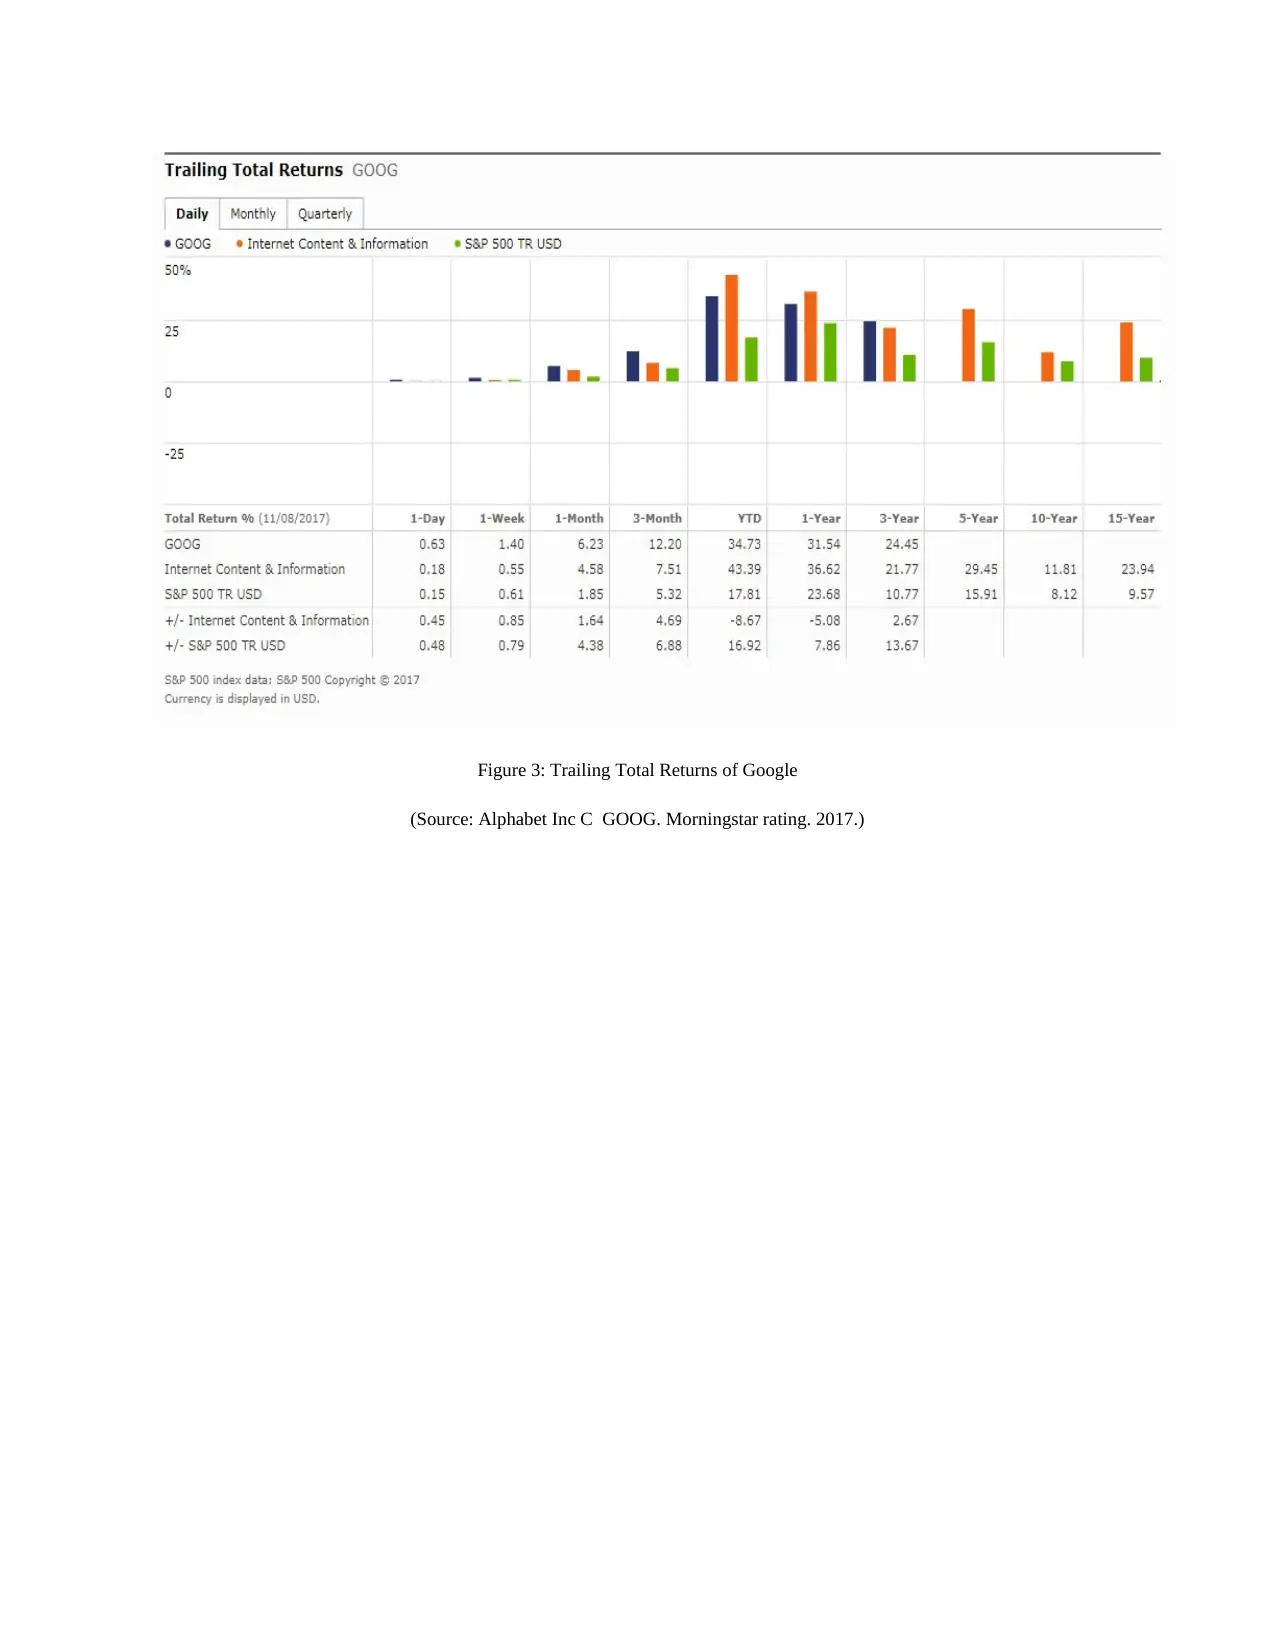
Figure 3: Trailing Total Returns of Google
(Source: Alphabet Inc C GOOG. Morningstar rating. 2017.)
(Source: Alphabet Inc C GOOG. Morningstar rating. 2017.)
Paraphrase This Document
Need a fresh take? Get an instant paraphrase of this document with our AI Paraphraser
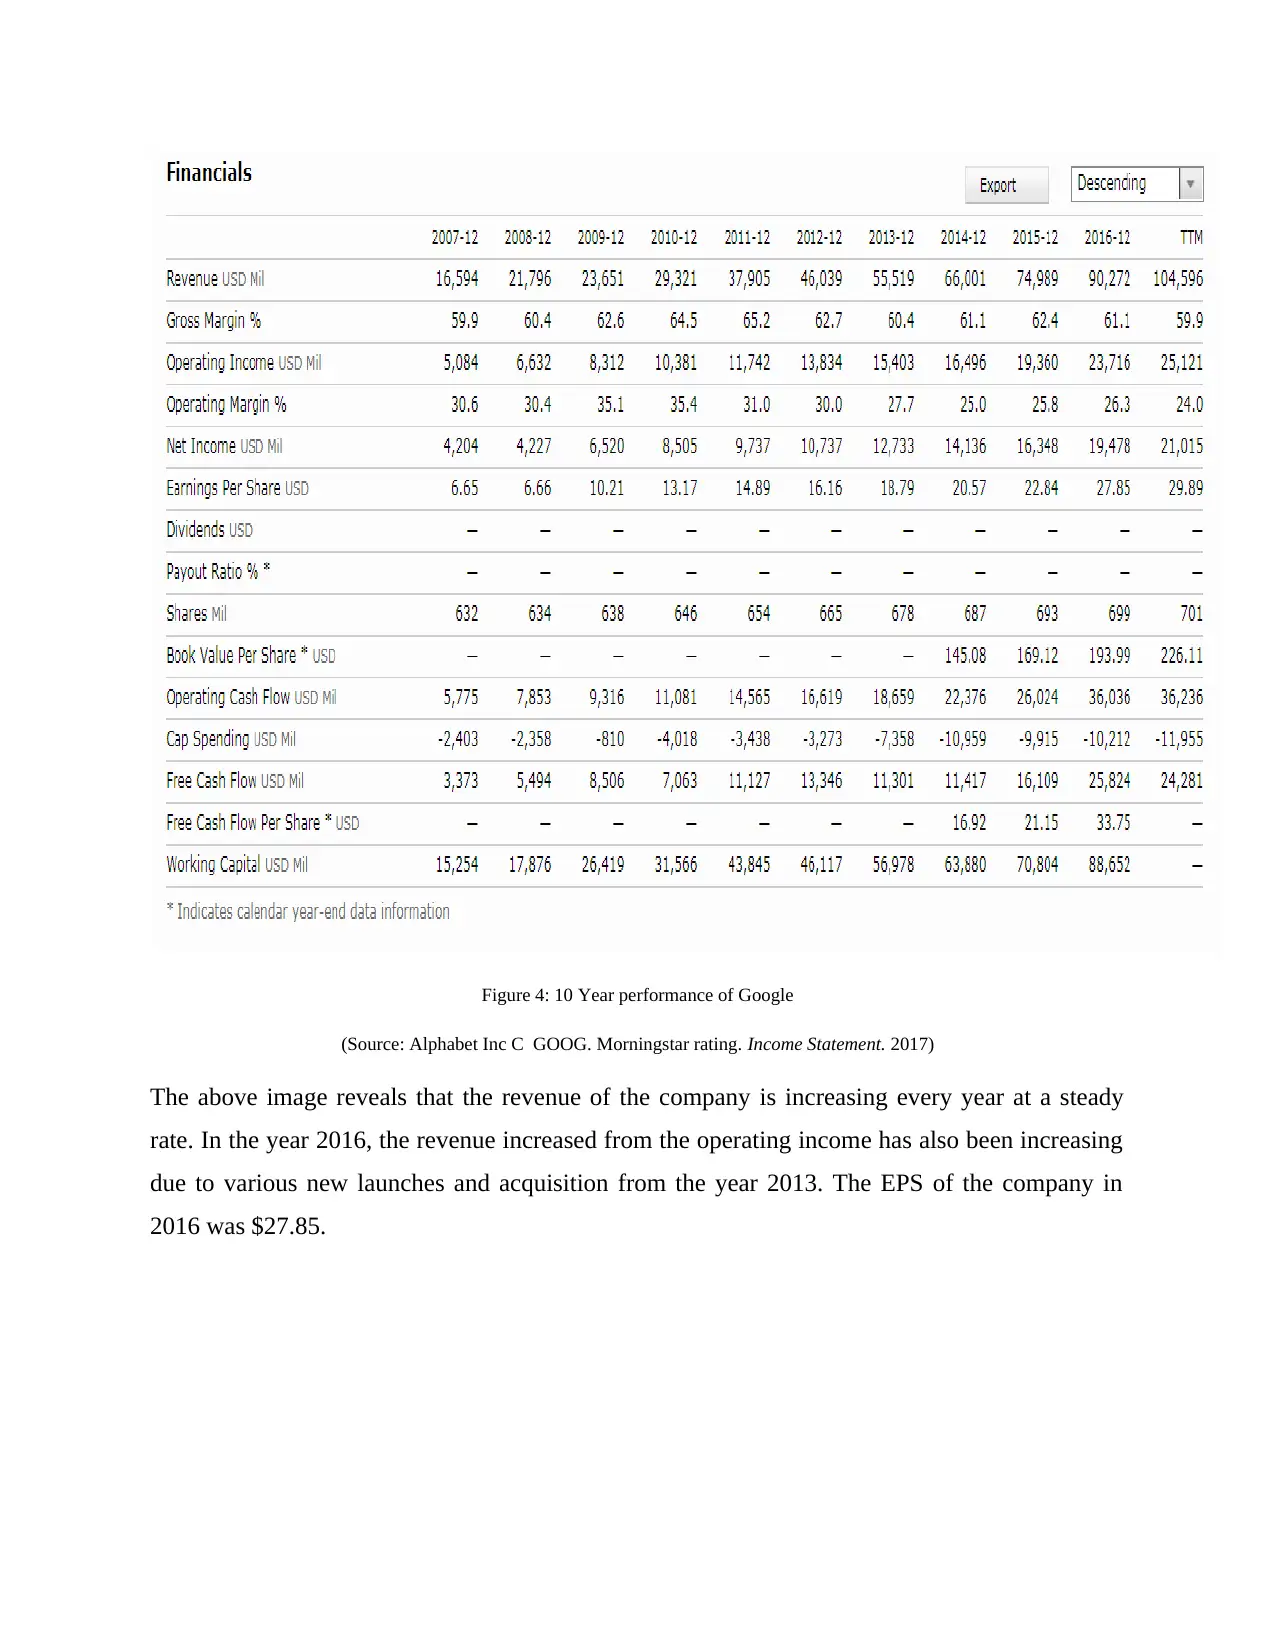
Figure 4: 10 Year performance of Google
(Source: Alphabet Inc C GOOG. Morningstar rating. Income Statement. 2017)
The above image reveals that the revenue of the company is increasing every year at a steady
rate. In the year 2016, the revenue increased from the operating income has also been increasing
due to various new launches and acquisition from the year 2013. The EPS of the company in
2016 was $27.85.
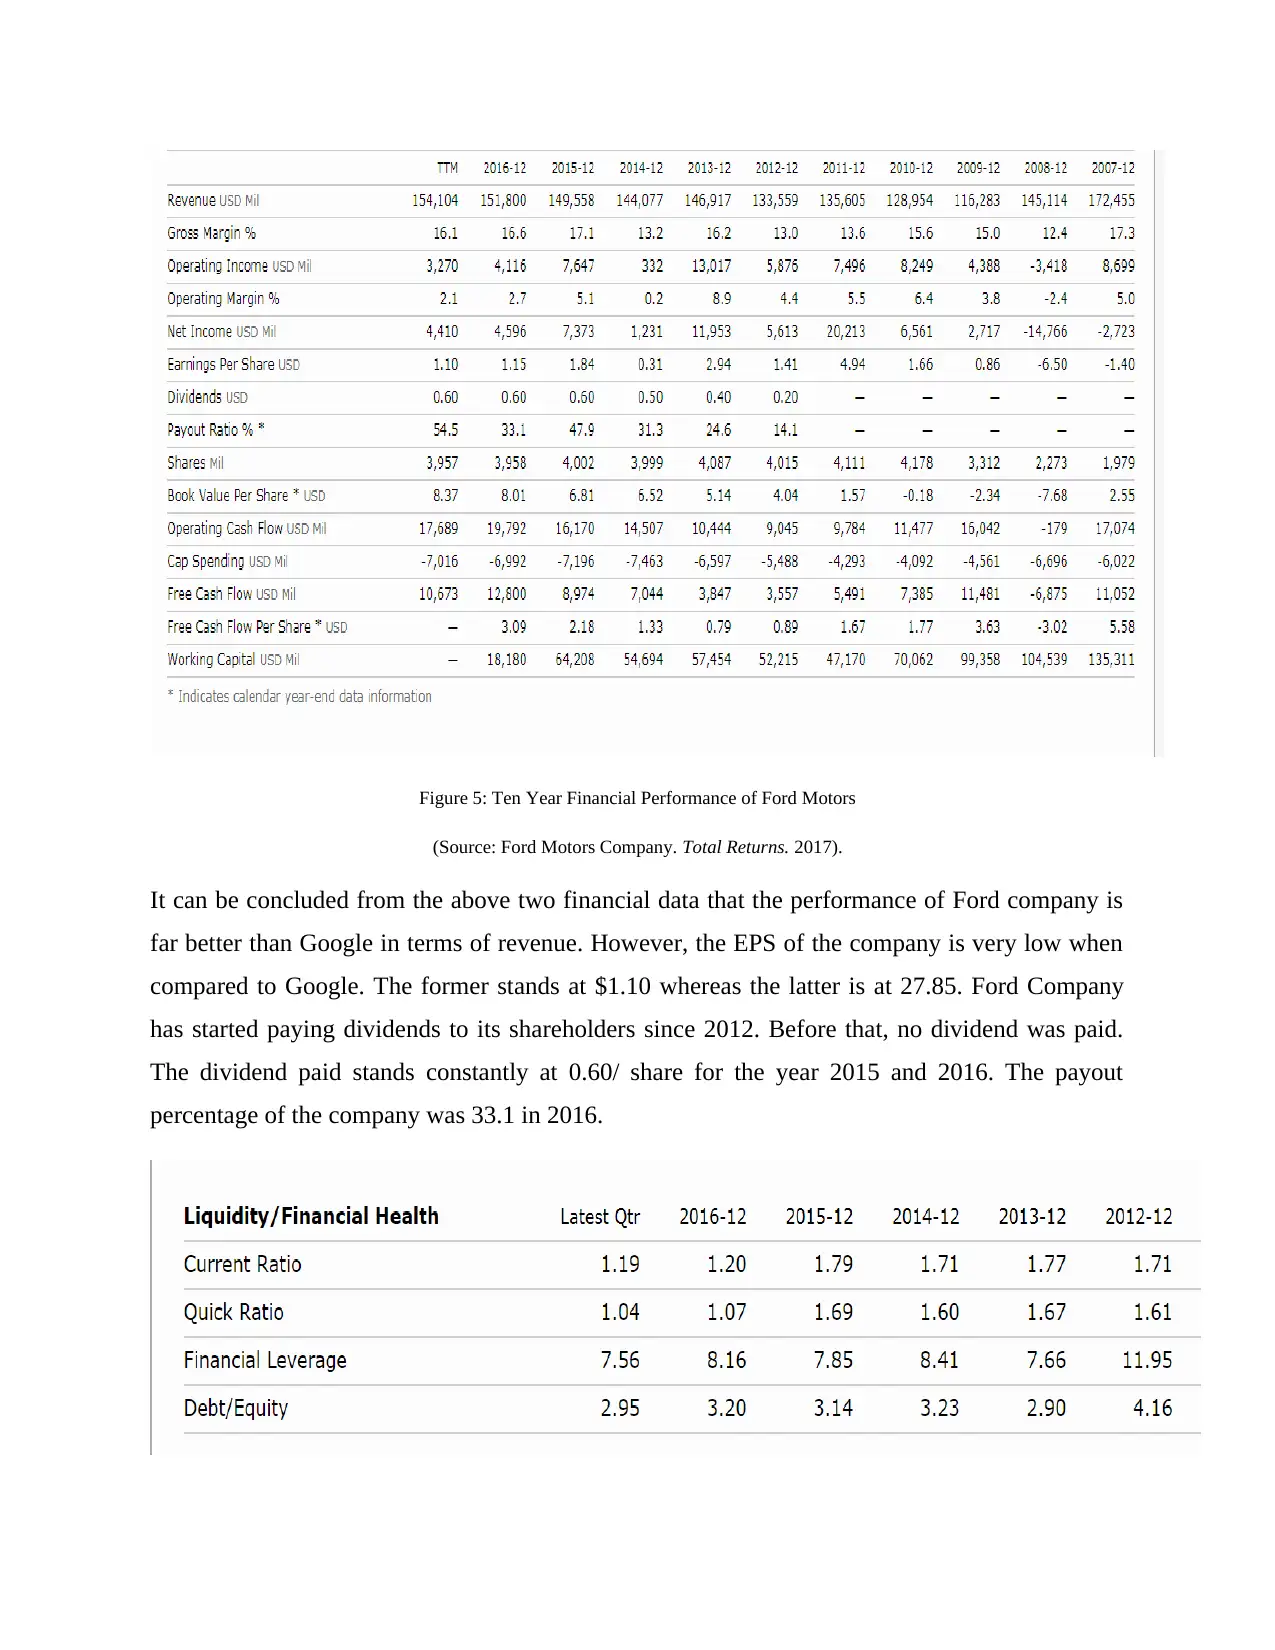
Figure 5: Ten Year Financial Performance of Ford Motors
(Source: Ford Motors Company. Total Returns. 2017).
It can be concluded from the above two financial data that the performance of Ford company is
far better than Google in terms of revenue. However, the EPS of the company is very low when
compared to Google. The former stands at $1.10 whereas the latter is at 27.85. Ford Company
has started paying dividends to its shareholders since 2012. Before that, no dividend was paid.
The dividend paid stands constantly at 0.60/ share for the year 2015 and 2016. The payout
percentage of the company was 33.1 in 2016.
⊘ This is a preview!⊘
Do you want full access?
Subscribe today to unlock all pages.
Trusted by 1+ million students worldwide
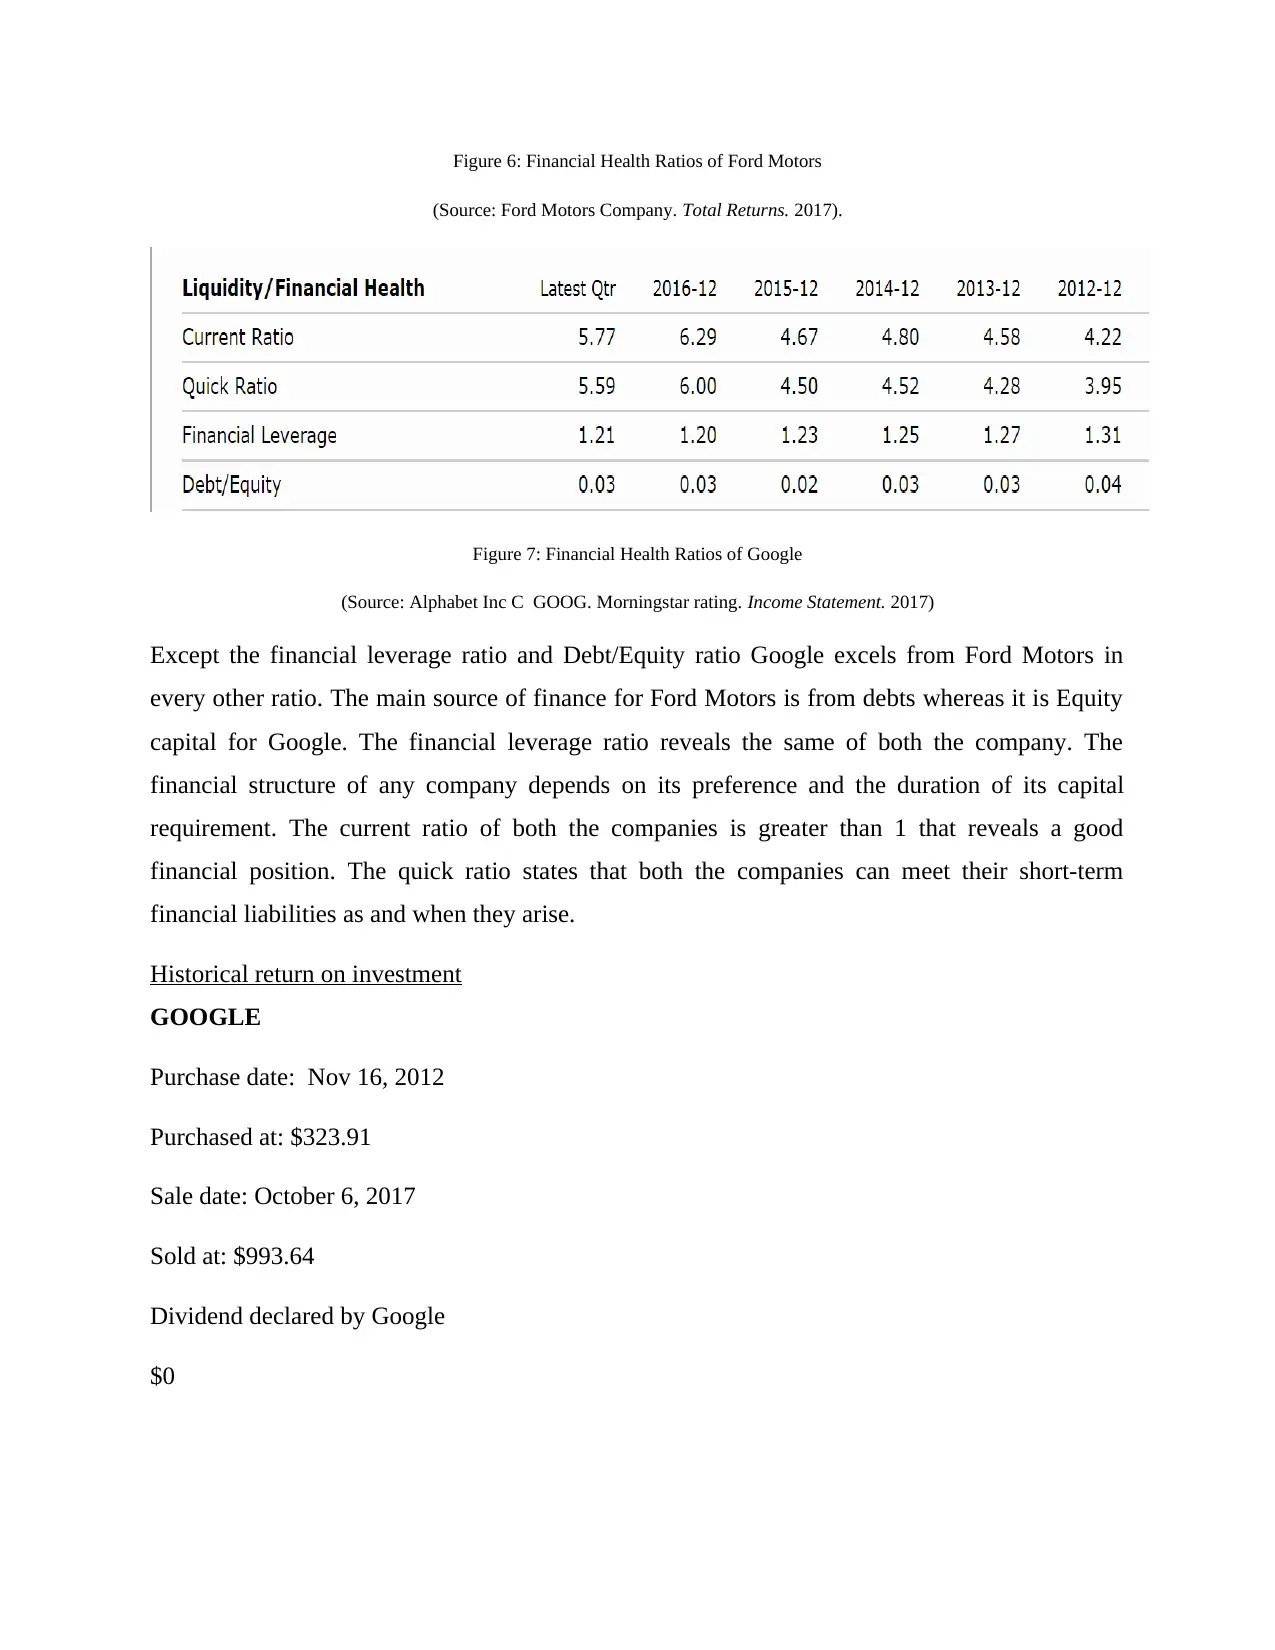
Figure 6: Financial Health Ratios of Ford Motors
(Source: Ford Motors Company. Total Returns. 2017).
Figure 7: Financial Health Ratios of Google
(Source: Alphabet Inc C GOOG. Morningstar rating. Income Statement. 2017)
Except the financial leverage ratio and Debt/Equity ratio Google excels from Ford Motors in
every other ratio. The main source of finance for Ford Motors is from debts whereas it is Equity
capital for Google. The financial leverage ratio reveals the same of both the company. The
financial structure of any company depends on its preference and the duration of its capital
requirement. The current ratio of both the companies is greater than 1 that reveals a good
financial position. The quick ratio states that both the companies can meet their short-term
financial liabilities as and when they arise.
Historical return on investment
GOOGLE
Purchase date: Nov 16, 2012
Purchased at: $323.91
Sale date: October 6, 2017
Sold at: $993.64
Dividend declared by Google
$0
(Source: Ford Motors Company. Total Returns. 2017).
Figure 7: Financial Health Ratios of Google
(Source: Alphabet Inc C GOOG. Morningstar rating. Income Statement. 2017)
Except the financial leverage ratio and Debt/Equity ratio Google excels from Ford Motors in
every other ratio. The main source of finance for Ford Motors is from debts whereas it is Equity
capital for Google. The financial leverage ratio reveals the same of both the company. The
financial structure of any company depends on its preference and the duration of its capital
requirement. The current ratio of both the companies is greater than 1 that reveals a good
financial position. The quick ratio states that both the companies can meet their short-term
financial liabilities as and when they arise.
Historical return on investment
Purchase date: Nov 16, 2012
Purchased at: $323.91
Sale date: October 6, 2017
Sold at: $993.64
Dividend declared by Google
$0
Paraphrase This Document
Need a fresh take? Get an instant paraphrase of this document with our AI Paraphraser
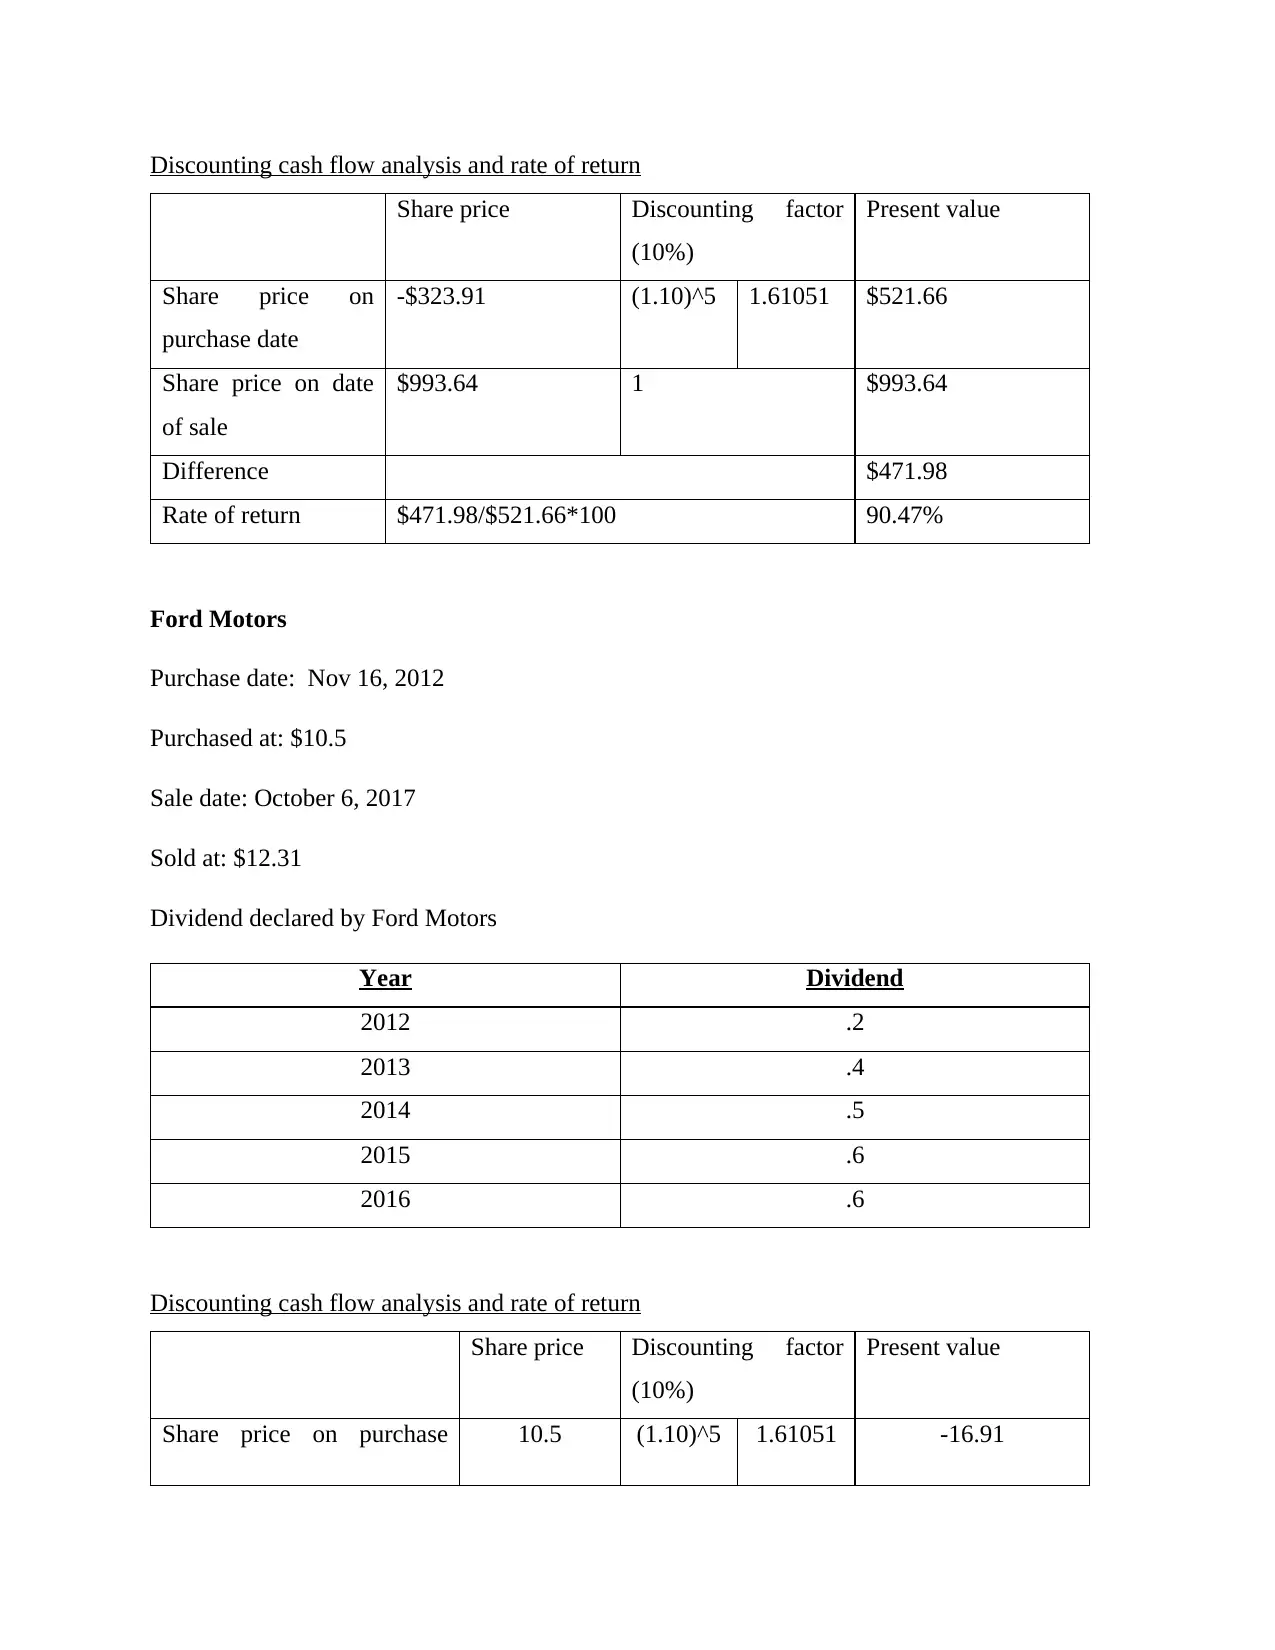
Discounting cash flow analysis and rate of return
Share price Discounting factor
(10%)
Present value
Share price on
purchase date
-$323.91 (1.10)^5 1.61051 $521.66
Share price on date
of sale
$993.64 1 $993.64
Difference $471.98
Rate of return $471.98/$521.66*100 90.47%
Ford Motors
Purchase date: Nov 16, 2012
Purchased at: $10.5
Sale date: October 6, 2017
Sold at: $12.31
Dividend declared by Ford Motors
Year Dividend
2012 .2
2013 .4
2014 .5
2015 .6
2016 .6
Discounting cash flow analysis and rate of return
Share price Discounting factor
(10%)
Present value
Share price on purchase 10.5 (1.10)^5 1.61051 -16.91
Share price Discounting factor
(10%)
Present value
Share price on
purchase date
-$323.91 (1.10)^5 1.61051 $521.66
Share price on date
of sale
$993.64 1 $993.64
Difference $471.98
Rate of return $471.98/$521.66*100 90.47%
Ford Motors
Purchase date: Nov 16, 2012
Purchased at: $10.5
Sale date: October 6, 2017
Sold at: $12.31
Dividend declared by Ford Motors
Year Dividend
2012 .2
2013 .4
2014 .5
2015 .6
2016 .6
Discounting cash flow analysis and rate of return
Share price Discounting factor
(10%)
Present value
Share price on purchase 10.5 (1.10)^5 1.61051 -16.91
date
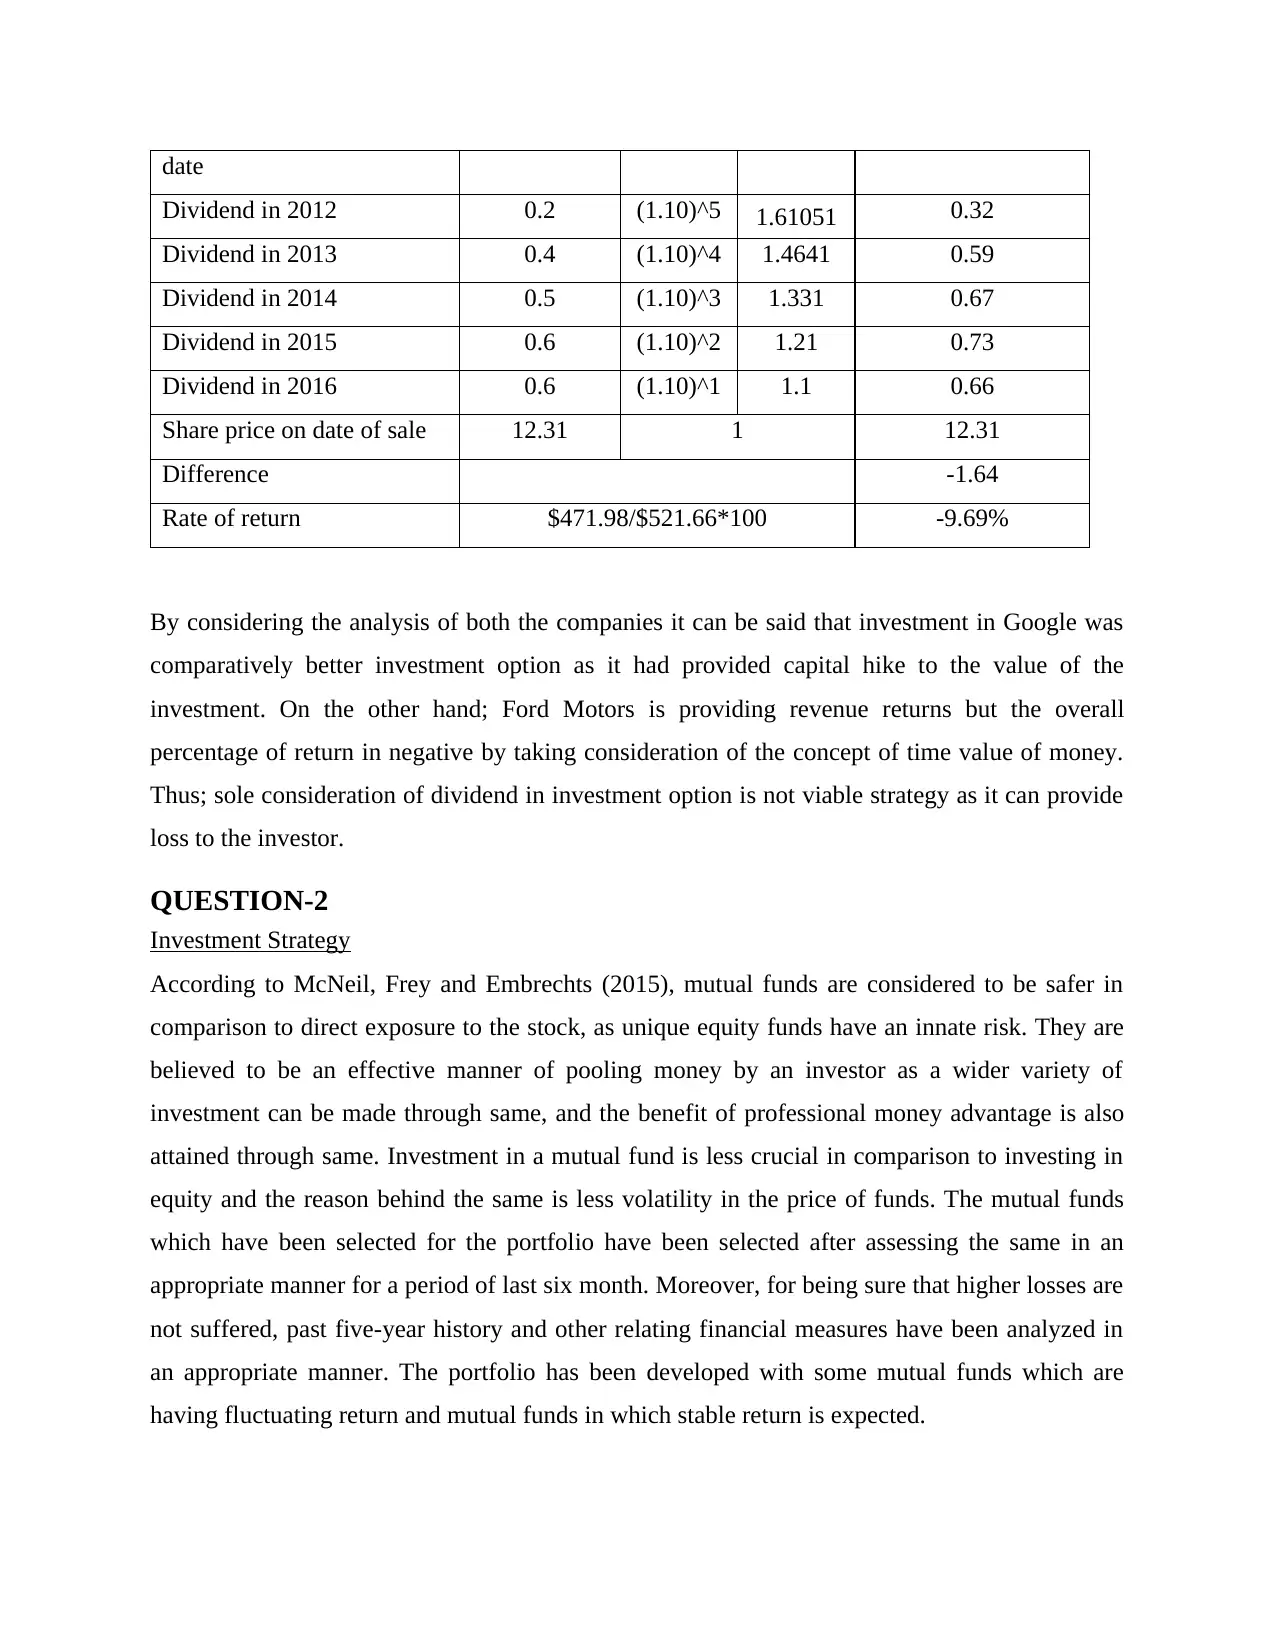
Dividend in 2012 0.2 (1.10)^5 1.61051 0.32
Dividend in 2013 0.4 (1.10)^4 1.4641 0.59
Dividend in 2014 0.5 (1.10)^3 1.331 0.67
Dividend in 2015 0.6 (1.10)^2 1.21 0.73
Dividend in 2016 0.6 (1.10)^1 1.1 0.66
Share price on date of sale 12.31 1 12.31
Difference -1.64
Rate of return $471.98/$521.66*100 -9.69%
By considering the analysis of both the companies it can be said that investment in Google was
comparatively better investment option as it had provided capital hike to the value of the
investment. On the other hand; Ford Motors is providing revenue returns but the overall
percentage of return in negative by taking consideration of the concept of time value of money.
Thus; sole consideration of dividend in investment option is not viable strategy as it can provide
loss to the investor.
QUESTION-2
Investment Strategy
According to McNeil, Frey and Embrechts (2015), mutual funds are considered to be safer in
comparison to direct exposure to the stock, as unique equity funds have an innate risk. They are
believed to be an effective manner of pooling money by an investor as a wider variety of
investment can be made through same, and the benefit of professional money advantage is also
attained through same. Investment in a mutual fund is less crucial in comparison to investing in
equity and the reason behind the same is less volatility in the price of funds. The mutual funds
which have been selected for the portfolio have been selected after assessing the same in an
appropriate manner for a period of last six month. Moreover, for being sure that higher losses are
not suffered, past five-year history and other relating financial measures have been analyzed in
an appropriate manner. The portfolio has been developed with some mutual funds which are
having fluctuating return and mutual funds in which stable return is expected.
⊘ This is a preview!⊘
Do you want full access?
Subscribe today to unlock all pages.
Trusted by 1+ million students worldwide
1 out of 27

Your All-in-One AI-Powered Toolkit for Academic Success.
+13062052269
info@desklib.com
Available 24*7 on WhatsApp / Email
![[object Object]](/_next/static/media/star-bottom.7253800d.svg)
Unlock your academic potential
Copyright © 2020–2026 A2Z Services. All Rights Reserved. Developed and managed by ZUCOL.