Investment Management Report: Bond Pricing, Yields, and Risk Analysis

Verified

Added on  2021/02/22

|19
|4950
|78
Report
AI Summary
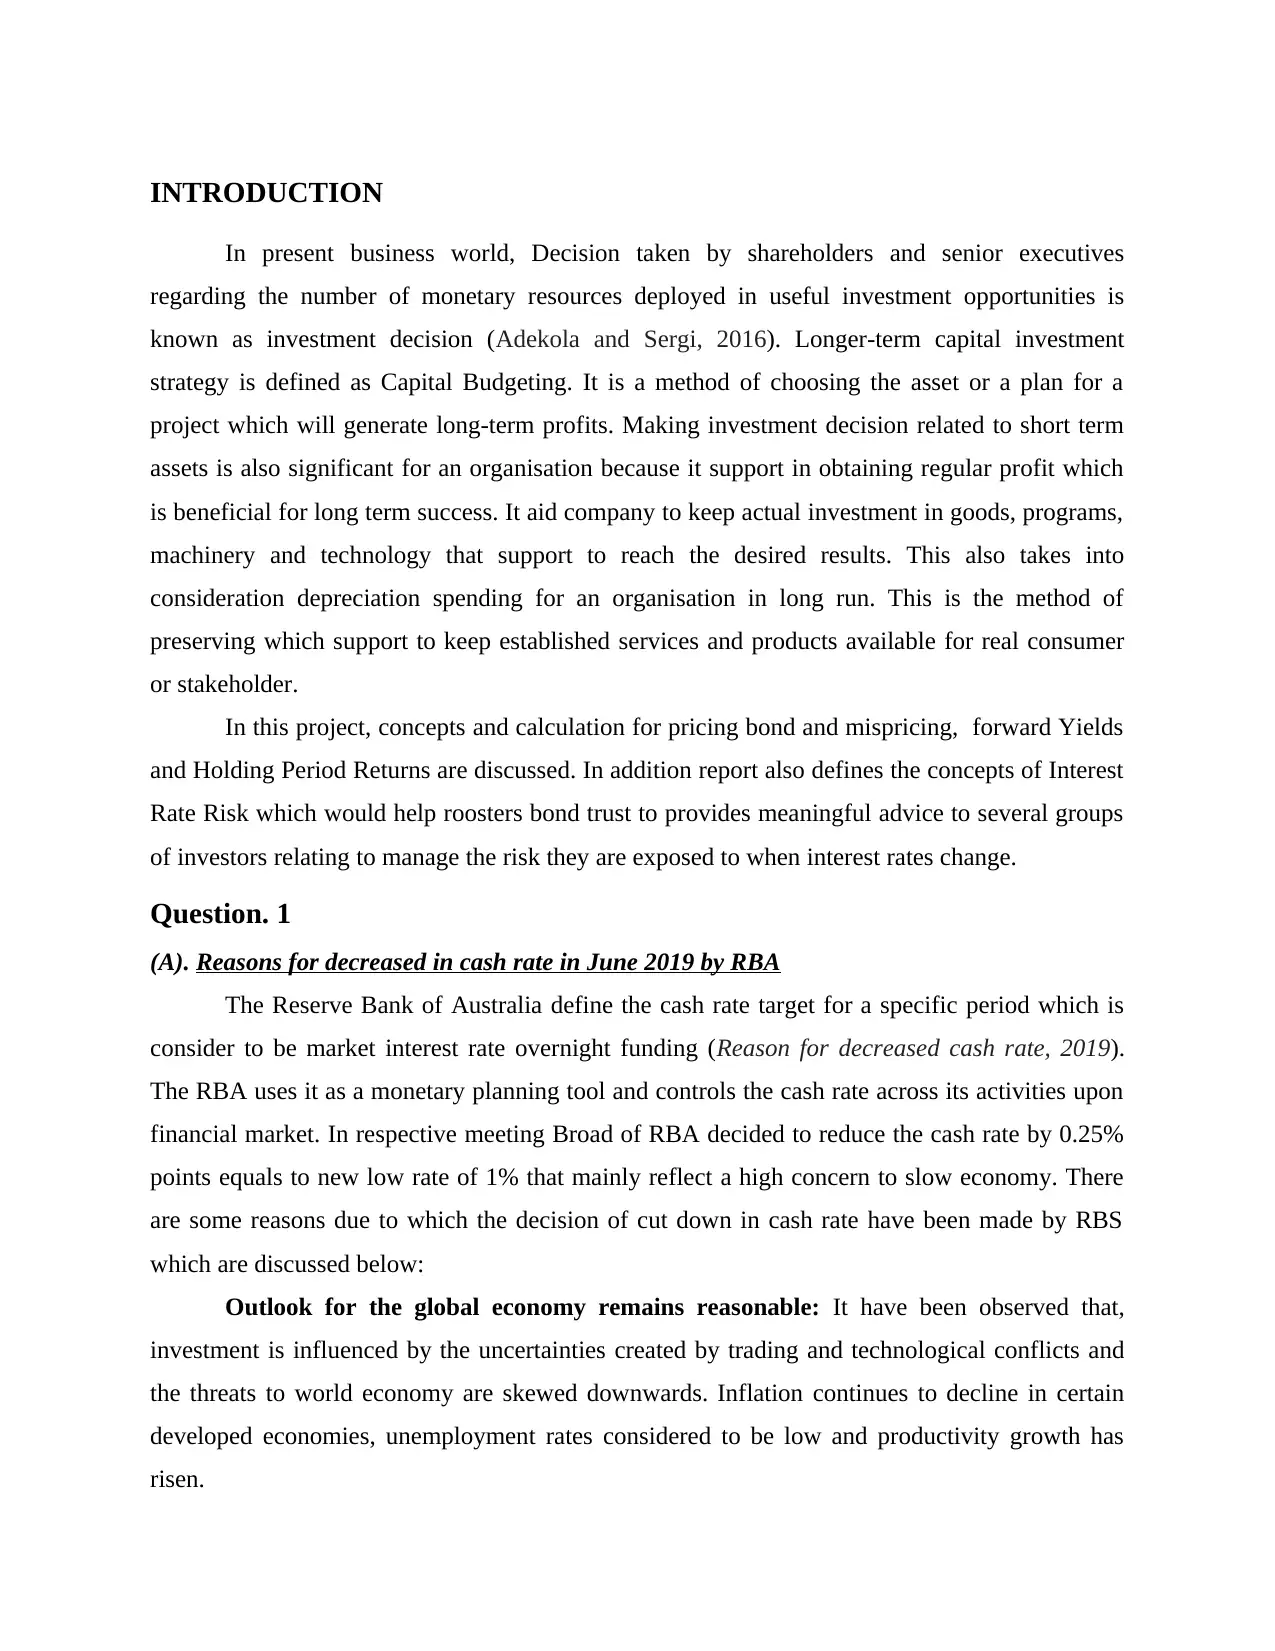
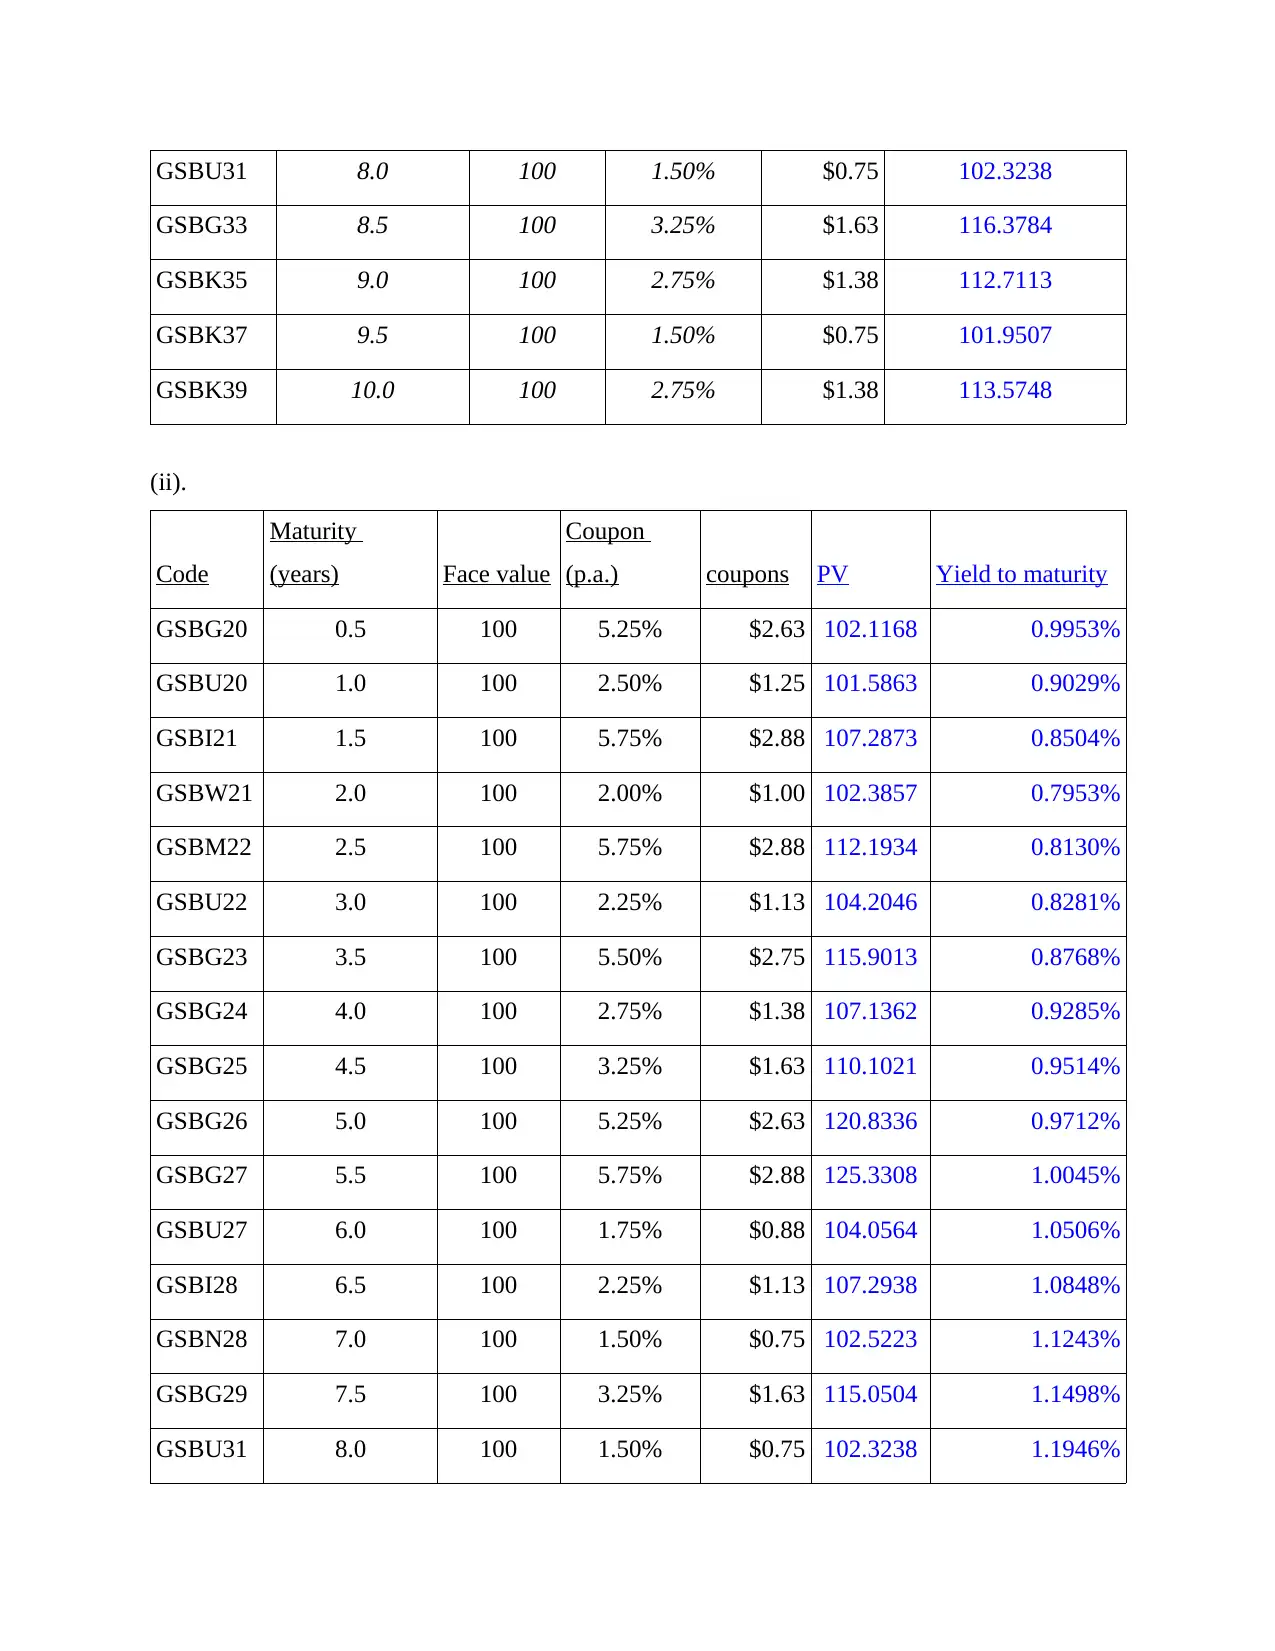
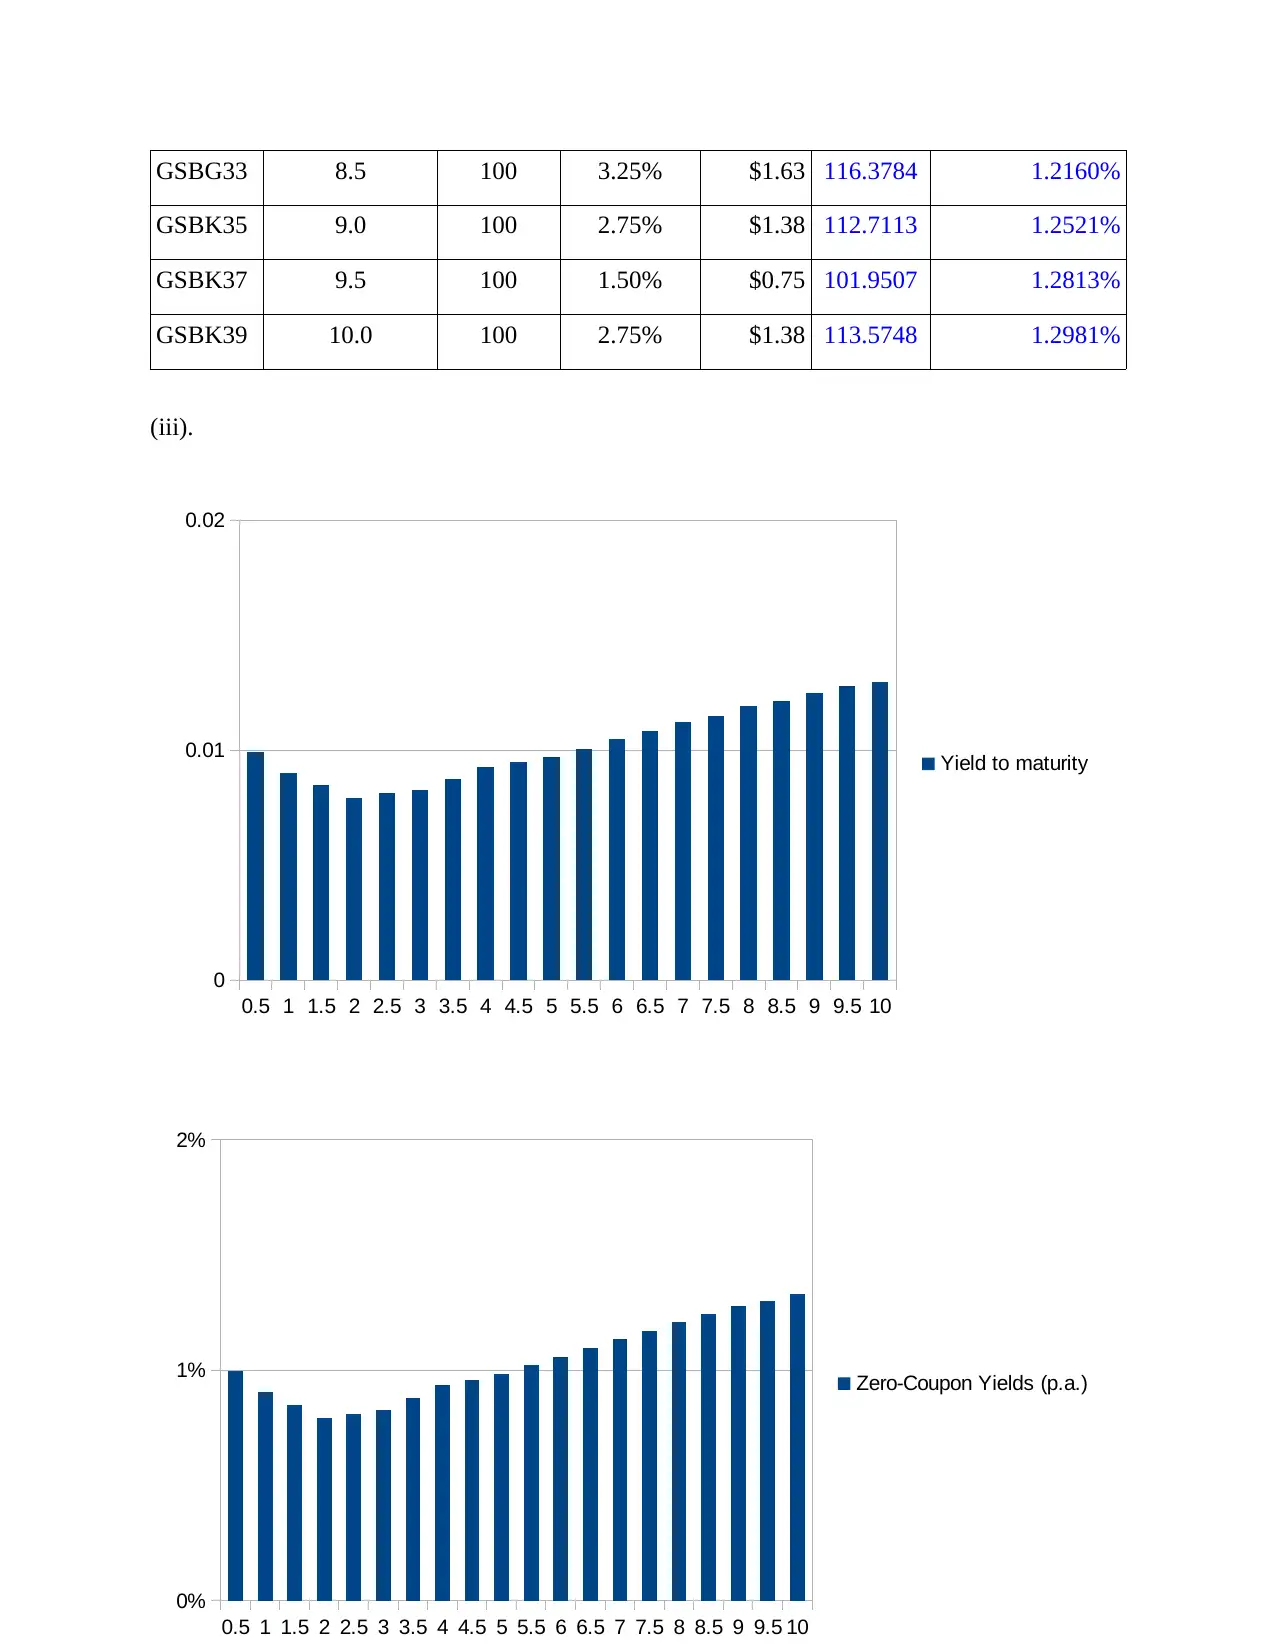
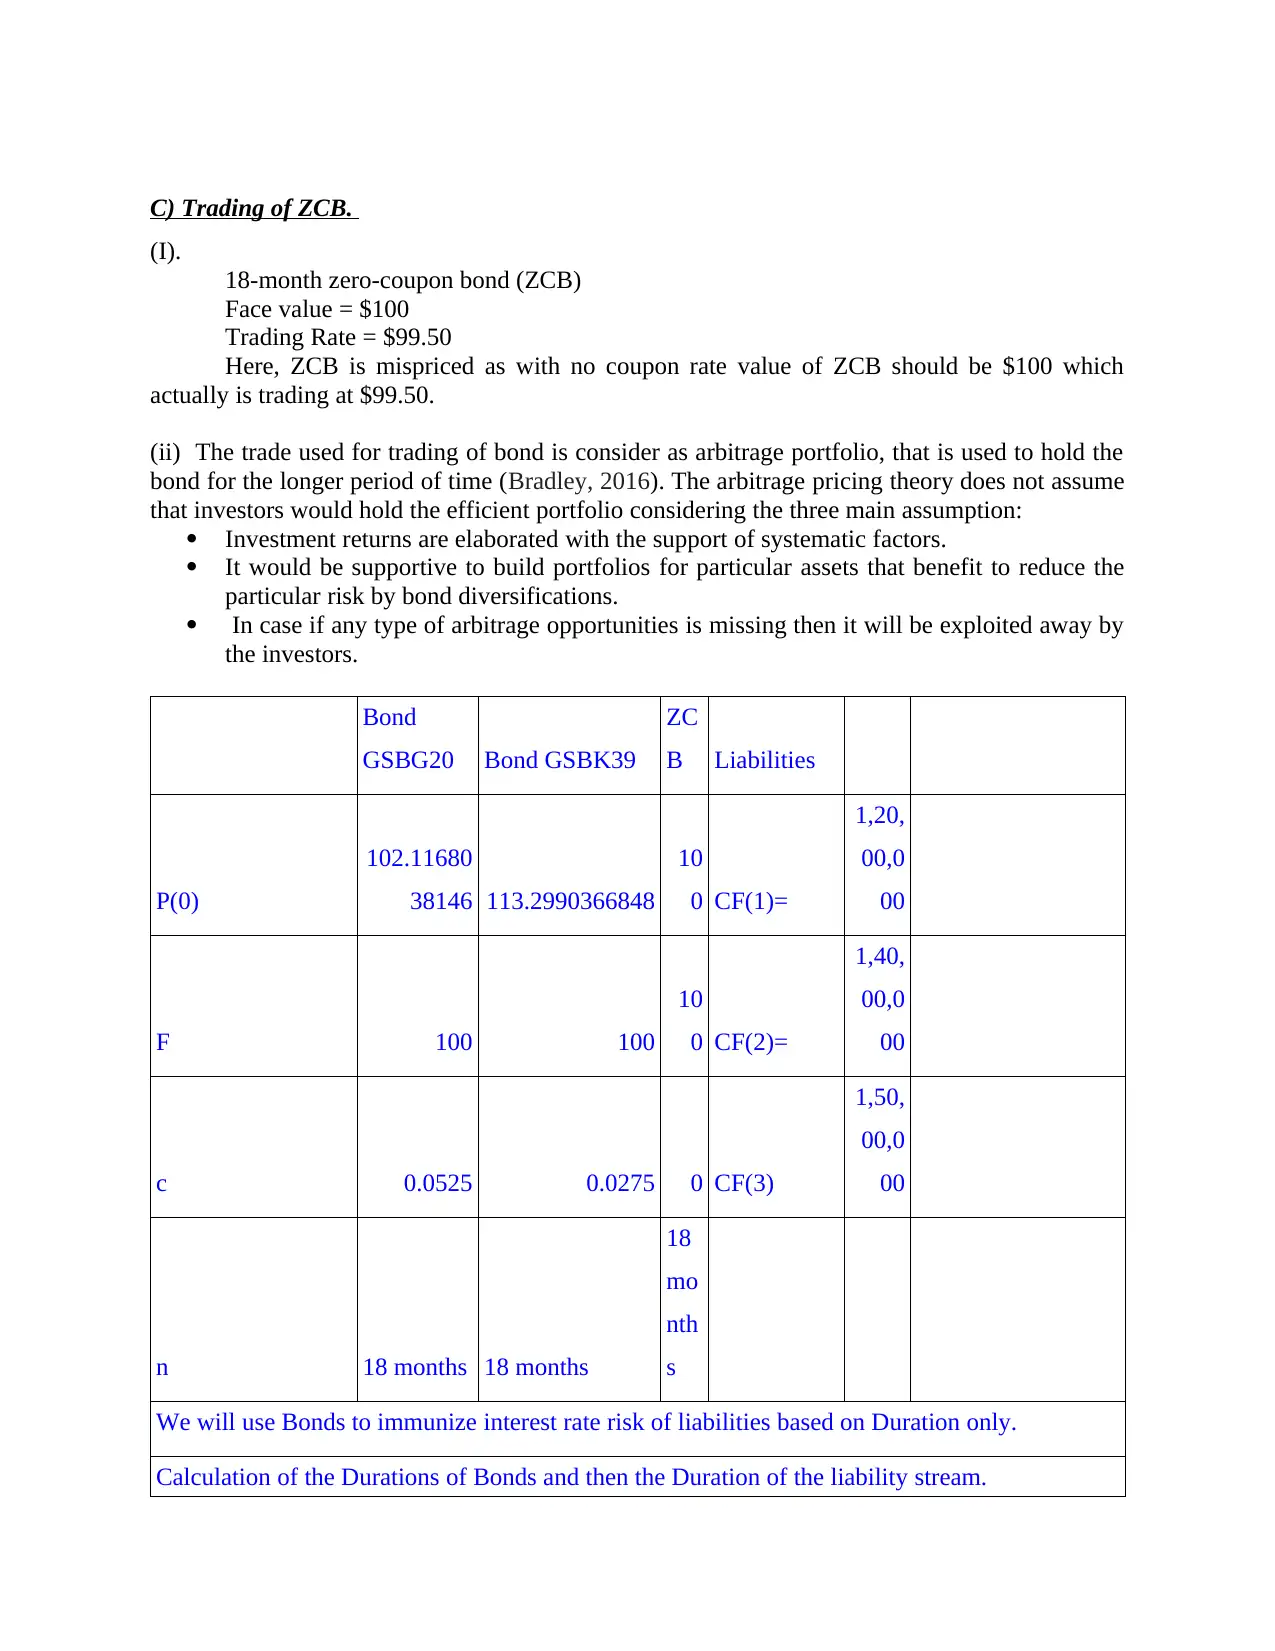
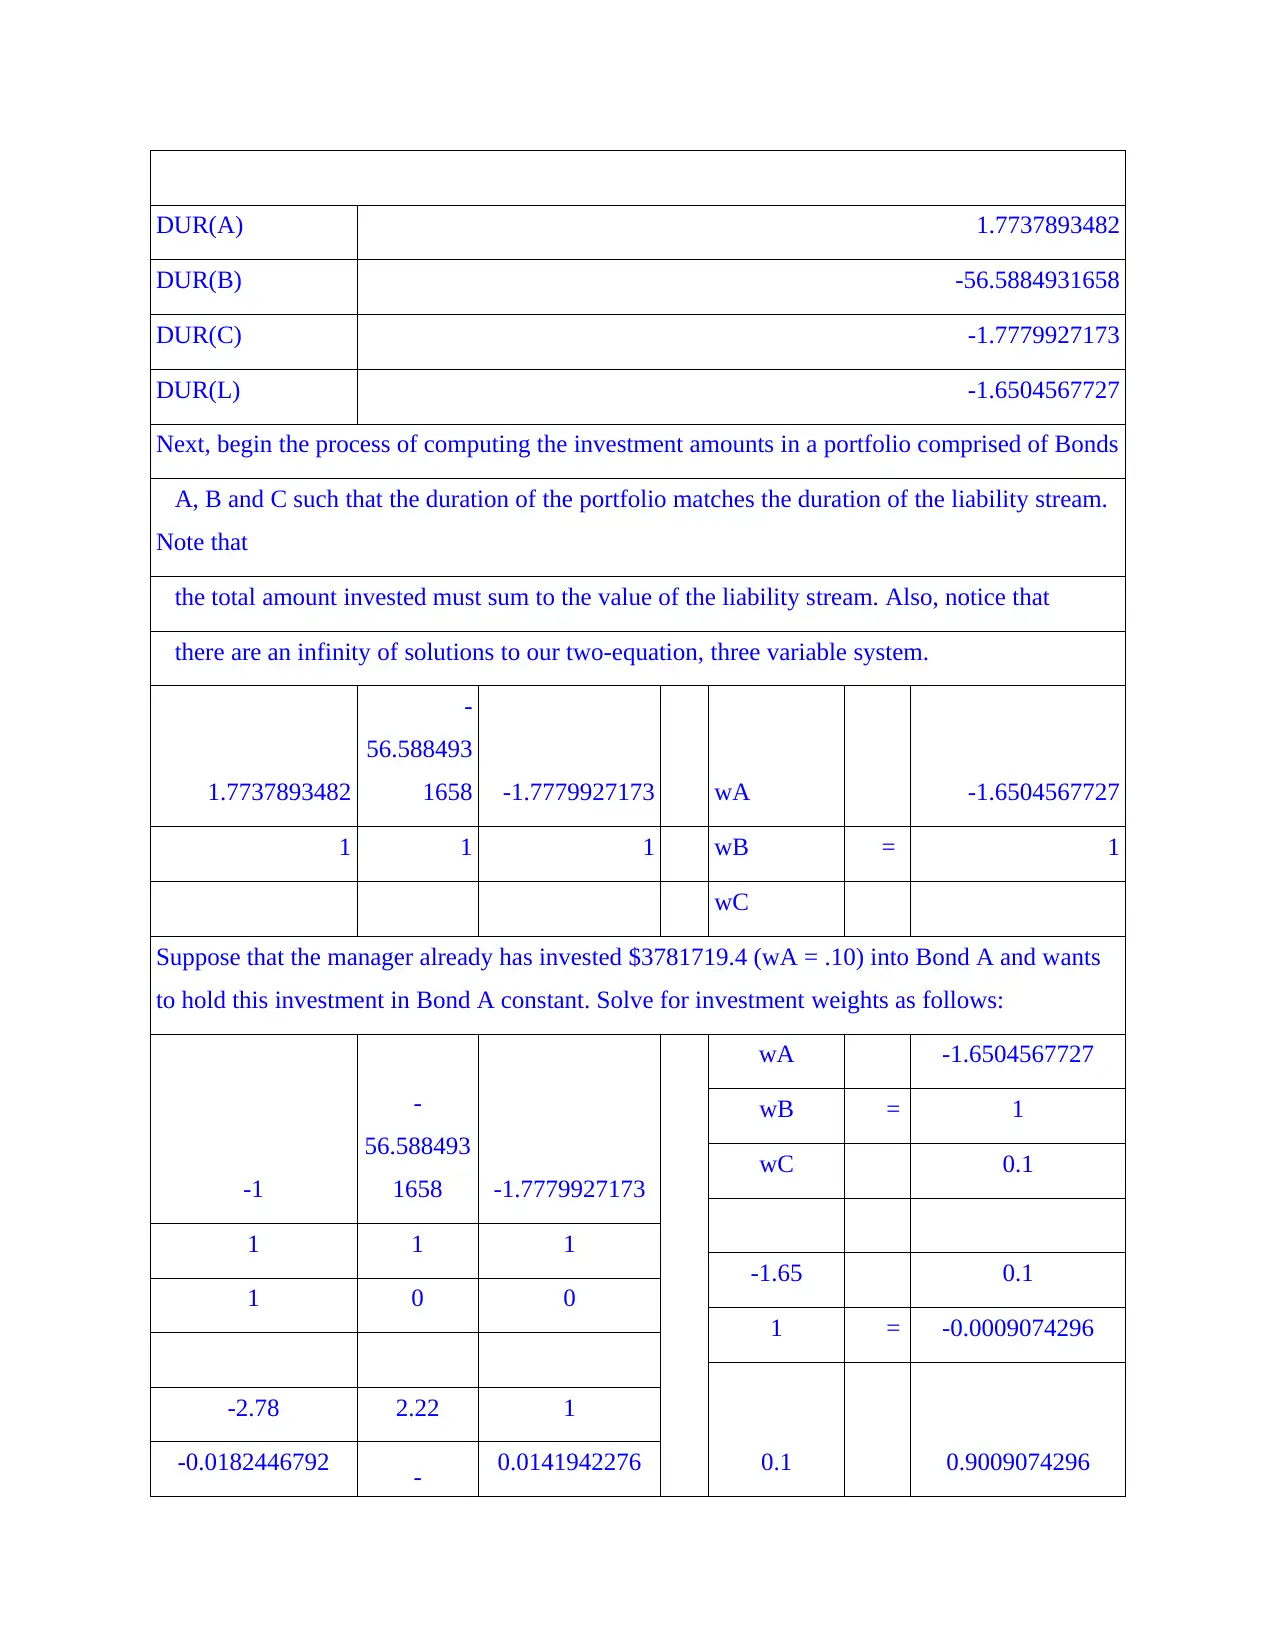
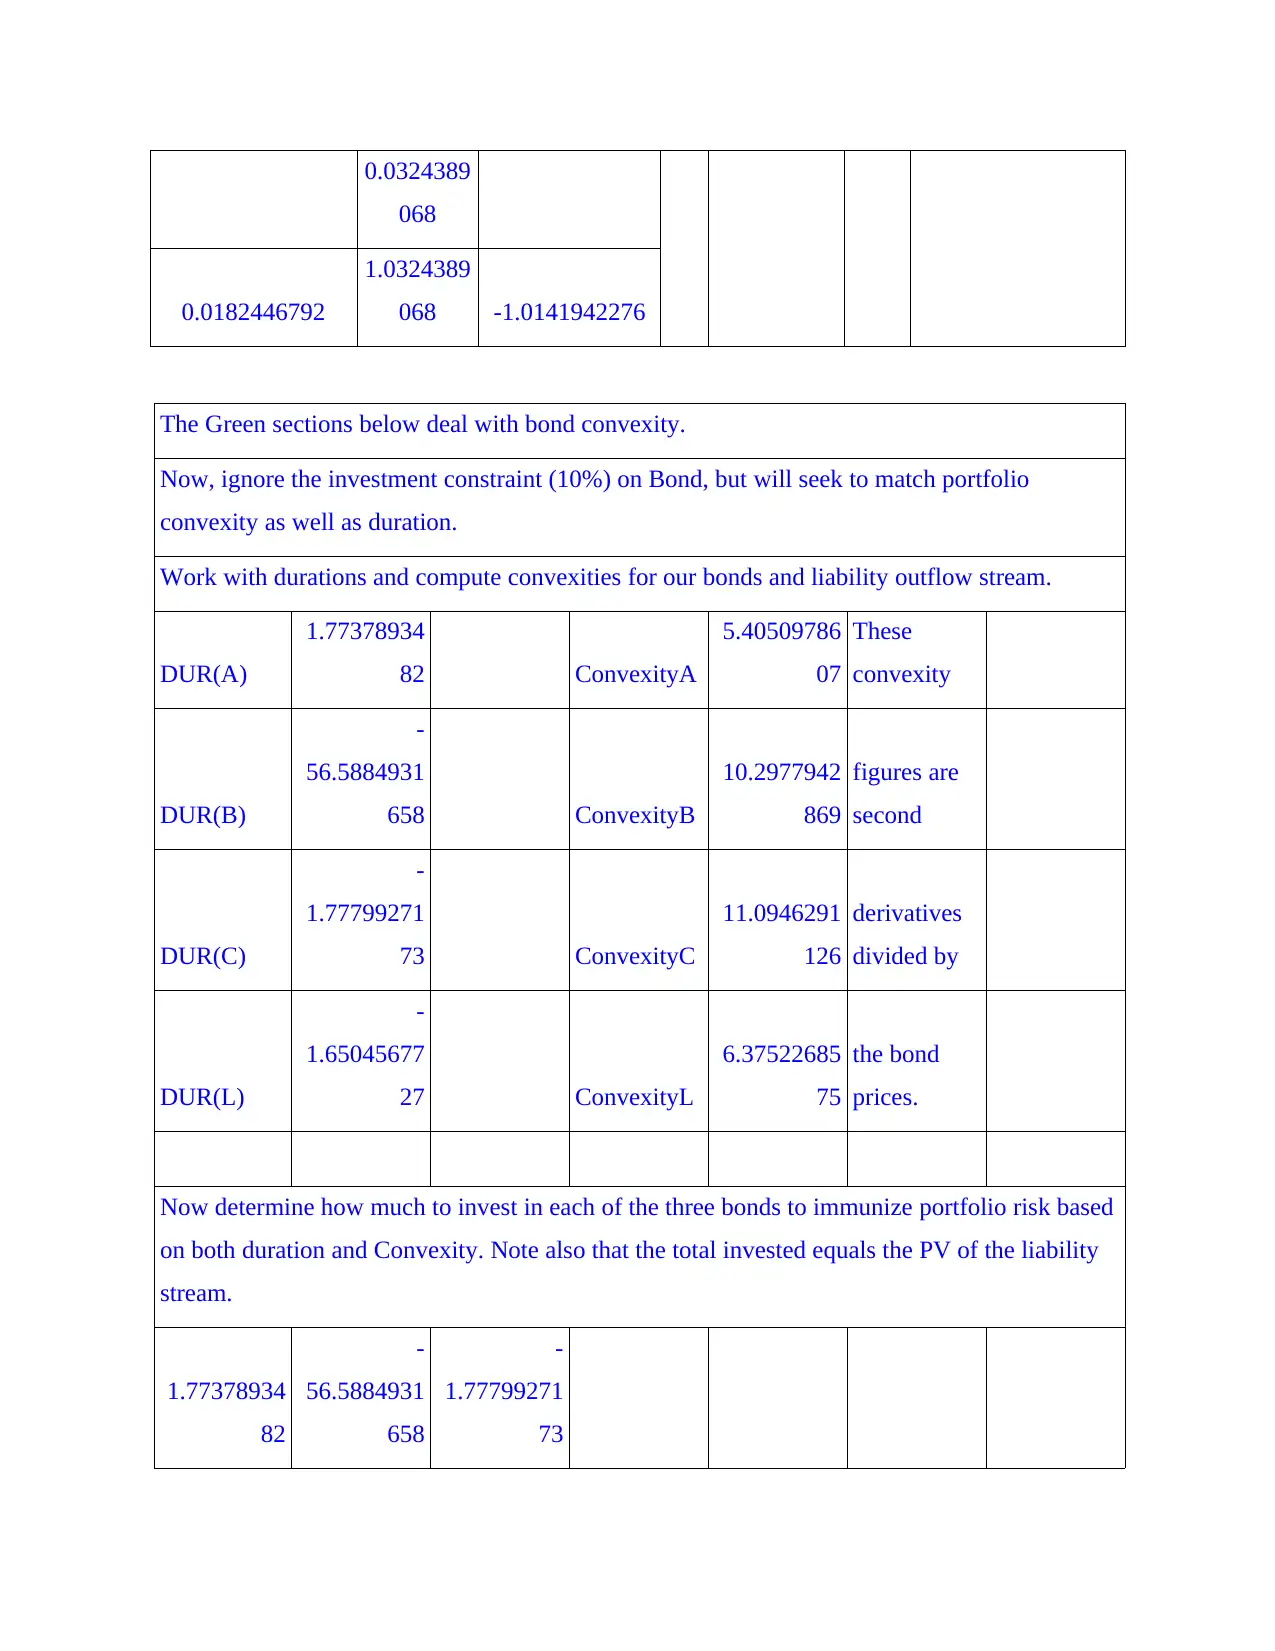
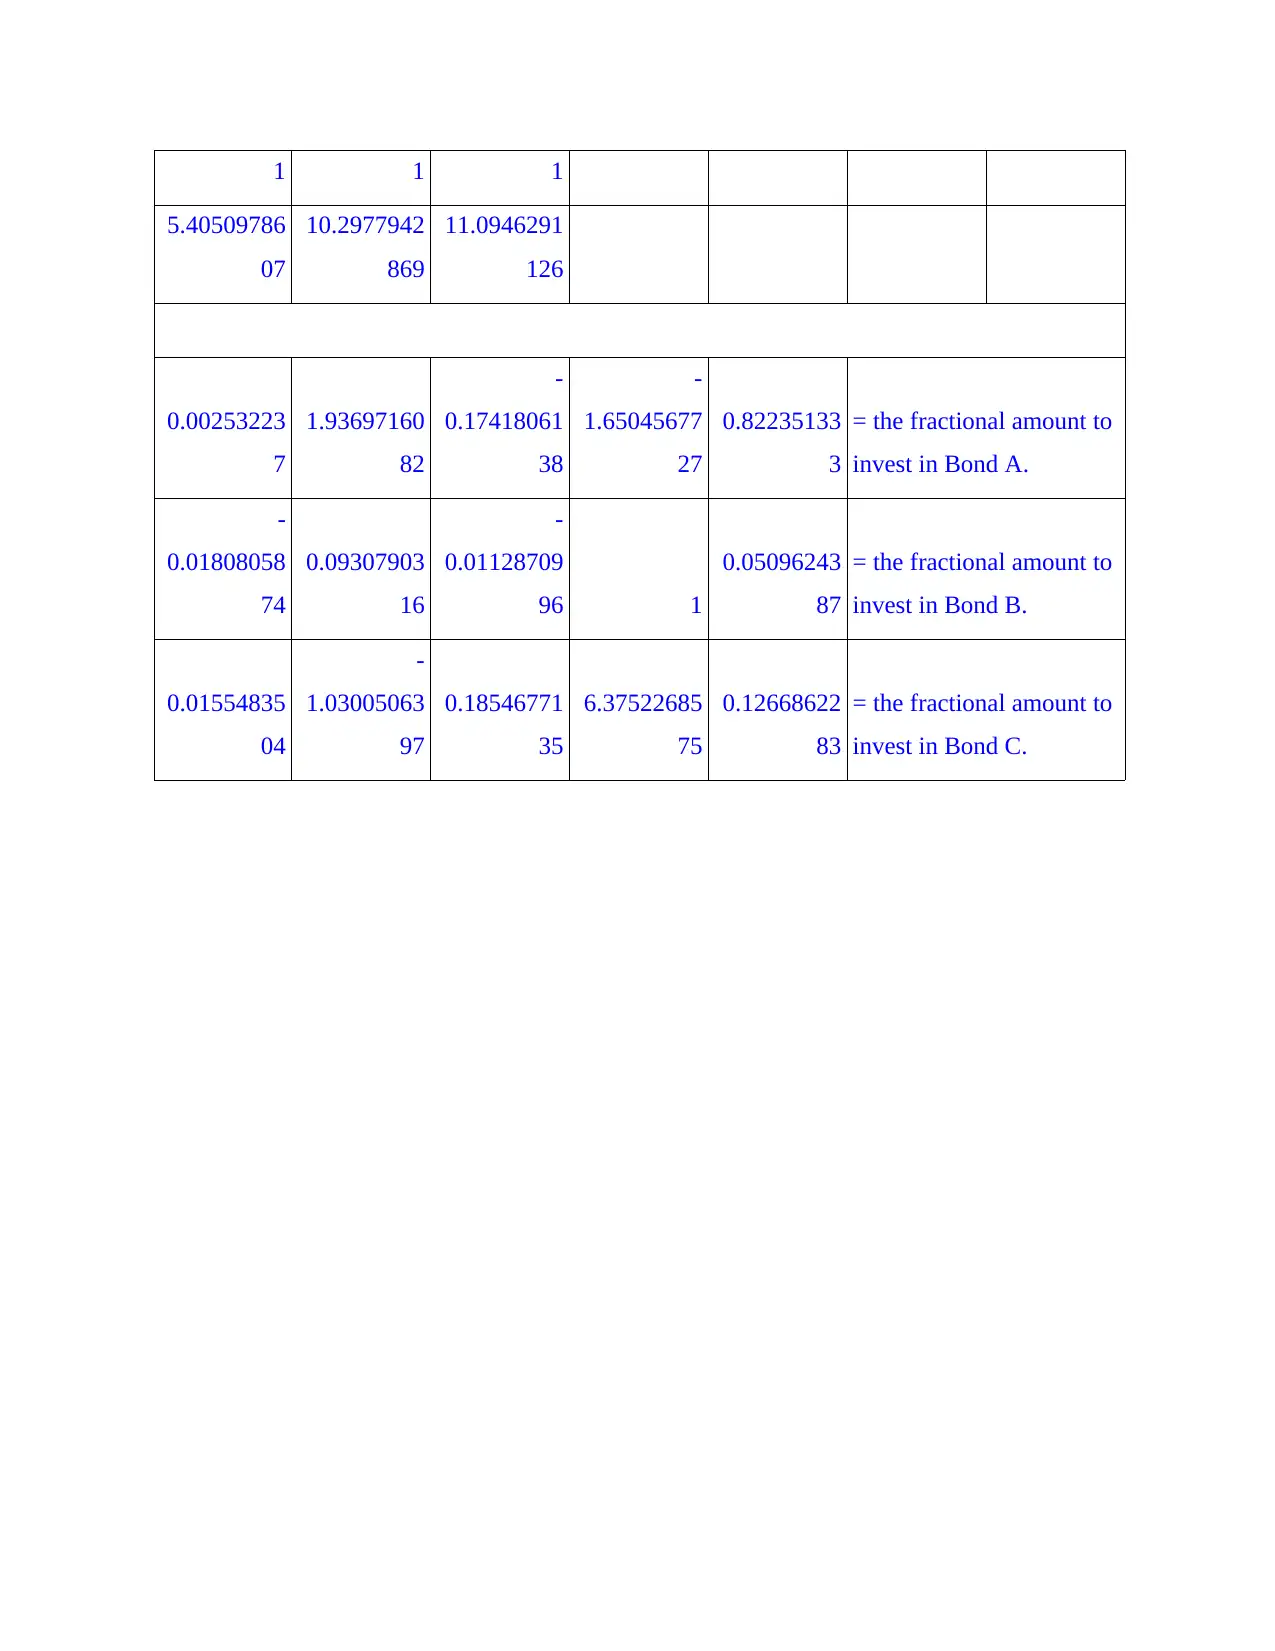
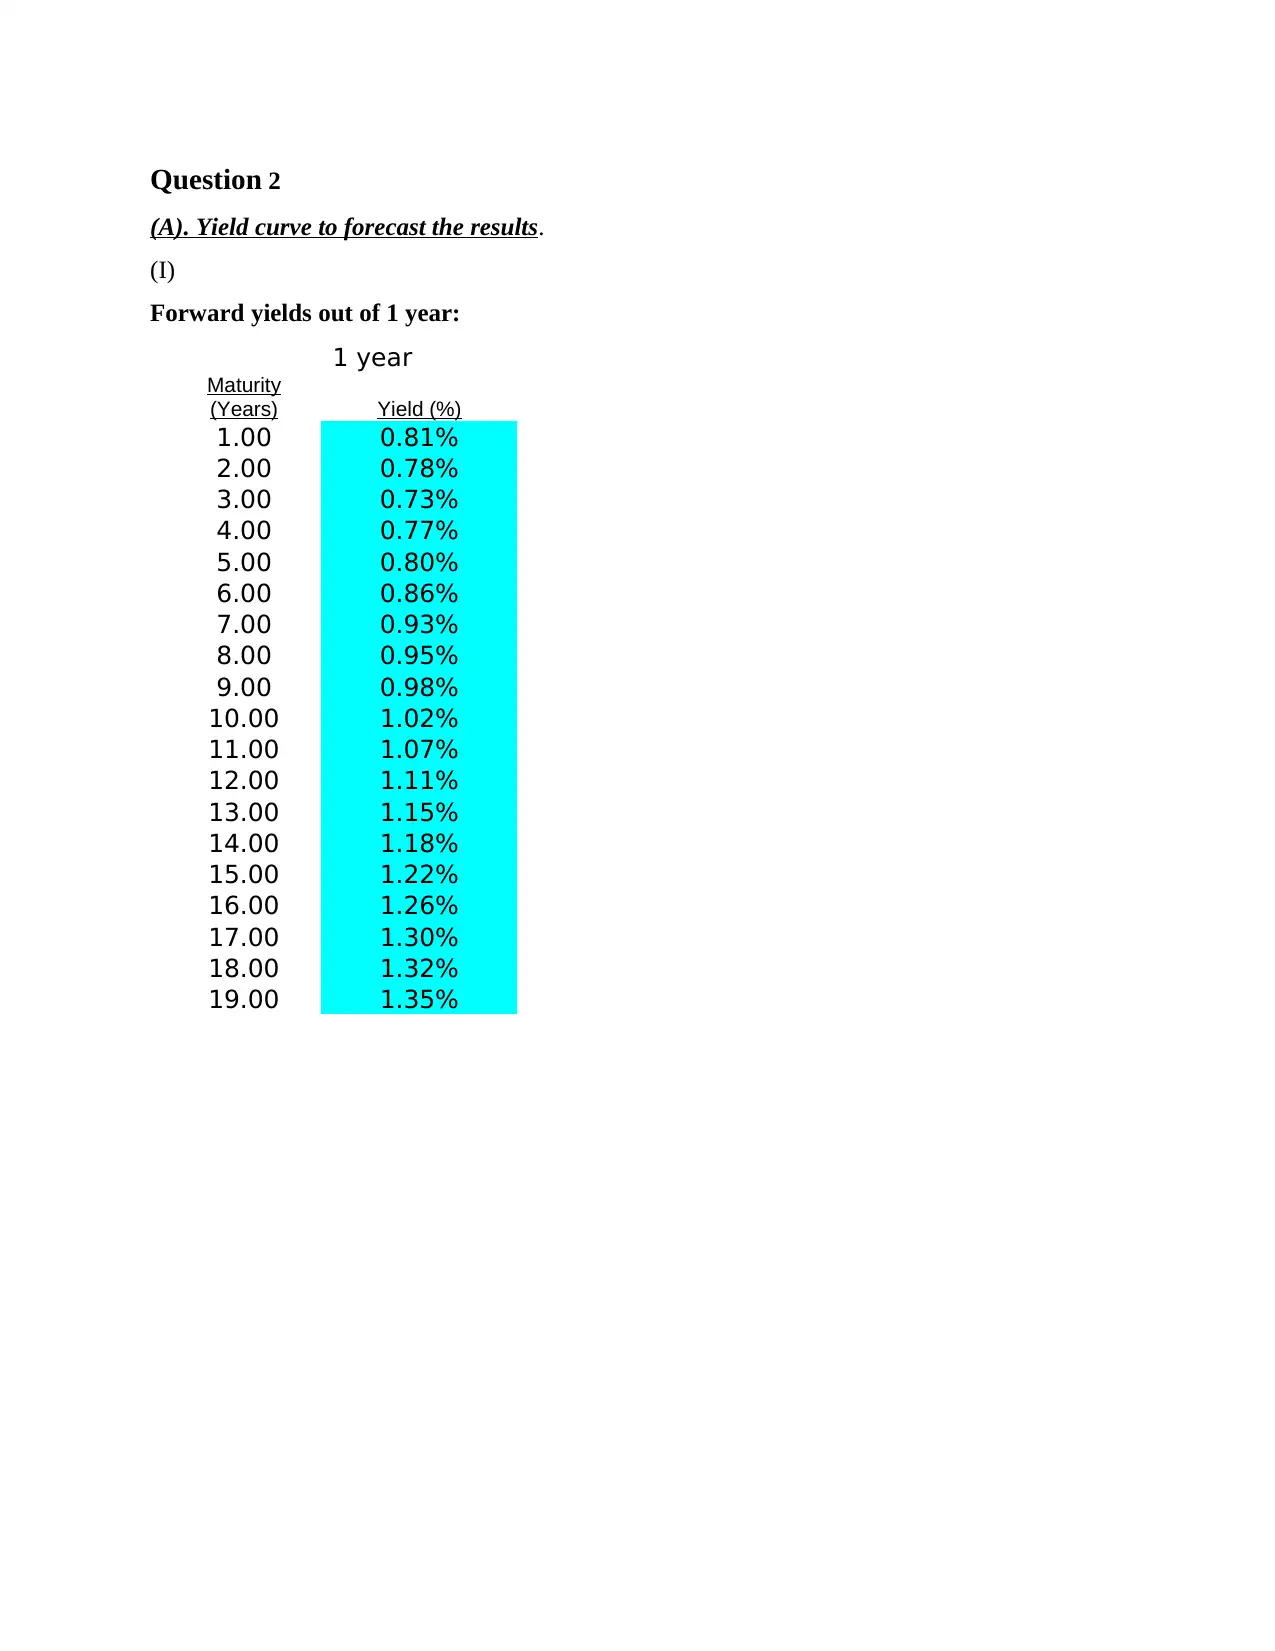
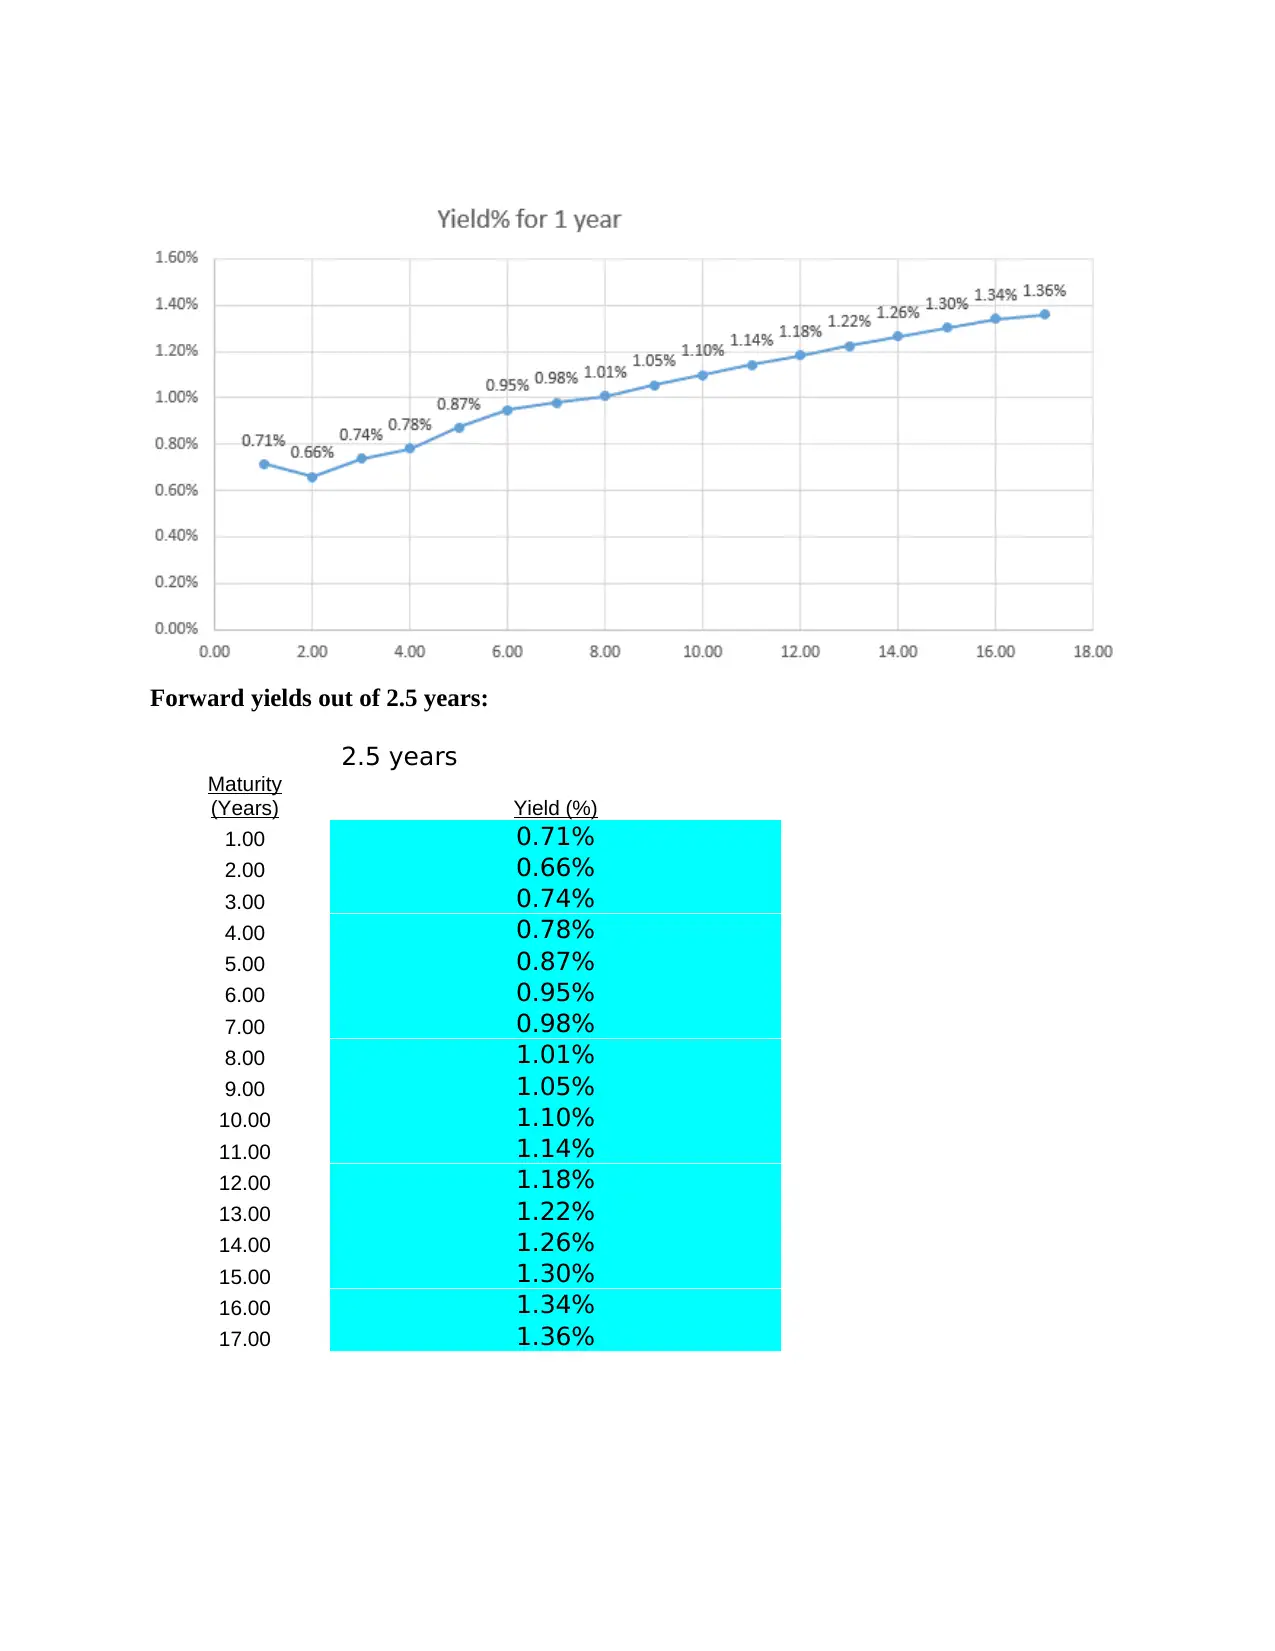
This report delves into the core concepts of investment management, focusing on bond pricing, yield curve analysis, and interest rate risk. It begins with an introduction to investment decisions and capital budgeting, emphasizing the significance of short-term asset investments. The report then analyzes the reasons behind the Reserve Bank of Australia's (RBA) cash rate decrease in June 2019, exploring its impact on the economy. It includes detailed calculations and tables for bond pricing, yield to maturity, and zero-coupon yields. The report also examines the trading of zero-coupon bonds and the application of arbitrage pricing theory. Furthermore, it explores the use of yield curves in forecasting, the theory of liquidity preference, and the impact of interest rate changes on investment strategies, offering insights for Roosters Bond Trust to manage risk effectively. The report concludes with an analysis of bond duration and convexity, providing a framework for immunizing portfolio risk.
Document Page
Investment
Management
tabler-icon-diamond-filled.svg

Paraphrase This Document

Need a fresh take? Get an instant paraphrase of this document with our AI Paraphraser
Document Page
Table of Contents
INTRODUCTION ..........................................................................................................................3
Question. 1.......................................................................................................................................3
Question 2........................................................................................................................................8
Question 3......................................................................................................................................12
CONCLUSION..............................................................................................................................16
References .....................................................................................................................................17
Document Page
INTRODUCTION
In present business world, Decision taken by shareholders and senior executives
regarding the number of monetary resources deployed in useful investment opportunities is
known as investment decision (Adekola and Sergi, 2016). Longer-term capital investment
strategy is defined as Capital Budgeting. It is a method of choosing the asset or a plan for a
project which will generate long-term profits. Making investment decision related to short term
assets is also significant for an organisation because it support in obtaining regular profit which
is beneficial for long term success. It aid company to keep actual investment in goods, programs,
machinery and technology that support to reach the desired results. This also takes into
consideration depreciation spending for an organisation in long run. This is the method of
preserving which support to keep established services and products available for real consumer
or stakeholder.
In this project, concepts and calculation for pricing bond and mispricing, forward Yields
and Holding Period Returns are discussed. In addition report also defines the concepts of Interest
Rate Risk which would help roosters bond trust to provides meaningful advice to several groups
of investors relating to manage the risk they are exposed to when interest rates change.
Question. 1
(A). Reasons for decreased in cash rate in June 2019 by RBA
The Reserve Bank of Australia define the cash rate target for a specific period which is
consider to be market interest rate overnight funding (Reason for decreased cash rate, 2019).
The RBA uses it as a monetary planning tool and controls the cash rate across its activities upon
financial market. In respective meeting Broad of RBA decided to reduce the cash rate by 0.25%
points equals to new low rate of 1% that mainly reflect a high concern to slow economy. There
are some reasons due to which the decision of cut down in cash rate have been made by RBS
which are discussed below:
Outlook for the global economy remains reasonable: It have been observed that,
investment is influenced by the uncertainties created by trading and technological conflicts and
the threats to world economy are skewed downwards. Inflation continues to decline in certain
developed economies, unemployment rates considered to be low and productivity growth has
risen.
Document Page
Global financial conditions remain accommodative: The continued potential risks for
global economy leading to low inflation that have contributed to assumptions that global central
banks would loosen monetary and fiscal policy. Lengthy-term treasury bond rates in a variety of
countries, like within Australia, have fallen significantly at are recorded as the lowest. Bank
bond yields have already decreased in Australia, to money market premiums having totally
reversed from last year's increases (Balaman, 2016).
The announcement today related with lower the cash rate would contribute in making
further advances within economy's excess capacity. This will allow better progress for improving
the economy and more confident movement upwards to the goal of inflation.
(B). Twenty Treasury Bonds and twenty zero-coupon yields (ZCY).
(I).
Code Maturity (years) Face value Coupon (p.a.) coupons Bond Price
GSBG20 0.5 100 5.25% $2.63 102.1168
GSBU20 1.0 100 2.50% $1.25 101.5863
GSBI21 1.5 100 5.75% $2.88 107.2873
GSBW21 2.0 100 2.00% $1.00 102.3857
GSBM22 2.5 100 5.75% $2.88 112.1934
GSBU22 3.0 100 2.25% $1.13 104.2046
GSBG23 3.5 100 5.50% $2.75 115.9013
GSBG24 4.0 100 2.75% $1.38 107.1362
GSBG25 4.5 100 3.25% $1.63 110.1021
GSBG26 5.0 100 5.25% $2.63 120.8336
GSBG27 5.5 100 5.75% $2.88 125.3308
GSBU27 6.0 100 1.75% $0.88 104.0564
GSBI28 6.5 100 2.25% $1.13 107.2938
GSBN28 7.0 100 1.50% $0.75 102.5223
GSBG29 7.5 100 3.25% $1.63 115.0504
tabler-icon-diamond-filled.svg

Paraphrase This Document

Need a fresh take? Get an instant paraphrase of this document with our AI Paraphraser
Document Page
GSBU31 8.0 100 1.50% $0.75 102.3238
GSBG33 8.5 100 3.25% $1.63 116.3784
GSBK35 9.0 100 2.75% $1.38 112.7113
GSBK37 9.5 100 1.50% $0.75 101.9507
GSBK39 10.0 100 2.75% $1.38 113.5748
(ii).
Code
Maturity
(years) Face value
Coupon
(p.a.) coupons PV Yield to maturity
GSBG20 0.5 100 5.25% $2.63 102.1168 0.9953%
GSBU20 1.0 100 2.50% $1.25 101.5863 0.9029%
GSBI21 1.5 100 5.75% $2.88 107.2873 0.8504%
GSBW21 2.0 100 2.00% $1.00 102.3857 0.7953%
GSBM22 2.5 100 5.75% $2.88 112.1934 0.8130%
GSBU22 3.0 100 2.25% $1.13 104.2046 0.8281%
GSBG23 3.5 100 5.50% $2.75 115.9013 0.8768%
GSBG24 4.0 100 2.75% $1.38 107.1362 0.9285%
GSBG25 4.5 100 3.25% $1.63 110.1021 0.9514%
GSBG26 5.0 100 5.25% $2.63 120.8336 0.9712%
GSBG27 5.5 100 5.75% $2.88 125.3308 1.0045%
GSBU27 6.0 100 1.75% $0.88 104.0564 1.0506%
GSBI28 6.5 100 2.25% $1.13 107.2938 1.0848%
GSBN28 7.0 100 1.50% $0.75 102.5223 1.1243%
GSBG29 7.5 100 3.25% $1.63 115.0504 1.1498%
GSBU31 8.0 100 1.50% $0.75 102.3238 1.1946%
Document Page
GSBG33 8.5 100 3.25% $1.63 116.3784 1.2160%
GSBK35 9.0 100 2.75% $1.38 112.7113 1.2521%
GSBK37 9.5 100 1.50% $0.75 101.9507 1.2813%
GSBK39 10.0 100 2.75% $1.38 113.5748 1.2981%
(iii).
0.5 1 1.5 2 2.5 3 3.5 4 4.5 5 5.5 6 6.5 7 7.5 8 8.5 9 9.5 10
0
0.01
0.02
Yield to maturity
0.5 1 1.5 2 2.5 3 3.5 4 4.5 5 5.5 6 6.5 7 7.5 8 8.5 9 9.5 10
0%
1%
2%
Zero-Coupon Yields (p.a.)
Document Page
C) Trading of ZCB.
(I).
18-month zero-coupon bond (ZCB)
Face value = $100
Trading Rate = $99.50
Here, ZCB is mispriced as with no coupon rate value of ZCB should be $100 which
actually is trading at $99.50.
(ii) The trade used for trading of bond is consider as arbitrage portfolio, that is used to hold the
bond for the longer period of time (Bradley, 2016). The arbitrage pricing theory does not assume
that investors would hold the efficient portfolio considering the three main assumption:
ï‚· Investment returns are elaborated with the support of systematic factors.
ï‚· It would be supportive to build portfolios for particular assets that benefit to reduce the
particular risk by bond diversifications.
ï‚· In case if any type of arbitrage opportunities is missing then it will be exploited away by
the investors.
Bond
GSBG20 Bond GSBK39
ZC
B Liabilities
P(0)
102.11680
38146 113.2990366848
10
0 CF(1)=
1,20,
00,0
00
F 100 100
10
0 CF(2)=
1,40,
00,0
00
c 0.0525 0.0275 0 CF(3)
1,50,
00,0
00
n 18 months 18 months
18
mo
nth
s
We will use Bonds to immunize interest rate risk of liabilities based on Duration only.
Calculation of the Durations of Bonds and then the Duration of the liability stream.
tabler-icon-diamond-filled.svg

Paraphrase This Document

Need a fresh take? Get an instant paraphrase of this document with our AI Paraphraser
Document Page
DUR(A) 1.7737893482
DUR(B) -56.5884931658
DUR(C) -1.7779927173
DUR(L) -1.6504567727
Next, begin the process of computing the investment amounts in a portfolio comprised of Bonds
A, B and C such that the duration of the portfolio matches the duration of the liability stream.
Note that
the total amount invested must sum to the value of the liability stream. Also, notice that
there are an infinity of solutions to our two-equation, three variable system.
1.7737893482
-
56.588493
1658 -1.7779927173 wA -1.6504567727
1 1 1 wB = 1
wC
Suppose that the manager already has invested $3781719.4 (wA = .10) into Bond A and wants
to hold this investment in Bond A constant. Solve for investment weights as follows:
-1
-
56.588493
1658 -1.7779927173
wA -1.6504567727
wB = 1
wC 0.1
1 1 1
-1.65 0.1
1 0 0
1 = -0.0009074296
0.1 0.9009074296
-2.78 2.22 1
-0.0182446792 - 0.0141942276
Document Page
0.0324389
068
0.0182446792
1.0324389
068 -1.0141942276
The Green sections below deal with bond convexity.
Now, ignore the investment constraint (10%) on Bond, but will seek to match portfolio
convexity as well as duration.
Work with durations and compute convexities for our bonds and liability outflow stream.
DUR(A)
1.77378934
82 ConvexityA
5.40509786
07
These
convexity
DUR(B)
-
56.5884931
658 ConvexityB
10.2977942
869
figures are
second
DUR(C)
-
1.77799271
73 ConvexityC
11.0946291
126
derivatives
divided by
DUR(L)
-
1.65045677
27 ConvexityL
6.37522685
75
the bond
prices.
Now determine how much to invest in each of the three bonds to immunize portfolio risk based
on both duration and Convexity. Note also that the total invested equals the PV of the liability
stream.
1.77378934
82
-
56.5884931
658
-
1.77799271
73
Document Page
1 1 1
5.40509786
07
10.2977942
869
11.0946291
126
0.00253223
7
1.93697160
82
-
0.17418061
38
-
1.65045677
27
0.82235133
3
= the fractional amount to
invest in Bond A.
-
0.01808058
74
0.09307903
16
-
0.01128709
96 1
0.05096243
87
= the fractional amount to
invest in Bond B.
0.01554835
04
-
1.03005063
97
0.18546771
35
6.37522685
75
0.12668622
83
= the fractional amount to
invest in Bond C.
tabler-icon-diamond-filled.svg

Paraphrase This Document

Need a fresh take? Get an instant paraphrase of this document with our AI Paraphraser
Document Page
Question 2
(A). Yield curve to forecast the results.
(I)
Forward yields out of 1 year:
1 year
Maturity
(Years) Yield (%)
1.00 0.81%
2.00 0.78%
3.00 0.73%
4.00 0.77%
5.00 0.80%
6.00 0.86%
7.00 0.93%
8.00 0.95%
9.00 0.98%
10.00 1.02%
11.00 1.07%
12.00 1.11%
13.00 1.15%
14.00 1.18%
15.00 1.22%
16.00 1.26%
17.00 1.30%
18.00 1.32%
19.00 1.35%
Document Page
Forward yields out of 2.5 years:
2.5 years
Maturity
(Years) Yield (%)
1.00 0.71%
2.00 0.66%
3.00 0.74%
4.00 0.78%
5.00 0.87%
6.00 0.95%
7.00 0.98%
8.00 1.01%
9.00 1.05%
10.00 1.10%
11.00 1.14%
12.00 1.18%
13.00 1.22%
14.00 1.26%
15.00 1.30%
16.00 1.34%
17.00 1.36%
chevron_up_icon
1 out of 19
circle_padding
hide_on_mobile
zoom_out_icon
[object Object]