Financial Accounting: Investment Appraisal and Funding for AYR Co.
VerifiedAdded on 2023/05/30
|27
|4329
|410
Report
AI Summary
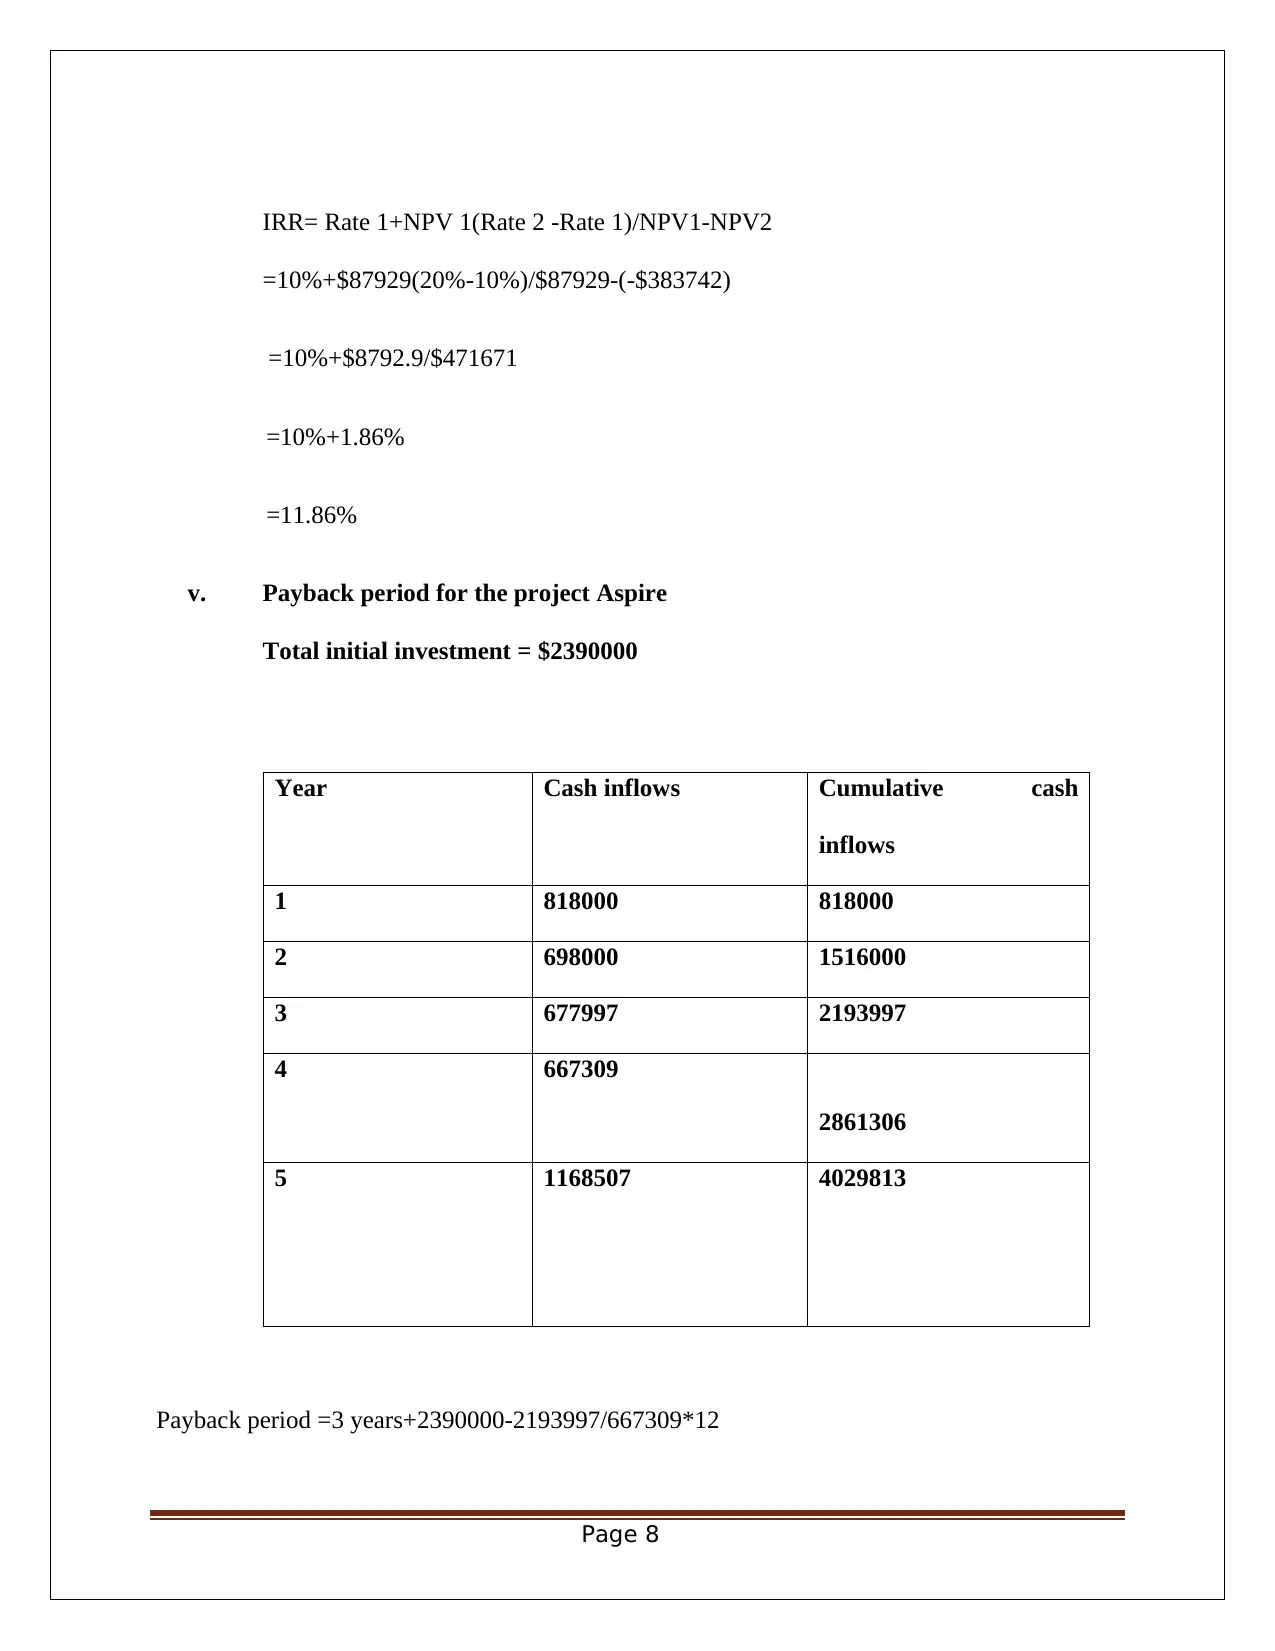
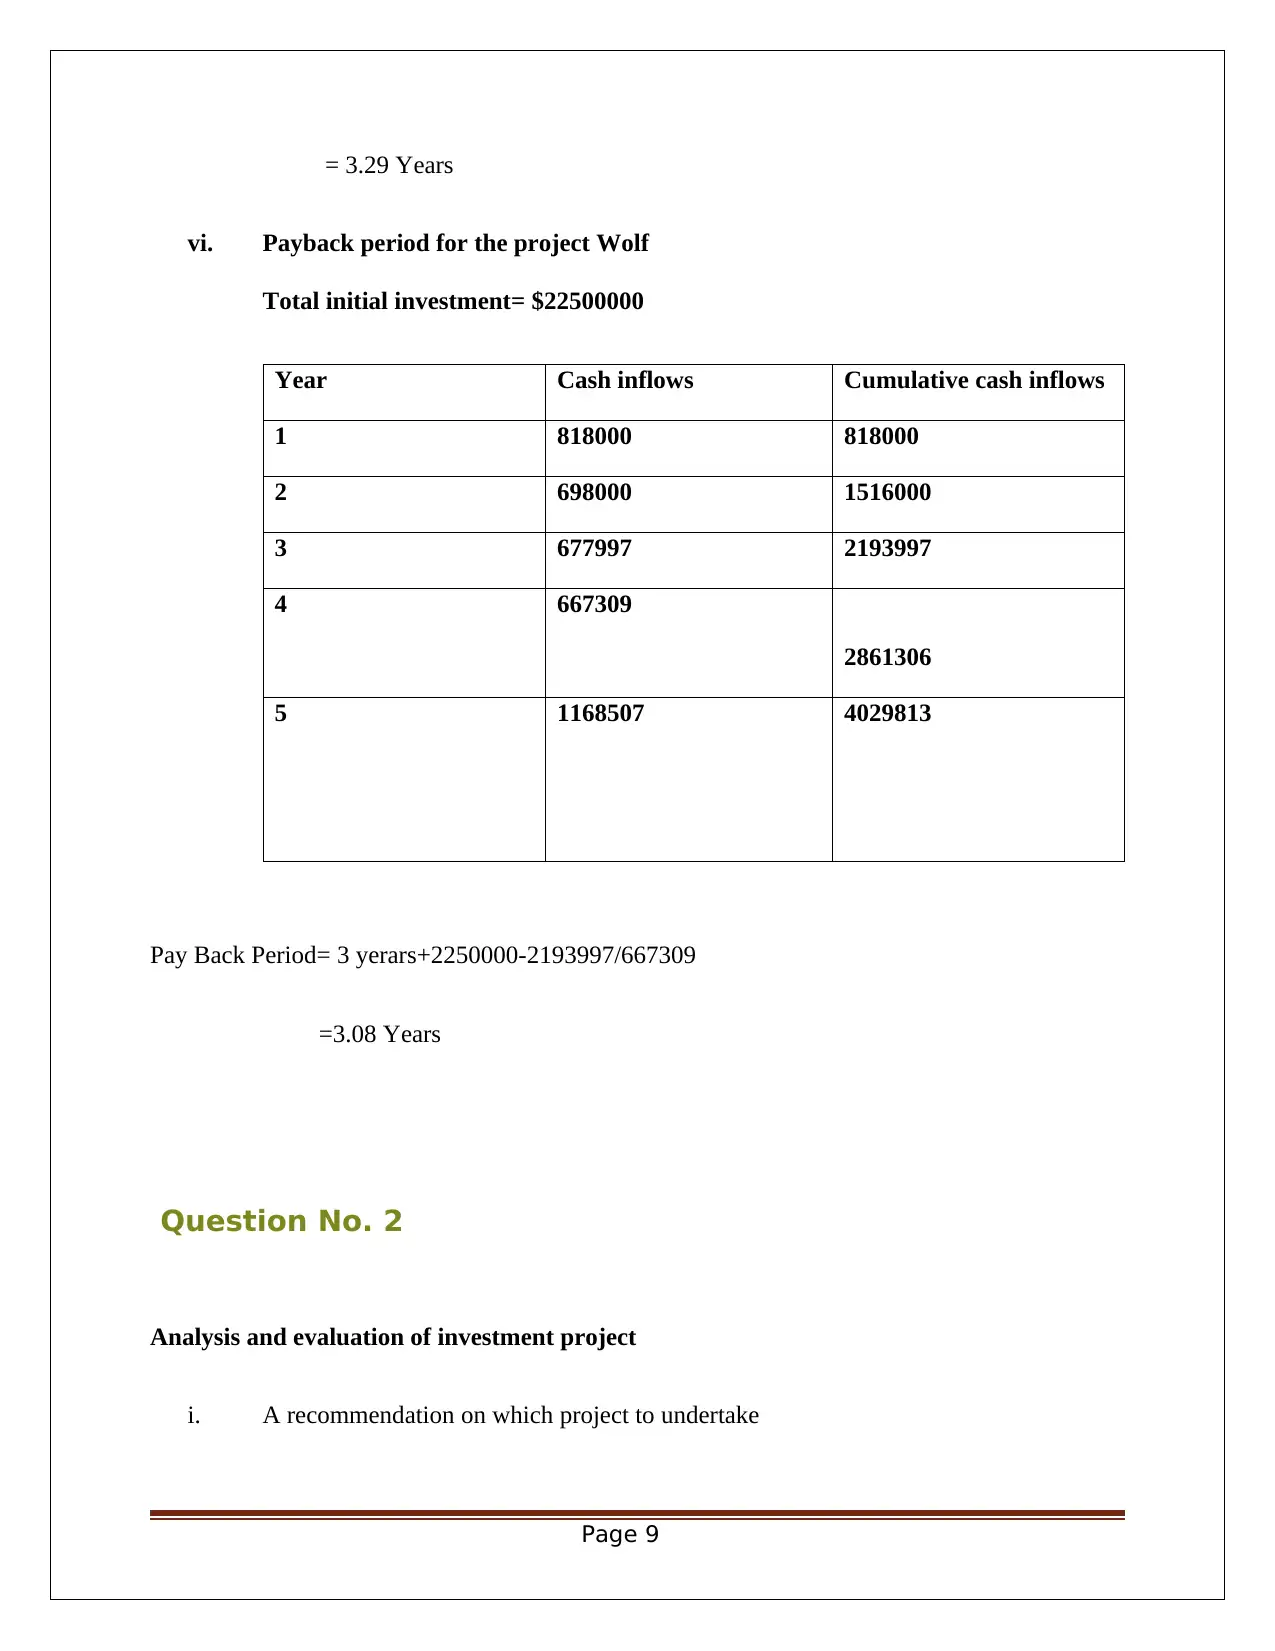
This report provides a comprehensive analysis of two investment projects, Project Aspire and Project Wolf, for AYR Co., utilizing capital budgeting techniques such as Net Present Value (NPV), Internal Rate of Return (IRR), and Payback Period to justify project selection. The report recommends selecting a project and suggests additional factors for consideration beyond capital budgeting results. It also explores appropriate funding sources, including debt and equity, along with their respective costs and impact on the company's weighted average cost of capital. The analysis includes detailed calculations of NPV, IRR, and payback period for both projects, ultimately recommending Project Aspire based on its higher NPV and IRR. The report further discusses the strengths and weaknesses of each capital budgeting technique, emphasizing the superiority of NPV for decision-making. Additional factors such as consumer demand, uncertainty, and economic activity are highlighted for consideration before making a final investment decision. Finally, the report provides a detailed comparison of debt and equity financing, including their costs and implications for AYR Co.
Contribute Materials
Your contribution can guide someone’s learning journey. Share your
documents today.

Financial
Accounting
Assignment
Accounting
Assignment
Secure Best Marks with AI Grader
Need help grading? Try our AI Grader for instant feedback on your assignments.

Prepared By
Student Name:
Date: 25th November 2018
Executive Summary
This report is intended to provide fruitful information to the
Board of Directors of the AYR Co. in relation to the two
investment opportunities currently available with it, naming
Project Aspire and Project Wolf for which the various Capital
budgeting techniques have been resorted to so that to justify the
decision of selection of a project with the concrete evidence.
Further it also recommends the selection of a project and
suggests the other factors to be kept in mind while making
selection of any investment projector opportunities. It also tries
to make the appropriate choice of sources of funds along with the
Page 1
A Brief
Analysi
s of the
evaluati
on of
Investm
ent
options
along
with the
Sources
of
Funds

respective cost of capital and its overall impact on the weighted average cost of capital of the
AYR Co.
Table of Content
s
Executive Summary................................................................................................... 2
Introduction................................................................................................................ 4
Answer to Question No.1............................................................................................ 5
Question No. 2............................................................................................................ 9
Question no.3........................................................................................................... 12
Page 2

Conclusion................................................................................................................ 18
References............................................................................................................... 20
Appendix -1.............................................................................................................. 22
Introduction
AYR Co. is currently in the process of considering the proposed investment to be made in one of
its two projects naming Aspire and wolf respectively for which the board is seeking the
appropriate information along with the strong supportive evidence to justify the selection of any
one of these two projects based on the three Capital budgeting Techniques naming Net Present
Page 3
Secure Best Marks with AI Grader
Need help grading? Try our AI Grader for instant feedback on your assignments.

value, Internal rate of Return and Payback period respectively due to the Budget constraint .
Both projects have its own unique feature like Project Aspire is seen to expand the current
product range and place an appeal to both the current and potential customers, whereas project
wolf shall provide a new direction by appealing to a new group of customers (Charles H, et al.,
2015). Board is also expecting to have a detailed analysis on the recommended selection of any
one of these projects along with the other factors to be kept in mind while making such selection
in addition to the result obtained from the use of capital budgeting techniques. Finally, Board is
seeking advice on the sources of fundi’s. Debt or equity to be chosen for the funding of the
selected project along with the overall impact of such selection on the weighted average cost of
AYR co (Cundill, et al., 2017).
Answer to Question No.1
[See Appendix 1, Peg No.]
Page 4

Before going into the detailed calculation, it is better to have a brief idea on the three of the
Capital Budgeting Techniques, naming Net Present Value, Internal rate of Return and Payback
Period, which have been discussed below:
Net Present Value
It is the method of capital budgeting in which at first the future cash inflows to be generated in
the project are estimated, thereafter this future values of cash inflows are discounted at a rate to
arrive at the present value of future Cash inflows from which the present value of cash outflow,
that is the value of investment proposed to be made in present is subtracted to get the Net present
Value of the project (Kaufmann, 2017). If the value derived is positive, then it is recommended
to select the project otherwise not.
Internal rate of Return
It is the rate of return at which the net present value of the project is zero or in other words it is
the rate at which present value of cash inflow is equal to the present value of cash inflows. The
reason behind calling it the internal rate of return is because it doesn’t consider the external
factors like inflation etc. while determining the rate of return (Bennouna, et al., 2010).
Payback period
Under this method without taking into the time value of money in to the consideration, it tries to
calculate the period which is required to recover the initial capital investment proposed to be
Page 5

made in a specific project. It does not consider the cash inflows generated after the payback
period.
i. Computation of NPV of the Project Aspire
=Present value of cash inflow- Present value of cash outflow
=$818000/ (1.1) ^1+$698000/ (1.1) ^2+$677997/ (1.1) ^3+$667309/ (1.1) ^4+$653507/ (1.1)
^5+$140000/ (1.1) ^5+$375000/ (1.1) ^5-$140000-$2250000
=$3011487-$2390000
=$621487
ii. Computation of NPV of the Project Wolf
= Present value of cash inflow- Present value of cash outflow
=$83300/(1.1)^1+$648700/(1.1)^2+$647511/(1.1)^3+$646524/(1.1)^4+$645461/(1.1)^5-
$2250000-$75000/(1.1)^1-75000/(1.1)^2-75000/(1.1)^3-75000/(1.1)^4-75000/(1.1)^5
=$2622238-$2534309
=$87929
iii. Computation of internal rate of return of Project Aspire
Page 6
Paraphrase This Document
Need a fresh take? Get an instant paraphrase of this document with our AI Paraphraser

Internal rate of return of the project is that rate at which present value of cash inflow
is equal to present value of cash outflow
Froom the above,
10%=$621487, Rate 1 = 10%, NPV1
X% =$2390000
Taking discount rate 20%, Rate 2
NPV 2=$-39616
IRR= Rate 1+NPV 1(Rate 2 -Rate 1)/NPV1-NPV2
=10%+$621487(20%-10%)/$621487-(-$39616)
=10%+$62148.7/$661103
=10%+9.40%
=19.40%
iv. Computation of internal rate of return of Project Wolf
From the above,
Rate 1=10%=$87929(NPV1)
Rate2 (taken 20%)
NPV = $-383742
Page 7

IRR= Rate 1+NPV 1(Rate 2 -Rate 1)/NPV1-NPV2
=10%+$87929(20%-10%)/$87929-(-$383742)
=10%+$8792.9/$471671
=10%+1.86%
=11.86%
v. Payback period for the project Aspire
Total initial investment = $2390000
Year Cash inflows Cumulative cash
inflows
1 818000 818000
2 698000 1516000
3 677997 2193997
4 667309
2861306
5 1168507 4029813
Payback period =3 years+2390000-2193997/667309*12
Page 8

= 3.29 Years
vi. Payback period for the project Wolf
Total initial investment= $22500000
Year Cash inflows Cumulative cash inflows
1 818000 818000
2 698000 1516000
3 677997 2193997
4 667309
2861306
5 1168507 4029813
Pay Back Period= 3 yerars+2250000-2193997/667309
=3.08 Years
Question No. 2
Analysis and evaluation of investment project
i. A recommendation on which project to undertake
Page 9
Secure Best Marks with AI Grader
Need help grading? Try our AI Grader for instant feedback on your assignments.

On the basis of the above detailed calculation as we can see that the NPV of Project
Aspire is greater than the project Wolf, similarly the Internal Rate of Return of
Project Aspire and Project wolf both the projects are greater than the cost of capital or
the weighted average cost of capital of the company, but IRR in case of Project
Aspire is much higher than the IRR of Project Wolf, though using payback period we
can see that the payback period of Project Aspire is higher than the project wolf, but
still we would recommend the selection of the Project Aspire in the given case (Borit
& Olsen, 2012).
ii. Justification for our recommendation including an evaluation of the investment
appraisal techniques used in 1 above
In this case we need to compare amongst the three capital budgeting techniques used
above that which one is to be based while making our recommendation in i above.
Through the Net present value technique, it becomes possible to discount each cash
flow separately, it is preferable in those cases when the project’s discount rate is also
not known. Though in most of the cases both NPV and IRR are much widely used
techniques, but at times they may provide different results in the scenario when there
are variations found in the estimated cash inflows, cash outflows and in the duration
of the project. At the same time the IRR technique doesn’t consider the impact of
external factors on the discount rate being chosen (Carolus, et al., 2018). Truly
speaking IRR doesn’t provide the absolute value, rather it is expressed in terms of
Page 10

certain percentage at which the company shall neither make profit nor loss, hence it
makes the decision-making process rather complicated. At the same time NPV
presents the surplus or deficit (if negative) generated from the project.
The payback period method is associated with the greatest weakness of not
considering the Time value of money factor, hence it shall not be recommended to
reach to a decision based on the result obtained using this technique. It even does not
take into consideration the cash flows generated beyond the payback back period
(Coate & Mitschow, 2017).
Hence in the given case from the above analysis it is quite clear that the use of Net
present value techniques has much more preference over the other two techniques,
hence our recommendation has been based on result obtained through NPV technique
(Hansen, et al., 2003).
iii. A summary of other factors that should be considered and information that may be
needed prior to make a final decision
The following are the additional factors to be kept in mind while making final
decision
a. Consumer demand
b. Element of uncertainty
c. Innovations and inventions
Page 11

d. Level of income
e. Corporation Tax
f. The level of savings
g. The accelerator effects
h. The stock of capital
i. The level of economic activity etc.
Question no.3
A discussion on the two factors of financing being considered by the board of directors by
the board of directors of AYR co
i. A description of debt and equity
In case of any business there are basically two modes of finance available with the
merits and demerits associated with each of them.
Debt financing simply means borrowing fund without sharing the ownership
rather promising a fixed percentage of return in terms of interest, whereas equity
means amount paid into the business by the owners of the business in exchange of
a share of profit earned by the business using their funds (Covaleski, et al., 2003).
Whereas the business gets the tax shield on the interest paid to the borrowers, but
there is no such savings generated from the dividend paid to the equity holders of
Page 12
Paraphrase This Document
Need a fresh take? Get an instant paraphrase of this document with our AI Paraphraser

the business (Kusolpalalert, 2018). Raising the quantity of debt may also cause
the cost of bankruptcy to the entity if it is found that the firm is overcapitalized in
terms of debt financing. The equity holders are the real risk takers of the business.
Debt financing is considered cheaper over the equity financing due to the limited
amount of the risk associated with it. Debt fund may be obtained for short term or
long-term purpose depending on the requirement of the fund (Cundill, et al.,
2017).
ii. An explanation on the cost of each source of finance
Cost of debt
The cost of debt is the effective rate of interest an entity pays on its debt fund. The
interest paid to the debt fund holders is a tax-deductible expenditure, hence
whenever the term cost of debt is used it is meant as after tax cost of debt
(Ghofiqi, 2018). There is an inverse relationship between the cost of debt and the
rate of tax. As the rate of tax increases the cost of debt decreases and vice-versa.
The formula used for the calculation of the cost of debt is as follows:
Kd= I(1-tc)
Where,
Kd= After tax cost of debt
I =Rate of Interest
Page 13

Tc= Tax rate
Cost of equity
It is the rate of return theoretically proposed to be paid to the equity shareholders
of the company in exchange of the risk undertaken by them while making their
investment in the entity. There are basically two formulas used while calculating
the cost of equity, the first being Dividend capitalization model and capital asset
pricing model (Gullet, et al., 2018).
The formula used are prescribed hereunder:
Under the Capital asset pricing model, the level of risk in relation the market is
considered. But is less preferred because of its use of historical information
E=Rf+Beta*(Rm-Rf)
Where E = Expected return from the Asset
Rf= Risk-free Rate of return
Beta= Systematic Risk of the asset
Rm= Return from the market
Risk Free rate of return is the rate of return expected to be received from making
the risk-free investments
Page 14

Beta is the measurement of volatility that can be obtained online or may even be
calculated using the regression analysis through dividing the covariance of the
market return and asset by variance of the market. If the Beta is less than one
means the asset is less volatile, if it is equal to one then it means that its volatility
is that of equal to the market, but if it greater than market, then it means that the
asset is much more volatile in relation to the market (Kusnadi & Wei, 2017).
Dividend capitalization model
This approach for equity valuation can only be applied for the companies paying
dividend, that assumes that the dividend shall grow at a constant rate but does not
consider the extent of risk as being considered by the capital asset pricing model
(Boghossian, 2017).
The formula to be used
E=(D1/P0)/G
Where
E= Cost of equity
D1= Dividend in next year
P0= Current market price of the share
Page 15
Secure Best Marks with AI Grader
Need help grading? Try our AI Grader for instant feedback on your assignments.

G= growth rate of dividend
Dividend for the future years can easily be obtained as generally the companies
announce the dividend in far advance before the date of actual distribution of the
dividend (Norberg, 2018).Current market price of the share can be obtained from
the Stock exchange search.
Growth rate of dividend
If the rate of growth of the dividend is not known, then in that case it can be
obtained using the following formula
G=(DTh/dt-1)-1
Where,
Dt= payment of dividend in T period
Dt-1= payment of dividend one year prior to t period
iv. An analysis of the effect of the selection of the source of finance may have on AYR
co.’s weighted average cost of capital
If the entire fund is invested by means of debt. then the new capital structure of AYR
co shall be
Equity = $20 million
Page 16

Debt= $18+$2.25= $20.25 million
Let the after-tax cost of debt be 5% and cost of equity be 7%
Hence the WACC would be
=5*$20.25/$40.25+7*$20/$40.25
=5.99%
If the entire fund is invested by means of equity. then the new capital structure of
AYR co shall be
Equity= $20million+$2.25milloion= $22.25million
Debt= $18 million
Let the after-tax cost of debt be 5% and cost of equity be 7%
Hence the WACC would be
=5*$18/$40.25+7*$22.5/$40.25
=6.14%
Thus, from the above calculation it is quite clear that the firm should choose the debt
as a means of financing as the weighted average cost of capital shall be lower in this
case (Lepistö & Ihantola, 2018).
v. An Assessment of the impact of the selection of finance on the current and potential
shareholders and lenders
Page 17
Let the after-tax cost of debt be 5% and cost of equity be 7%
Hence the WACC would be
=5*$20.25/$40.25+7*$20/$40.25
=5.99%
If the entire fund is invested by means of equity. then the new capital structure of
AYR co shall be
Equity= $20million+$2.25milloion= $22.25million
Debt= $18 million
Let the after-tax cost of debt be 5% and cost of equity be 7%
Hence the WACC would be
=5*$18/$40.25+7*$22.5/$40.25
=6.14%
Thus, from the above calculation it is quite clear that the firm should choose the debt
as a means of financing as the weighted average cost of capital shall be lower in this
case (Lepistö & Ihantola, 2018).
v. An Assessment of the impact of the selection of finance on the current and potential
shareholders and lenders
Page 17

This is described through the following points
a. As in the given case the amount of debt fund shall be higher in comparison to the
overall equity investment in the AYR co, hence there shall be the high risk of
bearing the burden of debt for the firm, that it must mandatorily pay to those
debtholders.
b. The creditworthiness of the company shall be highly doubtful in which owner’s
fund ids less than the borrowed funds (Johan, 2018).
c. In future it shall be difficult to raise further funds through the means of debt
financing before it repays some amount of its existing debt liabilities.
d. There is huge potential of decreasing the market price of the share of the AYR
company.
e. In future it shall become doubtful to pay dividend to its shareholders after meeting
the interest obligations of the debt fund holders (Naci & Hasan, 2012).
Conclusion
From the above detailed analysis, it is quite clear that capital budgeting techniques undoubtedly
play a major role in choosing an appropriate investment project, but the decision cannot be or
should not be finally based on the result obtained from these capital budgeting techniques. S
these capital budgeting techniques are purely based on the quantitative data, but there are
qualitative factors too that are major contributors or determinants of such decision making.
Page 18
Paraphrase This Document
Need a fresh take? Get an instant paraphrase of this document with our AI Paraphraser

Hence a careful detailed discussion is required to be made for these qualitive factors too before
reaching to a conclusion.
At the same time while making selection for the appropriate mode of financing due consideration
should be given to the both modes of financing naming debt and equity. Because though it is
correct that debt financing can provide the tax savings as the interest paid on debt is a tax-
deductible expense, but there is the risk of bankruptcy too for a firm having higher amount of
debt. At the same time if the firm thinks about to raise the amount of equity then the level of risk
taking by such equity holders get increased and consequently they may demand higher amount of
dividend. In that case they may also expect to increase the rate of dividend every year, that may
again indirectly affect the share price of the AYR company. Hence a reasonable proportion of
debt and equity is being suggested.
Finally, it is recommended to the Board of directors that they should not reach to any final
decision solely based on quantitative calculations made in this report but should resort to other
reports and other means of seeking valuable information in this regard. They may seek the help
from the experts too.
Page 19

References
Bennouna, K., Meredith, G. & Marchant, T., 2010. Improved capital budgeting
decision making: evidence from Canada. Journal of Mnagement Decisions, 48(2), pp.
225-247.
Boghossian, P., 2017. The Socratic method, defeasibility, and doxastic
responsibility. Educational Philosophy and Theory, 50(3), pp. 244-253.
Borit, M. & Olsen, P., 2012. Evaluation framework for regulatory requirements
related to data recording and traceability designed to prevent illegal, unreported
and unregulated fishing. Marine Policy, 36(1), pp. 96-102.
Carolus, J., Hanley, N., Olsen, S. & Pedersen, S., 2018. A Bottom-up Approach to
Environmental Cost-Benefit Analysis. Ecological Economics, 152(1), pp. 282-295.
Charles H, C., Giovanna, M., Dennis M, P. & Robin W, R., 2015. CSR disclosure: the
more things change…?. Accounting, Auditing & Accountability Journal, 28(1), pp. 14-
35.
Coate, C. & Mitschow, M., 2017. Luca Pacioli and the Role of Accounting and
Business: Early Lessons in Social Responsibility. s.l.:s.n.
Covaleski, M., Evans, J., Luft, J. & Shields, M., 2003. Budegting Research Three
Theoretical Prespectives and Criteria for selective Integration. Journal of
Management Accounting Research, 15(3), pp. 3-49.
Cundill, G., Smart, P. & Wilson, H., 2017. Non‐financial Shareholder Activism: A
Process Model for Influencing Corporate Environmental and Social Performance.
International Journal of Management Reviews, 20(2), pp. 606-626.
Ghofiqi, M., 2018. FORMATION OF VIEWS AND INTERESTS TO THE ACCOUNTANTS
PROFESSION IN MASTER OF ACCOUNTING STUDENTS OF JEMBER UNIVERSITY FORCE
OF 2016 USING STRUCTURATION THEORY ANALYSIS. THE 3RD INTERNATIONAL
CONFERENCE ON ECONOMICS, BUSINESS, AND ACCOUNTING STUDIES.
Gullet, N., Kilgore, R. & Geddie, M., 2018. USE OF FINANCIAL RATIOS TO MEASURE
THE QUALITY OF EARNINGS. Academy of Accounting and Financial Studies Journal,
22(2).
Hansen, S., Otley, D. & Stede, W., 2003. Parctice developments in budgeting : An
overview and Prespective Research. Journal of Management Accounting Research,
15(1), pp. 95-116.
Page 20

Johan, S., 2018. The Relationship Between Economic Value Added, Market Value
Added And Return On Cost Of Capital In Measuring Corporate Performance. Jurnal
Manajemen Bisnis dan Kewirausahaan, 3(1).
Kaufmann, W., 2017. The Problem of Regulatory Unreasonableness. First ed. New
York: Routledge.
Kusnadi, Y. & Wei, K., 2017. The equity-financing channel, the catering channel, and
corporate investment: International evidence. Journal of Corporate Finance, Volume
47, pp. 236-252.
Kusolpalalert, A., 2018. The relationships of financial assets in financial markets
during recovery period and financial crisis. AU Journal of Management, 11(1).
Lepistö, L. & Ihantola, E., 2018. Understanding the recruitment and selection
processes of management accountants: An explorative study. QUALITATIVE
RESEARCH IN ACCOUNTING & MANAGEMENT.
Naci, T. & Hasan, O., 2012. The Measurement and Management of Unused Capacity
in a Time Driven Activity Based Costing System. Journal of Applied Management
Accounting Research, 10(2), pp. 43-55.
Norberg, P., 2018. Bankers Bashing Back: Amoral CSR Justifications. Journal of
Business Ethics, 147(2), pp. 401-418.
Page 21
Secure Best Marks with AI Grader
Need help grading? Try our AI Grader for instant feedback on your assignments.

Appendix -1
Working Note No. 1
a. Statement showing the After-tax cash inflow from the Project Aspire of AYR Co.
(Figures in $)
Particulars First year Second
year
Third Year Fourth
Year
Fifth Year
Cash Inflows 650000 698750 698750 698750 698750
Less: Variable
Expenses
27000 28823 30768 32845 35062
Net cash inflow
before capital
allowance and
623000 669927 667982 665905 663688
Page 22

depreciation
and Taxes
Less:
Taxes@20%
Nil 124600 133985 133596 133181
Net cash inflow
after taxes
623000 545327 533997 532309 530507
Add:
Depreciation tax
shield@20%
[See Note
Below]
75000 75000 75000 75000 75000
Add: Capital
Allowance Tax
shield@20%
[See Note
Below]
120000 78000 69000 60000 48000
Net cash inflow
after taxes after
capital
allowance tax
shield and
depreciation tax
shield
818000 698327 677997 667309 653507
Page 23

b. Computation of Depreciation under straight method
Depreciation per annum= (Cost of the Asset-Scrap value) *Rate of Depreciation P.A
= ($2250000-$375000) *20/100
=$375000
c. Depreciation tax shield = $375000*20/100
=$75000
d. Capital Allowance Tax Shield
Year I Year II Year III Year IV Year V
=$600000*20% =$390000*20% =$345000*20% =$300000*20% =$240000820%
=$120000 =$78000 =$69000 =$60000 =$48000
e. Statement showing the After-tax cash inflow from the Project Wolf of AYR Co
(Figures in $)
Particulars First year Second
year
Third
Year
Fourth
Year
Fifth Year
Cash Inflows 955000 955000 955000 955000 955000
Less: Variable
Page 24
Paraphrase This Document
Need a fresh take? Get an instant paraphrase of this document with our AI Paraphraser

Expenses
Material cost 14400 15050 16179 17392 18697
Other Expenses 18000 16650 16650 16650 16650
Net cash flow
before taxes
923000 923300 922171 920958 919653
Less: Taxes @20% Nil 184600 184660 184434 184192
Net cash inflow
after taxes
923000 738700 737511 736524 735461
a. Add:
Depreciation
Tax Shield
90000 90000 90000 90000 90000
Net cash inflow
after taxes after
and depreciation
tax shield
833000 648700 647511 646524 645461
b. Calculation of Depreciation=$2250000*20/100
=$450000
c. Depreciation Tax Shield
=$450000*20/100
=$90000
Page 25

Page 26
1 out of 27
Related Documents

Your All-in-One AI-Powered Toolkit for Academic Success.
+13062052269
info@desklib.com
Available 24*7 on WhatsApp / Email
Unlock your academic potential
© 2024 | Zucol Services PVT LTD | All rights reserved.